Tech Hasn’t Hurt Muni Ratings Yet
There is much discussion as to the future of certain municipal credits in an era of fast-changing technology. A lot of the concern revolves around the potential impact of the emerging Transportation as a Service sector (TaaS) on credits backed in some form by current uses of various modes of transportation. One area has been the potential effect on airports that derive significant revenues from parking and car rental facilities.
So it was with interest that we viewed Moody’s recent comments about its ratings for outstanding City of College Park (GA) taxable revenue bonds (Hartsfield-Jackson Atlanta International Airport Consolidated Rental Car Facility Project Bonds). Those bonds are rated A3 by Moody’s and the outlook was revised to positive from stable. The bonds were issued for construction of a consolidated rental car facility at Hartsfield-Jackson Atlanta International Airport (ATL). The obligor of these bonds was previously the City of Atlanta, GA Airport Enterprise and they have now transferred to the City of Atlanta, GA Airport Enterprise (Consolidated Rental Car Facility Project).
Moody’s pointed to the long-term trend of growing transaction days at the facility that has produced a debt service coverage ratio above 2.0x times for the past three fiscal years. It acknowledged that transaction growth turned negative in fiscal 2018 through December. Moody’s is sorting through various factors which may have served to to turn the trend line negative. One of those factors is clearly TaaS related — increased competition from transportation network companies, such as Uber and Lyft, as we noted recently.
The single-source revenue stream pledged to the payment of bonds is a feature of the credit which must be dealt with should the impact of TaaS become more significant and permanent. The situation highlights the need for issuers to be nimble and flexible and to prepare the legislative and regulatory flexibility necessary to prepare for rapid technological change.
The rating reaffirmation comes as the airport is reevaluating its plans for future development of parking facilities at Hartsfield. Recently, the airport’s interim assistant general manager of planning and development said that the airport’s $6 billion master plan including demolishing and rebuilding its aging parking decks is being re-evaluated. Airport officials are considering whether to scale back plans for parking construction, as increased use of Uber and Lyft, and the prospect of self-driving cars, creates uncertainty around future parking demand.
More broadly, we cite three final points on the potential effect of TaaS on airport credits. First, airports serving significant metropolitan areas remain, in effect natural monopolies, that can often apply substitute sources of revenue as parking and car rental fees subside. Second, implementation of TaaS is in its extremely early stages, which will lead to much greater effects on airport net revenues in later years. And finally, while rating agencies are beginning to examine the implications of technological change for various types of credits, it is as yet too early to see the type of major changes in revenue sources and trends that would led to dramatic changes in ratings. At this point, it is up to investors/portfolio managers to consider how much they need to extrapolate from current economic and financial conditions to future potential outcomes.
Population Data Tells a Story
The Dallas-Fort Worth-Arlington metropolitan area’s 146,000-population increase last year was the most of any metro area, and Maricopa County, Arizona, saw a population increase of nearly 74,000 — the most of any county last year — according to the U.S. Census Bureau’s July 1, 2017, population estimates. Among the nation’s counties, the top 10 with the largest numeric growth are all located in the South and West. The 10 largest counties in the country all maintained their rank compared to last year. From July 1, 2016, to July 1, 2017, six of the top 10 largest-gaining counties were in Texas — Bexar, Collin, Dallas, Denton, Harris and Tarrant.
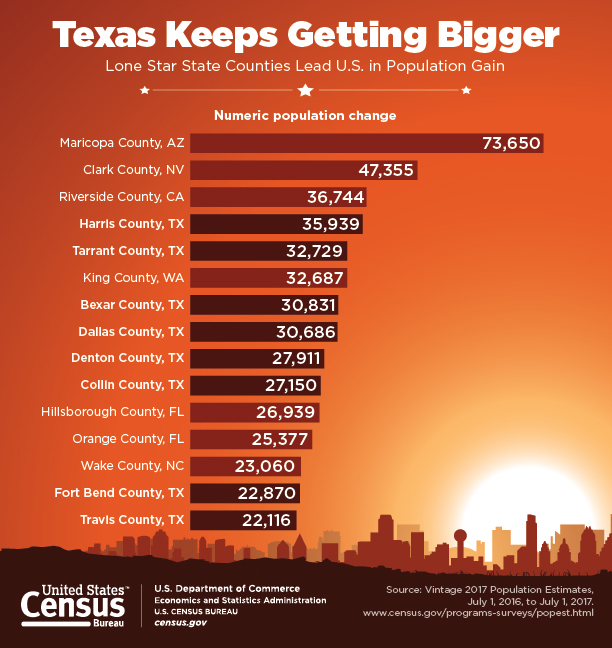
The remaining four counties on the list were Maricopa County, AZ.; Clark County, NV.; Riverside County, CA.; and King County, WA.
Many of the top 10 metro areas with the largest numeric increases in 2015-2016 were also in the top 10 in 2016-2017, with the following notable exceptions:
Washington-Arlington-Alexandria, DC-MD-WV., climbed to 5th in 2017 from 11th in 2016, and Riverside-San Bernardino-Ontario, CA, jumped to 7th in 2017 from 13th in 2016. In 2017, the Baltimore metro area was now the 20th most populous metro area, up from 21st place in 2016. Net domestic migration is the driving factor behind all of the top 10 fastest-growing metro areas that rose in rank — St. George, UT; Coeur d’Alene, ID; Greely, CO.; Lakeland, FL; and Boise, ID.
The St. Louis, MO-IL. metro area dropped out of the top 20 most populous metro areas and swapped places with Baltimore to its new 2017 standing of the 21st most populous area in the nation. In 1960, St Louis was the 9th largest metro area. One consistent factor in terms of population declines was reflected in the fact that all 10 of the largest declines were in rural counties.
A number of “core” counties — those that are substantially made up of a major large city saw small statistical declines (<0.5%) — Chicago, St. Louis, Baltimore, Milwaukee, Cleveland, Pittsburgh, Detroit. The question that is not readily apparent from the data is why are these people moving? In many cases, housing costs in core urban areas have been increasing. This has forced out residents who can no longer afford to buy, or rent, for that matter. That raises the issue of whether the remaining population is actually made up of higher income individuals who can afford to maintain higher property values. In effect a leaner but stronger local economy.
Chicago keeps being at the center of much conversation regarding population trends. A look at recent data shows that values in the City’s tonier districts are actually rising and with some consistency. At the same time, the outflow from some of the City’s poorer neighborhoods may be what is accounting for city population declines. There is anecdotal evidence that the population of the City’s crime ridden South Side is generating the number. The poor housing, underperforming schools, and dangerous conditions lead to a sense of desperation that outweighs the economic risks of moving without being in possession of a job at one’s chosen destination.
The theory is also supported by data from other areas. Of all places, Brooklyn, NY experienced a net decline in population. This occurs in the face of mass gentrification which has made it harder and harder for long-time low income residents to hang on in the face of higher housing costs. As those costs approach a greater and greater proportion of income (and a huge shortfall of affordable and/or public housing exists) it is likely that lower income outmigration accounts for population loss.
So the question is, how much of an impact is this population loss on credit? If it results in a higher property value, higher income demographic profile than the change is more of a statistical phenomenon than a real credit negative. It may result in some unfavorable per capita credit rating statistics but this implies that a more sophisticated analysis may be needed. Something to keep in mind as credit analysis becomes more quantitative and ratio based with the proliferation of data providers in the muni space.
Neighborly Insights
by Joseph Krist
03/28/2018
Insights is brought to you by Court Street Group
Disclaimer: Neighborly has entered into a paid agreement with Court Street Group to provide commentary on a regular basis to all customers, users, prospective customers, and prospective users of Neighborly and Neighborly Securities. The opinions and statements expressed in this report are solely those of the author(s), who is solely responsible for the accuracy and completeness of this report. The opinions and statements expressed on this report are for informational purposes only, and are not intended to provide investment advice or guidance in any way and do not represent a solicitation to buy, sell or hold any of the securities mentioned. Opinions and statements expressed reflect only the view or judgment of the author(s) at the time of publication, and are subject to change without notice. Information has been derived from sources deemed to be reliable, but the reliability of which is not guaranteed. Readers are encouraged to obtain official statements and other disclosure documents on their own and/or to consult with their own investment professional and advisors prior to making any investment decisions.