Taylor Riggs, a contributor to Bloomberg Briefs, talks with reporter Amanda Albright about this week’s municipal market news.
Watch the video.
Bloomberg Briefs
October 13, 2016
Taylor Riggs, a contributor to Bloomberg Briefs, talks with reporter Amanda Albright about this week’s municipal market news.
Watch the video.
Bloomberg Briefs
October 13, 2016
NEW YORK — In July, investors gobbled up $1 billion of bonds from a financially-strapped Catholic hospital system in Illinois called Presence Health Network, even though it offered few contractual guarantees debt buyers typically require.
The deal, rated just above junk status, is emblematic of a fever that has swept the $3.7 trillion U.S. municipal bond market: yield-chasing investors not only piling into riskier debt, but also increasingly willing to accept less protection in the event of a default.
Some portfolio managers say it has been a decade since they have seen such a strong seller’s market.
“It’s reminiscent of right before the Great Recession, where there was a long period where high-yield rates were low and demand was high,” said William Black, senior portfolio manager for the City National Rochdale Municipal High Income Fund.
Low and negative sovereign interest rates have contributed to a scramble for relatively higher yielding U.S. municipal debt. Foreign buyers now hold more muni bonds than ever, U.S. Federal Reserve data show.
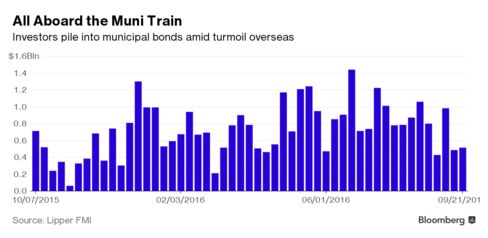
Overall, investors have poured nearly $10 billion into high-yield municipal bond funds so far this year, according to data from Lipper, a Thomson Reuters unit. That is more than any other full year in nearly the last quarter century except 2006, which had $10.1 billion of inflows. (Graphic: http://tmsnrt.rs/2dylqFl)
Taking advantage of the seemingly insatiable demand, some borrowers are offering weaker or fewer guarantees, so-called covenants, such as debt reserve funds and debt service coverage ratios.
Because they are based on many factors, credit ratings alone may not reflect the quality of covenants, so some investors may be taking on greater risks than they realize.
Such “covenant light” bonds were harder to offload after the market tumbled in late 2008, while investors who held them saw valuations swing wildly because of infrequent trading and huge price gaps, analysts said.
“Some funds got just clubbed. That was frankly very traumatic for a lot of investors, and fund managers too,” said Joseph Krist, partner at the Brooklyn-based public finance consulting firm Court Street Group.
In a default, workouts are harder. Covenant light bondholders have fewer tools to intervene, for example by requiring issuers to hire turnaround professionals or take other corrective action earlier. They also risk deeper losses in bankruptcy than those with greater protection.
HEALTHCARE AND CHARTER SCHOOLS
Sectors such as healthcare, charter schools, and senior living facilities tend to be more prevalent covenant light issuers, in part because they may struggle more to generate consistent operating margins.
Hospitals and charter schools issued 44 percent and 76 percent more debt by par amount so far this year, respectively, compared with 2015, Thomson Reuters data show. Senior living facility issuance rose 6 percent.
They come in other sectors too. The city of San Antonio, Texas, sold AA-rated junior lien water system bonds on Thursday without a reserve fund – a fact disclosed in the title of the bond documents.
But many covenant light deals are unrated or speculative grade. Issuers have sold more than 400 percent more bonds rated junk at BB and BB- by S&P Global Ratings so far this year than last year, Thomson Reuters data show.
One such example is Summit Academy North, a junk-rated Michigan charter school that missed deadlines for annual financial data in four of the last five fiscal years, according to bond disclosures.
Summit sold $22.5 million of refunding bonds on Aug. 31 with a cash on hand liquidity threshold of just 30 days, a very low level for the sector.
Even so, the top yield was just 4.75 percent on 2035 bonds – a rate that an investment-grade borrower would have likely offered only a couple of years ago.
“I cannot believe some of the deals that are getting done in the muni market right now – without a mortgage, low debt service reserve fund,” Mark Paris, head of municipal portfolio management at fund manager Invesco, said at a recent event.
Some funds say they have little choice but accept fewer safeguards in order to put clients’ cash to work.
“Money is coming in to the point where people have to buy something,” said one market professional who declined to be named.
Institutional investors have pushed back by demanding greater liquidity covenants, said Mark Taylor, a portfolio manager and head of high-yield research at Alpine Woods Capital Investors.
By September, he had a stack of rejected deals in his office that was four-feet tall, Taylor said. Nonetheless, the deals he has turned down are getting picked up by others.
“There is a plethora of deals coming to market that people probably would have rejected nine months ago.”
By REUTERS
OCT. 11, 2016, 1:03 A.M. E.D.T.
(Reporting by Hilary Russ; Editing by Daniel Bases and Tomasz Janowski)
NEW YORK — The great bull run for the municipal-bond market may be running out of juice.
For the past year, bonds issued by state and local governments have been red-hot investments. Muni-bond mutual funds have had 53 straight weeks of inflows, according to the Investment Company Institute. That’s one of the longest streaks on record, and they attracted cash at the same time that investors were leaving stock mutual funds. Even Puerto Rico’s default on its debt and Britain’s vote to exit the European Union, which roiled bond markets worldwide earlier this year, didn’t interrupt the muni market’s trajectory.
“Munis have been the darling asset class of the past two or three years,” says Chris Alwine, head of the municipal group at Vanguard.
Now there are signs that this long bull run may be coming to an end. After 10 straight months of positive monthly returns, the iShares National Muni Bond exchange-traded fund, the largest muni ETF by assets, posted a very narrow loss in July. While returns were positive in August, the fund lost about 0.6 percent in September and is on track for another loss in October.
Munis have always appealed to U.S. investors, who are attracted to their reputation for safety and the fact that their income is free of federal income taxes. It’s an incentive offered to get investors to lend to local government so they can build schools, highways and sewer systems. In some cases, income from muni bonds is also free from state or local income taxes.
Over the past 12 months, the iShares ETF has returned 4.3 percent. That beats the returns for the largest bond mutual fund, Vanguard’s Total Bond Market Index fund, which returned a nearly identical amount, after taking into account the tax savings.
In the past couple of years, low interest rates around the world and a volatile stock market have also driven investors from outside the United States into the municipal-bond market, even though non-U.S. residents don’t get the tax advantages.
Given how high prices for muni bonds have moved, some fund managers say that a pullback is inevitable. The 10-year yield on the AP Municipal Bond index, which moves inversely to bond prices, hit a low of 1.69 percent in July and has been climbing ever since. It ended last week at 1.878 percent. Even the relatively small increase in yields has put downward pressure on prices of municipal bonds, says James Kochan, chief fixed-income strategist at Wells Fargo Funds Management.
If many of the recent muni buyers have been coming with the intent of avoiding turmoil elsewhere in the bond world, a few months of negative returns for munis could spark a sell-off.
It wouldn’t be the first time that investors in munis, a historically sleepy market, have been spooked in recent years. The most recent case was in the 2013 “taper tantrum,” when investors became anxious about the possibility of an upcoming interest-rate increase. When investors dumped muni bonds during that episode, prices quickly dropped. The iShares ETF lost 8 percent in just four months.
“I think some investors are taking more risk than they are aware of,” says Chris Ryon, portfolio manager at Thornburg, who co-manages one of the largest muni bond funds.
Given the uncertainty, investors who hold munis should be looking to pare back on risk, says Ryon, who suggests sticking with higher-quality muni offerings, especially because lower-rated muni bonds aren’t offering that much more income than higher-quality muni bonds. In the parlance of bond investors, the “spread” is not that wide.
With that said, there’s no need to ditch high-yield munis entirely, says Peter Hayes, head of the municipal bonds group at BlackRock. “For the rest of the year, we think returns will be largely generated by income,” he says. “That means you need to own some amount of high-yield.”
Investors should also shorten the duration, or maturity, of their holdings, says Wells Fargo’s Kochan, because prices of longer-term bonds tend to fall more when interest rates rise.
Hayes says he favors 15-year maturities, which he calls the “sweet spot.” The good news for investors: With global interest rates still extremely low and the credit quality of munis generally stable, most experts view the recent dip as a pullback, not the start of a bear market.
Says Hayes: “The past month has created a little bit of better buying opportunity.”
By THE ASSOCIATED PRESS
OCT. 13, 2016, 12:39 P.M. E.D.T.
Municipal bond issuance for September swelled 45% to $35.7 billion, the highest volume for the month in records going back to 1986, driven by an unexpected surge in new money deals.
The total par amount of the month’s 980 sales surpassed the previous September volume record set in 2010, when $35.6 billion of bonds were sold. Through three quarters, the market has produced $334 billion of issuance in 10,046 deals, according to data from Thomson Reuters, on pace to surpass the $400 billion mark. At this time last year volume totaled $319.4 billion in 10,359 deals.
The largest recorded issuance year was 2010, when the volume hit $433.27 billion.
“It certainly seems likely given that October should also be heavy, with more than $14 billion next week. We had [estimated] $400 billion with a possible upside surprise and it seems the surprise might actually be happening,” Mikhail Foux, director of research at Barclays Capital, said Friday.
Foux said new money deals have been the biggest surprise.
“Who would have thought that after such a slow first quarter, we are likely going to surpass last year’s number, which one of the largest ever years in terms of issuance,” he said. “A pickup in new money is the biggest story of 2016 and likely going forward. It seems that we are finally starting to address our infrastructure needs. There was a lot more issuance from the transportation sector and there is more than $200 billion of bond deals on ballots.”
For the third quarter alone, there were $109.7 billion of deals in 3,131 transactions, up from the $92.6 billion in 2,951 transactions during the third quarter of 2015.
“The sheer amount of issuance has been pretty impressive. I think the hope is that the amount of supply puts some pressure on the yields and creates a backup, which would be welcomed,” said Dawn Mangerson, managing director and senior portfolio manager at McDonnell Investment Management. “We said issuance wouldn’t wane, and we were right. We are looking good right now; we should see a decent calendar throughout the rest of the year.”
Though volume was up the past two months and third-quarter issuance increased year-over-year, volume for the three months was down from the second quarter.
“The volume hasn’t reached a point where it was too much for the market to absorb,” Mangerson said. “It has been surprising how much consistent high demand for munis we have seen all year long and also that we didn’t see any volatility this month.”
Mangerson said volume could slip toward the end of the year, when and if the Federal Open Market Committee decides to raise rates.
“The second quarter is typically the heaviest; we had a substantial slowdown in July – partially due to Brexit- but supply picked up in August and September,” Foux said, referring to the British vote to leave the European Union.
For the month, new money deals catapulted nearly 68% to $16.99 billion in 470 issues, from $22.21 billion in 799 issues during the same period last year.
Refundings, which have been strong for most of the year due to persistent low interest rates, were up 19% to $12.19 billion in 423 transactions from $10.23 billion in 353 transactions during September of last year.
Combined new-money and refunding issuance rose by 54.6% to $6.51 billion from $4.21 billion.
Negotiated deals were higher by 57.7 % to $27 billion, while competitive sales increased by 58.6% to $7.61 billion from $4.79 billion.
Issuance of revenue bonds increased 82.2% to $26.65 billion, while general obligation bond sales were down 9.1% to $9.05 billion.
Taxable bond volume increased 32.8% to $2.13 billion, while tax-exempt issuance increased by 45.2% to $32.25 billion.
Minimum tax bonds issuance gained to $1.32 million from $760 million.
Private placements sank to $1.09 billion from $2.66 billion.
Zero coupon bonds more than doubled to $360 million from $132 million.
Bond insurance increased 26% for the month, as the volume of deals wrapped with insurance rose to $1.84 billion in 140 deals from $1.46 billion in 117 deals.
Variable-rate short put bonds gained 7.7% to $1.06 billion from $986 million. Variable-rate long or no put bonds jumped to $734 million from $31 million.
“This is probably due to all the SIFMA related concerns, much higher SIFMA and libor rates are making issuing floating rate notes more costly,” said Foux.
Bank qualified bonds improved 6.4% to $1.59 billion from $1.49 billion.
Seven out of the 10 sectors saw year-over-year gains. Health care more than doubled to $5.69 billion from $1.67 billion, utilities also more than doubled to $3.32 billion from $1.36 billion, general purpose increased 34.6% to $8.44 billion from $6.27 billion, housing rose to $2.16 billion from $943 million, health care increased to $5.69 billion to $1.66 billion, environmental facilities climbed to $379 million from $76 million and electric power went up to $1.83 billion from $516 million.
On the other end of the spectrum, the education sector was barely down to $7.17 billion from $7.20 billion, development dropped 15.9% to $729 million and public facilities were down to $932 million from $1.04 billion.
As for the different types of entities that issue bonds, five were in the green: state governments, state agencies, counties and parishes, cities and towns and districts.
One other thing that Foux noted was that in general, issuers tried to bring deals before FOMC announcements, not just this month but in general.
“It seems that we see more pension obligation bonds, as issuers are trying to plug the pension funding gap.”
California is still the top state for issuance for the year to date, followed by Texas, New York, Pennsylvania and Florida. These numbers encompass all of the individual issuers within the state.
Golden State issuers this year have sold $47.53 billion, with the Lone Star State in second with $41.55 billion. The Empire State follows with $35.36 billion. The Keystone State is in fourth with $15.24 billion and The Sunshine State rounds out the top five with $15.08 billion.
“October could be solid as issuers could try to bring deals before the elections,” Foux said. “November and December should be lighter, though we have some uncertainty related to the December FOMC and issuers might try to pull deals from January to get in front of it.”
The Bond Buyer
By Aaron Weitzman
September 30, 2016
Regardless of which candidate takes the oath of office next January, improving our country’s infrastructure will be on the next President’s agenda.
An Association of Equipment Manufacturers poll shows that over 70% of Americans want government to address our growing infrastructure crisis.
Turning that into reality will require a clear understanding that the need for additional investment is real.
Members of Congress, governors and mayors from across the country have advanced bipartisan solutions to broadly address this critical need. So too has the financial services sector that works with federal, state and local governments to raise capital crucial to infrastructure investment.
Nevertheless, the level of investment by government and the private sector falls short of meeting the nation’s current and future infrastructure needs, and the central question remains how to pay for it.
We need to do more with existing resources while not losing sight of the crucial need for more investment to pay for infrastructure needs. While others attempt to address the political challenge of identifying more sources of infrastructure funding, we can work toward implementing a few tangible policy ideas.
Two ways for state and local governments to achieve more with existing resources is by encouraging broader use of a construction procurement method called design-build and treating infrastructure as assets.
The traditional approach to project procurement is known as “design-bid-build,” a multi-step process that separates the design and construction functions. Design-build simplifies the process by making a single entity responsible for both and collapses the procurement into one step, saving time and delivering a better, more cost effective result.
In New York, the NYU Rudin Center for Transportation and Citizens Budget Commission completed studies projecting design-build savings of up to 20% compared with traditional methods. However, design-build is still not broadly available for public infrastructure projects in all 50 states.
State and local government should also treat infrastructure as assets through better tracking and disclosure of on-going costs. The benefits are two-fold: a healthier understanding of the true ongoing costs and greater transparency will lead to more private sector involvement.
Identifying non-essential assets that can be auctioned to the private sector and put to productive use can create new revenue for government without affecting its core mission, a win-win scenario.
Three quarters of annual infrastructure spending in the U.S. is funded through the $3.7 trillion municipal bond market, where private investors purchase tax-exempt bonds issued by state and local governments.
The key advantage of municipal bonds is that interest on them is exempt from federal and state income taxes. This means investors will accept a lower interest rate, providing state and local governments with the benefit of borrowing money at the lowest interest rate available to anyone financing infrastructure, including the U.S. Treasury. This also allows state and local governments to raise capital up front to fund long use projects like airports, roads and bridges and amortize the cost over the life of the project.
The next administration should avoid calls to curb the use of tax-exempt bonds and rather seek to create a more certain tax and regulatory environment expanding the use and easing the availability of lower cost municipal debt for public-private partnership (P3) projects that involve a government entity.
Our economic competitors are using P3s as a way to capture private sector efficiencies while providing public infrastructure and retaining government ownership.
Making tax-exempt financing available for P3 projects would allow the two models to converge, leaving state and local governments with the best of both – access to the lowest cost financing available and private sector efficiencies.
The Move America Act, bipartisan legislation sponsored by Senators Ron Wyden (D-OR) and John Hoeven (R-ND), would authorize Move America Bonds, a new category of tax-exempt bonds that would be exempt from most private use restrictions, as long as the facilities are available for public use.
Providing tax incentives for investment in targeted sectors has been an effective in low income housing development and more recently renewable energy production. The Move America Act would provide for a limited, targeted tax credit applicable to equity investments in infrastructure, and Congress should consider such an idea.
The next president and Congress should embrace these ideas and spur a new chapter of infrastructure revitalization that will strengthen our economic future.
The Bond Buyer
By Kenneth E. Bentsen, Jr., and Chris Hamel
September 26, 2016
Kenneth E. Bentsen Jr. is president and CEO of the Securities Industry and Financial Markets Association. Chris Hamel is head of Municipal Finance at RBC Capital Markets and chair of SIFMA’s Infrastructure Policy Committee.
WASHINGTON – Infrastructure projects in the U.S. are plagued by long pre-construction periods, an under-utilization of the public-private partnership financing model, and an inability to both gain public support and access capital, a panel of market participants said this week.
The four-member panel at the Securities Industry and Financial Markets Association’s annual conference here on Tuesday, entitled “Financing Infrastructure for the 21st Century,” discussed ways in which P3s could be used in order to improve roads, bridges and other struggling areas in a more effective manner.
Chris Hamel, the moderator of the panel and the managing director and head of the municipal finance group for RBC Capital Markets, said the panel’s goal was to foster a discussion on solutions rather than the underlying problems. He stressed the advantageous features of the $3.7 trillion muni market that allows for borrowing at a cost lower than Treasury rates.
The panel estimated that the U.S. is in need of $3.6 trillion of infrastructure investments by 2020, and cited a recent study that found 70% of Americans want governments at all levels to do more about infrastructure.
“We need to capture what is unique about our tax exemption and our highly decentralized government structure and combine it with the effectiveness of the private sector,” Hamel said.
“It is going to come from a collaboration of people with multiple levels of expertise.”
Several of the panel members, including Geoffrey Chatas, senior vice president and chief financial officer for Ohio State University, gave examples of how private help has been used effectively to expedite projects and help in their management after construction.
Chatas cited how his school’s airport, seven hospitals, set of energy assets and parking garages have been made possible by using the expertise of private entities. Ohio State is not shying from issuing debt, he said, adding that the school has had $3.5 billion in issuances over the last 20 years, while higher education costs have quadrupled.
The $483 million upfront payment for a 50-year lease for a campus parking lot in 2012 has allowed for an endowment distribution of $105 million over the past four-and-a-half years, he said. Those funds have been allocated toward an arts district, a campus bus system, student scholarships and faculty hirings.
Chatas said there have been “outstanding” financial results, although he did admit growing pains in managing some of the parking facilities during the culture change.
“We’re trying to think very differently,” Chatas said. “Let’s bring in partners, let them raise the capital and then manage the properties. Let us focus on teaching and learning.”
Tyler Duvall, a partner at McKinsey & Company in Washington, said that the pre-construction process for national infrastructure projects is “a major problem,” one that can often take between 40-60 months. This is often due to complex disclosure mechanisms around the environmental review process, leading to more discussions than decisions, he said.
There is no federal government entity that currently exists to accelerate both this process as well as a more effective revenue stream once construction begins. He suggested the federal government create one to have someone accountable for the end-to-end process and put the U.S. more on a par with Canada and Australia in terms of their infrastructure success.
The federal government has also been plagued by a lack of a problem statement in the highway area, he added.
“The capital is there and it’s cheaper than ever,” Duvall said. “That’s not the issue. Connecting the capital with projects is the issue.”
Suzanne Shank, chairwoman and CEO of Siebert Cisneros Shank & Co., a municipal investment bank based in New York City and Oakland, Calif., agreed Tuesday that the U.S. has some catching up to do with other countries.
“We’re not making headway and the gap is growing,” she said.
Duvall said the U.S. has “phenomenal” lending programs that need to be tweaked to create better revenue streams, a task he said can be done administratively without legislation.
“It’s all about prioritization,” he said.
Another successful P3 cited by the panel was the $4 billion renovation of LaGuardia Airport in New York, which began in June. Francis Sacr, managing director of infrastructure and transportation project finance for Societe Generale, the corporate and investment bank that served as the financial advisor to LaGuardia Gateway Partners, said it proved complicated because of the multiple financers involved.
Sacr said the project to renovate the dilapidated airport used $1 billion of passenger facility charge revenues from the Port Authority of New York and New Jersey as well as $2.5 billion from special facilities bonds and up to $500 million in taxable delayed-draw private placement bonds.
As the largest airport financing deal ever done in the U.S., the P3 structure proved especially beneficial because of the cost overruns, he said.
“Finding multiple sources of capital was the most important part of the solution,” Sacr said.
On a macro level, Sacr said an underinvestment in U.S. infrastructure comes partially as a result of what he feels is shortsightedness.
“Infrastructure is a long-term investment, while politics is a short-term focus,” Sacr said. “It really does require a long-term vision from the governments involved.”
The Bond Buyer
By Evan Fallor
September 28, 2016
PHOENIX – The DC Water and Sewer Authority closed on a historic deal Thursday, issuing the nation’s first Environmental Impact Bond (EIB) to fund the initial green infrastructure project in its DC Clean Rivers Project.
The $25 million, tax-exempt EIB was sold in a private placement to the Goldman Sachs Urban Investment Group and Calvert Foundation, netting DC Water a 3.43% interest rate that is comparable on a cost of funds basis to its historic cost.
The proceeds of the bond will be used to construct green infrastructure to absorb and slow surges of stormwater during periods of heavy rainfall, preventing an overflow of untreated sewage (known as a combined sewer overflow, or CSO) into the Potomac and Anacostia Rivers or their tributaries. The green infrastructure includes absorbent materials and gardens that mimic natural rain absorption processes.
The EIB allows DC Water to attract investment in green infrastructure through an innovative financing technique whereby the costs of installing the green infrastructure are paid for by DC Water, while the performance risk of the green infrastructure in managing stormwater runoff is shared among DC Water and the investors. As a result, payments on the EIB may vary based on the proven success of the environmental intervention as measured by a scientific evaluation of the results.
The structure of the deal includes three “tiers” of performance depending on how well the green infrastructure controls the runoff.
The investors will receive interest payments as typical for bondholders. Depending on the results, an additional payment may be due on the bonds’ mandatory tender date of April 1 2021.
If runoff reduction is greater than 41.3%, a “tier 1” outcome, the investors will receive from DC Water an “outcome payment” of $3 million. In a tier 2 outcome where runoff reduction is 18.6% or better but less than 41.3%, the investors will be due only their normal principal and interest.
In a failed tier 3 outcome where runoff reduction is less than 18.6%, the investors will owe DC Water a “risk share” payment of $3.3 million that the trustee will then factor into future payments. That would net the investors a roughly 0.5% return, and DC Water would abandon green infrastructure for traditional tunnels or “gray” infrastructure.
“This environmental impact bond represents the first time that DC Water has explicitly tied financial payments to environmental outcomes, in this case reducing stormwater runoff, which causes the CSOs that pollute the District’s waterways,” said DC Water chief financial officer Mark Kim.
Kim said the EIB is on DC Water’s subordinate lien, on par with the majority of its debt. DC Water is a regional water authority that provides services to the District of Columbia, as well as to parts of Maryland and Virginia.
“This unique bond offering is the result of DC Water’s relentless commitment to innovate and pursue every available avenue to provide the best service at the best price to our customers and to the greater community we serve,” said chief executive officer and general manager George S. Hawkins.
Kim said that a tier 2 result is thought to be most likely, and that DC Water and its nontraditional muni investors were willing to make a bet together that green infrastructure would be successful.
“We’re thrilled to partner with DC Water to help pioneer this innovative financing mechanism that will not only benefit the community environmentally, but also stimulate local job creation,” said Margaret Anadu, Goldman Sachs managing director who leads the Urban Investment Group. “This first ever environmental impact bond will finance the construction of green infrastructure and support economic development in the District.”
Beth Bafford, investments director for Bethesda, Md. based nonprofit Calvert Foundation said the foundation was excited to test how effective the green infrastructure would be and noted its potential as a national precedent for water utilities.
“This work is critical for residents in our hometown and has national implications for how to finance green infrastructure solutions to combat the effects of extreme weather on aged, vulnerable sewer systems,” Bafford said.
The White House also commented on the potential of the unique deal to create a model for other issuers. The project’s development was aided by a federal Social Innovation Fund Pay For Success Grant.
“In launching a project that is the first of its kind in the nation, DC Water has opened the door for others to follow their example,” said Dave Wilkinson, director of the White House Office of Social Innovation.
Public Financial Management is financial advisor for the deal, with Squire Patton Boggs as bond counsel and the Harvard Kennedy School Government Performance Lab providing technical advice. Quantified Ventures was the Pay for Success transaction coordinator, and Orrick, Herrington & Sutcliffe is investors’ counsel.
The Bond Buyer
By Kyle Glazier
September 29, 2016
Mayor Sylvester Turner is garnering praise for his proposal’s comprehensiveness and balance.
Earlier this month, Houston Mayor Sylvester Turner released his outline for fixing the city’s underfunded pension system, an issue that earned the city a credit rating downgrade in March.
Observers say the plan is the best effort yet at solving a problem that has eluded past city officials. If approved, the proposal would immediately cut Houston’s unfunded liability by $3.5 billion — or nearly in half — while putting Houston on a path to pay off the rest of its pension debt over the next generation.
The proposal has several moving parts, including concessions from city workers, a requirement that the city make its payments going forward and a change in some accounting assumptions as a way of making the system less exposed to the risks of the financial market. It also calls for issuing pension obligation bonds to help plug the funding hole.
What makes the effort even more remarkable is that Turner is less than a year into his first term. But Turner is no ordinary first term mayor.
Prior to being elected, he had already spent 25 years serving a portion of the Houston metro area in the state legislature. It’s his experience and the connections he’s made, both politically and in the business community, that Turner will draw on when he takes the proposal to the city council in early October. The state legislature ultimately has final approval on any changes to the pension system, but most believe that Turner will encounter little resistance there.
“The number one thing is the relationships Mayor Turner has,” said city finance director Kelly Dowe, whom Turner kept on from the previous administration. “When he says, ‘Folks, this isn’t sustainable,’ it’s different from someone else saying it.”
Indeed, Turner’s proposal appears to strike the right amount of give-and-take that’s required for all parties to get on board. First, the city is stepping up in terms of accountability, meaning it would be required to make its pension payment annually.
What’s more, the system would immediately incorporate a more realistic investment rate of return assumption in valuing its pension liabilities. Currently, Houston is an outlier among public plans and assumes its investments will earn 8 or 8.5 percent annually. That’s much higher than the national average of plans and even higher than Houston’s recent investment experience. Turner’s proposal assumes a 7 percent rate of return, which is lower than the national average and bumps up Houston’s total liabilities to a more realistic $7.7 billion (from under $4 billion as reported).
The pension plans would also switch from an open amortization period — which is like refinancing your home every year and never paying off the loan — to a closed one. That change puts the city on a path to fully pay off its pension debt over 30 years.
In terms of employee concessions, Turner is deftly leaving it up to the unions. At a press conference announcing the reform, he said the three plans in the pension system had identified a collective $2.5 billion in cuts. While not specific, that will likely mean some combination of cuts to retirees’ cost-of-living adjustments and their deferred retirement option plans benefits, which allow retirement-age employees to keep earning retirement benefits as they continue to work.
The planned issuance of pension obligation bonds would infuse another $1 billion into the system, bringing down the total unfunded liability to about $4.2 billion. Issuing bonds to plug pension funding holes can be controversial because it doesn’t eliminate debt, it simply moves it from a pension system’s balance sheets to the city’s debt ledger.
City Controller Chris Brown said at a discussion last week hosted by Rice University’s Kinder Institute that he is typically skeptical of issuing pension obligation bonds. But he added he would support the idea as long as the city doesn’t use the bonds as a replacement for making its annual payments and if Houston receives a favorable interest rate on the bonds.
Notably, Turner’s proposal doesn’t call for a new tax as has often been done in other places — such as Chicago — as a way to get a poorly funded pension plan back to health. That aspect has pleased the business community, which has said it wants the city to get its pension costs under control before discussing taxes. But Turner does plan to ask city voters next year to lift Houston’s 12-year-old revenue cap to help reinvest in needed infrastructure and parks projects.
So far, the Houston Municipal Employees Pension System and the Houston Police Officers’ Pension System have signed on to the mayor’s plan. That leaves the Houston Firefighters’ Relief and Retirement Fund, which has yet to endorse Turner’s proposal. The firefighters’ plan is directly controlled by the legislature. That means if they don’t sign on to the reform, they risk “the horrendous challenge” of the legislature making changes to their plan, said Max Patterson, the executive director of the Texas Association of Public Employee Retirement Systems.
“Generally speaking, [employees] should be happy with this,” he said at last week’s event. “Because you have to measure it against the other side of, if I don’t get this, what will I get?”
GOVERNING.COM
BY LIZ FARMER | SEPTEMBER 29, 2016
For years there have been voices writing, speaking and worrying about U.S. unfunded pension liabilities. I, for one, included. Never should investors ever buy pension obligation municipal bonds. Cities, states and counties issue POBs because their pensions are grotesquely under water and they cannot meet their liabilities. The reasons are long, but pretty simple: Poor investment results; demographic shifts due to people living longer; mismanagement; devastating union-negotiated wage and benefit increases; low retirement age; and unrealistic assumed rates of return on assets.
The numbers in many circumstances are unconscionable. California State Teachers Retirement System returned 1.4% in fiscal year end June 30. Their target was actually 7.50%. Springfield, Illinois owes $21 million to pay police and firefighter pensions. That doesn’t sound too bad until you realize the $21 million represents 98% of all property tax revenues. According to Standard & Poor’s, the city of Houston, Texas has racked up pension costs from 2012 to 2015 that rose 48%. What will they do? Issue $1 billion in POBs—a hail Mary pass if ever there was one.
You are probably wondering why pension funds don’t reduce their assumed rates of return to something realistic. Like taking their 7.50% fantasy returns to a more logical 4% to 5% return. The reason is simple. Such target rate of return reductions require real cash infusions to make up the difference.
So we find ourselves at the tail end of an equity bull market that began in March 2009 and a 30-plus year bond bull market. And yet pensions remain woefully underfunded.
The best objective source of research comes from PEW Research. Google PEW Research, unfunded pension liabilities. You’ll find analyses on states and city funding gaps, states in the worst and best shape, data on the 50 state trends, and retiree health care trends. It all adds up to dismal funding for many cities that made promises to pensioners they simply cannot keep.
So why the rant? As the problem gets worse and being we are at the tail end of this credit cycle, general obligation municipal bonds issued by these same states, cities and counties will be severely downgraded. More nails in the coffin that GOs should no longer be the darlings of your municipal bond portfolio .
Connect the dots. As pension funding takes more and more revenue from their general funds, more GO bonds will have to be issued for essential services—schools, roads, welfare, the homeless. All will create a giant revenue sucking sound while essential services deteriorate. The reasons are precisely why revenue bonds—specific revenue bonds—are more desirable than GOs.
Invest in senior airport revenue bonds from major U.S. airports—no local mini airports. Names like Atlanta Hartsfield, Los Angeles International, Dallas Fort Worth, JFK and San Francisco. Major city senior airport revenue bonds are my top pick now.
If you are seeking more yield than airport revenue bonds, then selectively buy hospital revenue bonds. Not your local hospital, but major institutional teaching hospitals like Stanford, Mayo Clinic, Mount Sinai, Cedars-Sinai, University of Colorado Hospital, to name a few.
The weather report declares an unfunded pension tsunami. Please prepare so your portfolio doesn’t drown.
Forbes
by Marilyn Cohen, Contributor
SEP 26, 2016 @ 12:39 PM
Marilyn Cohen is president of Envision Capital Management, Inc., a Los Angeles fixed-income money manager.
Opinions expressed by Forbes Contributors are their own.
New Jersey is on the brink of realizing the American Dream — if the definition is a mega-mall in the middle of a marsh.
A state agency approved $1.2 billion of tax-exempt municipal bonds for Canadian developers Triple Five Worldwide. The company plans to complete a partially built “world-class destination” of shops, restaurants and entertainment attractions in the Meadowlands, 10 miles west of Manhattan, where previous developers ran out of money.
The Sept. 15 decision to float the bonds reignites a debate in New Jersey over the use of government subsidies to foster economic development. Buyers of the bonds won’t pay federal tax on the income, making U.S. taxpayers silent partners in the project. And in addition to paying a lower interest rate than they would on taxable bonds, the developers get a $390 million state grant over time if they reach sales-tax targets.
“It’s essentially crony capitalism,” said Republican State Senator Michael Doherty, who represents a west-central New Jersey district. “Our credit rating is in the crapper and we’re going to triple down by giving more than $1 billion to a private mall developer.” The state has halted non-emergency road improvements for lack of money and faces an $80 billion pension deficit.
Boost Economy
To supporters, American Dream promises to boost New Jersey’s economy, which lagged the U.S. through most of the recovery. The state’s Economic Development Authority estimates it will generate $340 million in state tax revenue over 20 years and create about 11,000 full- and part-time jobs at the complex and 5,800 construction jobs.
“We’ve had false starts,” said James Cassella, mayor of East Rutherford, New Jersey, where the complex sits unfinished. “Hopefully this time is real.”
The 2.9 million square-foot (270,000 square-meter) American Dream, originally called Xanadu, features an indoor amusement park and water park, an 800-foot (245-meter) indoor ski slope, a 300-foot Ferris wheel, aquarium, 1,500-seat performing-arts theater, skating rink and a 1,400-seat movie theater with “wind, rain, snow, fog and scents all synchronized to the on-screen action,” the company says. It will also have 500 stores, restaurants and food shops.
MetLife Stadium
The project broke ground in 2004 across the highway from what is now MetLife Stadium. Construction was abandoned after Mills Corp. and Mack-Cali Realty Corp. and then Colony Capital LLC ran short of funding.
Every day for the last 10-plus years, hundreds of thousands of people pass by what looks to be aging, scattered hunks of metal and concrete, painted in checkerboard shades of pastel blue and orange near the New Jersey Turnpike and within sight of NJTransit commuter trains.
Now construction cranes have appeared again.
Triple Five, run by the billionaire Ghermezian family that also owns Mall of America in Minnesota and West Edmonton Mall in Canada, says it’ll succeed where the others failed. It says the development, slated to open in 2018, will offer plenty to entice an estimated 40 million annual shoppers and thrill-seekers from all over the area and the world.
Tax Dollars
“This will bring much-needed jobs and tax dollars back to our region,” said Rick Sabato, president of the Bergen County Building and Construction Trades Council.
Critics say the development will suck business away from existing enterprises. Paramus, New Jersey, 10 miles north, has three indoor malls, including the 2.1 million square foot Garden State Plaza, owned by Westfield Corp.
The nonprofit New Jersey Alliance for Fiscal Integrity asked a state court last week to stop the project, saying the New Jersey Sports and Exposition Authority, which owns the site, violated state law when it authorized the bonds.
Tax exempt
Tax-exempt bonds are normally used for roads, sewers, schools and bridges.
In order for Edmonton, Alberta-based Triple Five to be eligible, a state or local government must finance the project and the company must pay bondholders what’s called PILOT, or payment in lieu of taxes. Triple Five will pay $800 million of the bond debt in this way.
Triple Five won’t pay property taxes to its host town either. Instead, East Rutherford will receive an upfront payment of more than $20 million from the bond sale and annual payments starting at $750,000 when American Dream opens. Triple Five will also make infrastructure improvements to smooth traffic.
A Brookings Institution report this month found that, since 2000, tax-exempt financing of professional sports stadiums has siphoned $3.7 billion from federal revenue. The report didn’t mention malls.
Rather than sell bonds to the public, the Sports and Exposition Authority will sell them to the Wisconsin Public Finance Authority, which will in turn market its own debt to the public. Tony Armlin, Triple Five’s vice president of development and construction, said the Wisconsin agency charges lower issuance fees.
New Jersey officials have said New Jersey taxpayers won’t be at risk if the bonds default.
Goldman Sachs Group Inc. is managing the tax-exempt bond issue for Triple Five.
Rug Merchant
Don Ghermezian, president of Triple Five, is the grandson of Jacob Ghermezian, an Iranian rug merchant who moved to Canada in 1964. The family built a real estate empire that also includes banking and energy divisions.
Triple Five is investing $300 million in cash and borrowing another $1.5 billion through a construction loan arranged by Deutsche Bank AG.
Triple Five, which says it’s leased 70 percent of the complex, is forecasting $1.5 billion in annual retail sales, even though Bergen County is the last county in the country with a ban on Sunday shopping.
Political Contributions
Bloomberg News reported that members of the Ghermezian family and their employees contributed $40,000 to the New Jersey State Republican Committee in May and $50,000 to the Republican National Committee in June, according to campaign-finance records.
“It’s indicative of a sick economy in New Jersey that you keep having to do these special deals for connected people,” said Doherty, the state senator.
American Dream may end up providing ammunition to critics of the tax-exemption for municipal bonds, said Lisa Washburn, a managing director at Municipal Market Analytics.
New Jersey is “bending over backwards to provide tax-exempt financing along with a whole host of other sweeteners in order to get a non-essential project, benefiting a for-profit company,” Washburn said. “It just doesn’t look good.”
Bloomberg Markets
by Martin Z Braun
September 26, 2016 — 2:00 AM PDT
Investors have plowed money into municipal-bond funds for almost a year, allowing local governments to borrow at near record-low yields. That’s making it easier to ignore the cracks beneath the market’s surface.
This week may mark the 52nd straight one with inflows into state and local-government bond funds, the longest streak since 2010, according to Lipper US Fund Flows. Even with the influx, the securities are headed toward the biggest monthly loss since February 2015 on speculation the Federal Reserve may raise interest rates in December. If investors start yanking money out, that could weigh on prices because securities firms have pulled back from the market.
“There’s this anxiety that’s looming under the surface where people are saying, everything is going really well, there’s all these muni inflows but what happens if that stops suddenly?” said Katie Koster, a managing director in public finance investment banking for Piper Jaffray Cos. in Laguna Beach, California. “How will the markets react? They could seize up quite quickly.”
The municipal market has been whipsawed in the past when mom-and-pop investors dumped their bonds en masse. Prices tumbled in late 2010 amid concern the recession would trigger a wave of defaults, a fear that later proved unwarranted. The securities dropped again in 2013 during the so-called taper tantrum, when then-Fed Chair Ben Bernanke jarred investors with plans to scale back the central bank’s bond purchases.
The influx of cash for the past year has been fostered by stock-market volatility and negative interest rates overseas, which have made even rock-bottom municipal yields attractive by comparison. Foreign buyers, who don’t benefit from U.S. tax breaks tied to the debt, increased their holdings to $89.7 billion at the end of June from $74 billion three years earlier.
The streak of cash “shows strong investor demand for an income-producing asset class that has high credit quality, low volatility and continues to act as a diversifier against equity and equity-like risk,” said Sean Carney, head of municipal strategy at BlackRock Inc., which manages about $124 billion of municipal debt. “There’s no indication that flows are about to turn negative, just less robust.”
Municipals have produced a return of 4 percent in 2016, according to Bank of America Merrill Lynch data, thanks to a rally that came as the Fed held off on interest-rate increases that were anticipated this year. The central bank indicated this month that the case for tightening monetary policy has strengthened, and the securities posted a loss of 0.5 percent in September.
Despite the wall of cash that’s allowed even junk-rated borrowers to issue debt, governments continue to deal with mounting pension-fund shortfalls that are exerting a drag on their credit ratings. And the impact of a selloff could be exaggerated by the brokerage industry’s diminished role in the market since new regulations went into effect after the financial crisis: Dealers’ holdings fell to about $20 billion at the end of June, down by half from $40 billion in mid-2011, according to Fed data.
“Investors have to be careful about not lulling themselves into a false sense that this abundant liquidity in the market right now is driven by dealers,” said James Iselin, head of the municipal fixed income team in New York at Neuberger Berman, which oversees about $10 billion. “It’s really driven by investors and asset managers who have pumped a lot of money into the space.”
To prepare, he said investors should buy bonds from highly-rated governments even if they offer less yield than more speculative ones.
“Giving up a little bit more to be more flexible and nimble for an environment that could be less liquid, that’s a trade that investors should certainly think about right now,” he said.
But with the interest rates so low, investors have been doing the opposite, said Piper Jaffray’s Koster. “That could be a problem down the road.”
Bloomberg Markets
by Romy Varghese
September 28, 2016 — 2:00 AM PDT
Taylor Riggs, a contributor to Bloomberg Briefs, talks with Joe Mysak about this week’s municipal market news.
A group of U.S. senators introduced a bipartisan bill that includes municipal bonds among assets that banks need to hold to weather a financial shock.
Democratic Senators Mark Warner and Chuck Schumer and Republican Mike Rounds introduced a scaled-down version of legislation that passed the House in February that would classify investment grade municipal bonds on par with U.S. agency securities issued by Fannie Mae and Freddie Mac to meet bank liquidity rules.
The Senate measure classifies munis as “Level 2B” assets comparable to certain corporate bonds and stocks.
Level 2B assets are subject to a 50 percent “haircut,” meaning if a bank holds $1 million of a municipal bond, $500,000 counts towards its liquidity buffer. The House bill classifies munis as Level 2A assets, which have a 15 percent haircut. Level 2A and 2B assets can make up no more than 40 percent of total “high quality liquid assets,” with Level 2B assets restricted to no more than 15 percent of HQLA.
“As a former governor, I know firsthand how critical it is for states and municipalities to issue bonds that fund their basic operations, including the construction of schools, roads, and local projects,” Warner said in a news release “We must ensure a continued and reliable access to capital markets for our local governments, and this legislation represents a compromise that achieves that while appropriately balancing concerns for the long term stability of our financial system.”
Local-government officials and securities-industry lobbyists turned to Congress after regulators including the Fed adopted rules that would restrict or bar banks from including munis among high quality liquid assets. State treasurers and city finance officers said the new rules, if not changed, will saddle them with higher borrowing costs eliminating incentives banks have to purchase the bonds.
“Having bipartisan, bicameral legislation is an excellent first step,” said Emily Brock, federal liaison for the Government Finance Officers Association. “It shows a commitment on their part for what we municipal securities to be, which is high quality and liquid.”
Bloomberg Markets
bu Martin Z Braun
September 27, 2016 — 10:07 AM PDT Updated on September 27, 2016 — 1:36 PM PDT
The privately run prison in Walnut Grove, Mississippi, was besieged for years by violence and legal fights over deplorable conditions. Then last month, with local sentencing reforms keeping fewer behind bars, officials shut it down, leaving the state on the hook for $121 million of debt left behind.
“The taxpayers are paying for that building and it’s just sitting there,” said Chip Jones, an alderman for the 1,600-person town about 63 miles (101 kilometers) east of Jackson, the state capital.
The closing is part of a shift taking place nationwide among states and local governments that have sold $30 billion of bonds to build prisons and jails, some of which were leased to for-profit operators. With officials re-evaluating tough-on-crime laws that caused inmate populations to soar and the federal government moving to jettison its use of private prisons, the reduced need for such facilities is rippling through a niche of the $3.8 trillion municipal-securities market.
On Friday, a Texas prison that serves as a U.S. detention center had its credit rating cut to junk by S&P Global Ratings, joining half a dozen others that were downgraded below investment grade by the company since federal officials in August announced plans to phase out for-profit facilities. About $300 million of tax-exempt debt issued for almost two dozen prisons has already defaulted, and investors are demanding higher yields on other securities amid speculation the distress will spread.
“At any point there are only so many prisoners out there to fill the private prison beds,” said Matt Fabian, managing director for Municipal Market Analytics Inc. “It creates unequal distribution and you have prisons competing against one another.”
The number of Americans behind bars has been on a steady decline. After peaking at 1.62 million in 2009, the state and federal prison population dropped over the next five years, reducing it by 54,000, or 3 percent, by 2014, the most recent year for which figures are available, according to the U.S. Bureau of Justice Statistics.
It’s not certain that such reductions will continue, said Daniel Hanson, an analyst who follows the municipal-bond market for Height Securities in Washington. Even with the decrease, some federal prisons are still over capacity and states may already have done much of what they can to keep non-violent offenders out of their penal systems, he said.
“The low hanging fruit of criminal-justice reform is already done,” said Hanson.
At the federal level, the impact is poised to trickle down. The Department of Justice on Aug. 18 said it will cancel or scale back the scope of private prison contracts after the number of federal inmates fell by about 25,000 over the past three years. About two weeks later, the U.S. Department of Homeland Security, which houses immigration detainees in privately run facilities, said it will review whether to curb their use too.
Such a step would jeopardize the repayment of local-government bonds issued for prisons, which are typically repaid with revenue from leasing them instead of with taxpayer money. Since August, S&P has lowered to junk debt issued by, among others, the Washington Economic Development Financing Authority, the Garza County Public Facility Corp. in Texas, and the La Paz County Industrial Development Authority in Arizona.
The prices of some securities have tumbled, pushing up the yields as investors demand higher compensation for the risk. The yield on bonds issued for the Reeves County detention center in Pecos, Texas, which mature in 2021 and were among those downgraded, rose to as much as 6.4 percent last month from 4.6 percent in early August.
Additional closures could spread the impact. In Florence, Arizona, a 31,000-resident town southeast of Phoenix, the seven prisons — four of which are privately-run — are a major employer, said Jess Knudson, town spokesman. One of them is an immigration facility that could be hit if Homeland Security follows Justice’s lead.
“Our ability to influence that decision doesn’t exist,” Knudson said.
The Mississippi Department of Corrections closed the Walnut Grove prison because of budget constraints and the number of inmates, with the annual average population dropping by about 10.5 percent between fiscal 2011 and 2016, bond documents show.
The decline was driven in part by the passage of criminal-justice reform that gave judges more discretion over sentencing, according to the Pew Charitable Trusts, which partnered with a state task force to push the 2014 law. The measure is projected to save the state $266 million over 10 years while also “safely reducing” the number of inmates, the group said.
With less need for prison beds, Mississippi chose to shut down a facility that had a troubled history under former operator Geo Group. After it was sued by inmates, the Justice Department faulted it in 2012 for widespread staff misconduct and deliberate indifference to the welfare of the young offenders housed there.
A federal judge said the description of life inside painted “a picture of such horror as should be unrealized anywhere in the civilized world.”
Mississippi said it has been pleased with Management and Training Corp., the for profit company that took over Geo Group after the Justice Department investigation.
The prison was closed last month and its 900 inmates were moved to other facilities. Mississippi still owes $121 million of debt for Walnut Grove, which the department of corrections has an “absolute and unconditional” obligation to pay off, according to bond documents. There state is considering using the emptied prison for another purpose.
“Anything’s better than nothing,” said Jones, the local alderman. “The taxpayers are paying for that building, and it’s just sitting there.”
Bloomberg Markets
Amanda Albright and Darrell Preston
October 3, 2016 — 2:00 AM PDT Updated on October 3, 2016 — 7:45 AM PDT
Fitch Ratings-New York-03 October 2016: Growth for the remainder of 2016 will remain healthy for all three U.S. major transportation sectors (airports, ports and toll roads) albeit at a slightly lower rate than the first half of the year, according to Fitch Ratings in a new report.
Fitch expects passenger traffic growth to increase around 3% for the second half of 2016 (2H16), with the bulk of air passenger growth coming from international hub airports. All but one major U.S. carrier has seen positive traffic growth through the first part of 2016, though a wide range of performance continued. JetBlue (12.1%) and Southwest Airlines (7.8%) led the way with strong increases in revenue passenger miles while increases among American Airlines (1.9%) and United Airlines (-0.1%) were more marginal.
Ports nationwide will continue to benefit from a stronger dollar driving imports, with 20-foot equivalent units (TEUs) growing at a level above GDP for the 1H16. A primary focus for ports remains “big ship readiness”. That said, shippers, logistics providers and ports will be keeping close watch over the expanded Panama Canal, which opened for commercial traffic this year. While large-scale shifts in cargo are not expected, some adjustments are possible.
As for toll roads, low fuel prices have boosted growth in traffic (6.3%) and revenue (7.0%) for the 1H16. The Southeast and Southwest U.S. have and will continue to lead in traffic performance. The higher rate of growth in revenues is reflective of typical inflationary toll rate increases, which Fitch expects to average roughly 2% over time.
A degree of uncertainty always remains for the long-term direction of the broader economy.
The Transportation Trends report includes an expanded data set in its appendices, including six-month year-to-date 2016 volume and revenues, six-month percentage change year-over-year for volume and revenue, 2015 full year volume and revenues, 2010-2015 five-year compounded annual growth rates, and recessionary peak-to-trough data. ‘U.S. Transportation Trends’ is available at ‘www.fitchratings.com’ or by clicking on the above link.
Contact:
Seth Lehman (Airports)
Senior Director
+1-212-908-0755
Fitch Ratings, Inc.
33 Whitehall Street
New York, NY 10004
Emma Griffith (Ports)
Director
+1-212-908-9124
Tanya Langman (Toll Roads)
Director
+1-212-908-0716
Media Relations: Sandro Scenga, New York, Tel: +1 212-908-0278, Email: [email protected].
Additional information is available at www.fitchratings.com.
Fitch Ratings-New York-22 September 2016: Despite balance sheet contractions, State Housing Finance Agencies (SHFA) have increased overall equity, according to a Fitch Ratings report.
In FY 2015, aggregate adjusted equity rose 2.6% from FY 2014 levels and increased 15.9% from FY 2010 levels.
Marking the fifth straight year of across-the-board declines, aggregate SHFA assets decreased by 0.8%; aggregate debt fell by 2.9%; and aggregate loans declined by 1.8%. Albeit at a reduced rate of decline compared with recent fiscal years, these decreases are reflective of the economic and mortgage-lending environments during that period and the shift in SHFAs’ business model in response.
“FY 2015 contained the same challenges for SHFAs as the past several years. Low interest rates continued to suppress investment income and low conventional mortgage rates decreased the volume of SHFA-issued debt for originating new whole loan mortgages,” said Ryan Pami, Associate Director.
“SHFAs sought other ways to remain profitable, such as originating loans through the to-be-announced market, utilizing direct sales of MBS and issuing MBS pass-through instruments. Despite the challenging environment, FY 2015 results demonstrated that SHFAs are financially sound, as median ratios, such as Net Interest Spread, Net Operating Revenue and Debt-to-Equity (DTE), continued to trend positively.”
Leverage ratios continued to improve as the median adjusted DTE ratio declined to 3.1x in FY 2015 from 3.4x in FY 2014. This is significantly lower than the five-year average median and the FY 2010 median, which were 3.9x and 5.5x, respectively, and now stands as the lowest median DTE ratio in the past decade.
For more information, a special report titled “State Housing Finance Agencies – Peer Study” is available on the Fitch Ratings web site at www.fitchratings.com.
Contact:
Ryan J. Pami
Associate Director
Fitch Ratings, Inc.
+1-212-908-0803
33 Whitehall Street
New York, NY 10004
Ronald McGovern
Senior Director
+1-212-908-0513
Media Relations: Elizabeth Fogerty, New York, Tel: +1 (212) 908 0526, Email: [email protected].
Additional information is available at ‘www.fitchratings.com’.
ALL FITCH CREDIT RATINGS ARE SUBJECT TO CERTAIN LIMITATIONS AND DISCLAIMERS. PLEASE READ THESE LIMITATIONS AND DISCLAIMERS BY FOLLOWING THIS LINK: HTTP://FITCHRATINGS.COM/UNDERSTANDINGCREDITRATINGS. IN ADDITION, RATING DEFINITIONS AND THE TERMS OF USE OF SUCH RATINGS ARE AVAILABLE ON THE AGENCY’S PUBLIC WEBSITE ‘WWW.FITCHRATINGS.COM’. PUBLISHED RATINGS, CRITERIA AND METHODOLOGIES ARE AVAILABLE FROM THIS SITE AT ALL TIMES. FITCH’S CODE OF CONDUCT, CONFIDENTIALITY, CONFLICTS OF INTEREST, AFFILIATE FIREWALL, COMPLIANCE AND OTHER RELEVANT POLICIES AND PROCEDURES ARE ALSO AVAILABLE FROM THE ‘CODE OF CONDUCT’ SECTION OF THIS SITE. FITCH MAY HAVE PROVIDED ANOTHER PERMISSIBLE SERVICE TO THE RATED ENTITY OR ITS RELATED THIRD PARTIES. DETAILS OF THIS SERVICE FOR RATINGS FOR WHICH THE LEAD ANALYST IS BASED IN AN EU-REGISTERED ENTITY CAN BE FOUND ON THE ENTITY SUMMARY PAGE FOR THIS ISSUER ON THE FITCH WEBSITE.
WASHINGTON — A bipartisan group of senators is pushing to include municipal bonds in bank-safety rules, the latest wrinkle in a continuing fight over how safe—and salable—the debt of states and localities would be in another financial crisis.
Sens. Mark Warner (D., Va.), Charles Schumer (D., N.Y.) and Mike Rounds (R., S.D.) are set to introduce legislation on municipal bonds this week, according to Senate aides. The bill aims to open the door for big U.S. banks to count municipal bonds as liquid assets under rules completed in 2014 that were designed to ensure Wall Street firms have enough cash during a crisis to fund their operations for 30 days.
The Senate legislation would place municipal bonds on the lowest rung of the “high quality liquid assets” category. That means they would be treated on par with corporate bonds, but not as favorably as under related legislation approved by the House early this year.
“We must ensure a continued and reliable access to capital markets for our local governments,” Mr. Warner said in a written statement. “This legislation represents a compromise that achieves that while appropriately balancing concerns for the long term stability of our financial system.”
The rules, slated to go into effect next year, are aimed at making banks hold more cash or securities that are easy to sell. The Federal Reserve and two other bank regulators had originally decided debt issued by states and localities didn’t make the cut—prompting a backlash from banks, lawmakers and states and localities who warned the move would make the bonds less attractive and raise borrowing costs for municipalities.
The Fed completed amendments in April to allow some investment-grade municipal bonds to qualify. But the two other regulators involved in the rules—the Office of the Comptroller of the Currency and the Federal Deposit Insurance Corp.—haven’t followed suit.
Aides to Senate lawmakers say their bill was scaled back from the House version to gain broad support for it in the Senate, though it is unclear if there is sufficient time in the remaining year to advance the bill.
Sen. Richard Shelby (R., Ala.), chairman of the Senate Banking Committee, indicated earlier this year that he was reluctant to second-guess banking regulators that originally excluded municipal bonds when they wrote the rules in 2014. But an aide to Mr. Shelby said he wouldn’t object to the coming bill as it incorporates changes the Fed already adopted in its version of the rules.
Banks underwrite muni bonds, buy them as investments and sell them to clients. Lenders have played an increasingly central role in the thinly traded, $3.7 trillion market and are now the biggest buyers of municipal debt, according to Municipal Market Analytics Inc., a research firm.
Municipal officials have generally applauded the Fed’s willingness to make changes to the rules but say legislation is necessary, largely because banking firms typically hold municipal debt in units that are overseen by the other policy makers involved in the rules, particularly the OCC, which regulates national banks.
Officials at the OCC remain dismissive of including the municipal bonds in the rules and don’t believe the debt is sufficiently liquid, according to people familiar with their thinking. The FDIC is waiting until the rules go into effect next year before considering amending its version, according to people familiar with that agency.
While the Senate bill would rank municipal debt similarly to the Fed’s amended rules—allowing the banks to count 50% of the bonds’ face value when including them in their funding buffers—the legislation would allow banks to include more types of municipal bonds, a Senate aide said.
These include revenue bonds, or securities backed by a specific revenue stream, that comprise the bulk of debt issued by states and local governments but that are kept out of the current Fed version of the rules.
The House bill, meanwhile, is broader than both the Senate bill and the Fed’s version of the rules, allowing banks to count 85% of the bonds’ face value.
To date, banks have by and large continued to hold lots of municipal bonds despite the rules, in part because they are seen as less risky than corporate debt and are priced competitively to other types of debt, according to bank officials. If interest rates rise this year, banks are expected to begin to pare their muni holdings.
Corrections & Amplifications:
An aide to Sen. Richard Shelby (R., Ala.), chairman of the Senate Banking Committee, said he wouldn’t object to the coming municipal bond legislation. An earlier version of this story said an aide to Mr. Shelby said he would support the bill. Also, these comments were made by an aide to Sen. Shelby. Due to an editing mistake, an earlier correction to this story erroneously cited Sen. Shelby for these remarks.
THE WALL STREER JOURNAL
By ANDREW ACKERMAN
Updated Sept. 27, 2016 10:27 a.m. ET
Write to Andrew Ackerman at [email protected]
J.P. Morgan, Nuveen invest in school board’s bonds at big profit
The Chicago school system needed money—fast. Two Wall Street players saw an opportunity to invest.
J.P. Morgan Chase & Co. and Chicago-based Nuveen Asset Management have made realized and paper profits exceeding $110 million on purchases this year of $763 million in Chicago Public Schools bonds. The school system has said it needed the money to replenish its dwindling coffers before the new school year and to build and repair facilities.
The terms of the bond sales highlight the choices the school district faces after years of pension shortfalls and relying heavily on borrowing. The 397,000-student school district struggled to sell municipal bonds in February until Nuveen bought about one-third, and the district decided in July to borrow directly from J.P. Morgan for fear that investors might balk again, a spokeswoman for the Chicago Board of Education said.
“CPS did not have the luxury of waiting longer to demonstrate to the market that the progress we were making was real,” said Ronald DeNard, the school district’s senior vice president of finance, in an emailed statement about the bonds purchased in July by J.P. Morgan.
J.P. Morgan, the country’s largest bank by assets, made a 9.5% profit on $150 million in bonds it bought in July and sold in September, or 82% annualized. Nuveen, an investment firm managing $160 billion, has bought $613 million in bonds since February for a total return, including price gains and interest payments, of about 25%. That is almost 50% on an annualized basis, an especially large gain at a time of near-zero interest rates.
The school system’s bonds are a favorite for John Miller, Nuveen’s co-head of fixed income, who said the firm bought when the market feared a default, a concern he called overblown. “At the end of day, this school system is critically important to Chicago—to the whole country really,” he said.
Its bonds are rated B3 by Moody’s Investors Service and traded as low as 73 cents on the dollar in March before rebounding to about 90 cents in September. CPS said the bond sales facilitated much-needed fixes like lead abatement and classroom construction, though they increased the school system’s already heavy debt load and its annual interest payments.
“We took a period of market risk on behalf of our client when they needed it most and the market has recognized their improved financial position,” a J.P. Morgan spokeswoman said.
Chicago’s school district operates on a budget of $5.5 billion with a below-investment-grade, or junk, credit rating on nearly $7 billion of bonds. Its teachers union is threatening to strike, in part, over proposed changes to its pension plan, which has a nearly $10 billion funding gap. The school system’s rainy-day fund is nearly empty and relies on short-term borrowing.
“J.P. Morgan and Nuveen are taking advantage of a distressed school district at the expense of our most vulnerable students,” said Jackson Potter, staff coordinator at Chicago Teachers Union.
Nuveen held few Chicago Public School bonds in recent years but has been watching its prices closely since May 2015, when Moody’s cut its credit ratings of the school board and the city of Chicago to junk.
The investment company, which now owns about $806 million of the school district’s bonds, dedicated an analyst to cover the district full time to better understand its capacity to increase revenue and the likelihood of a bankruptcy filing.
Prices of outstanding Chicago school bonds were hit in 2013 and 2015 after defaults by Detroit and Puerto Rico. Illinois Gov. Bruce Rauner called for a state takeover of the school system and for a potential bankruptcy filing over the past year and prices fell below 75 cents on the dollar.
Nuveen determined that the default risk was far lower than that implied by the bond prices. When J.P. Morgan was struggling to find buyers of $725 million in bonds in February, the fund manager agreed to buy about 36% of the issue at about 84 cents on the dollar.
Mr. Miller continued buying after and now owns 60% of the bonds, making it the single largest investment in the $15 billion Nuveen High Yield Municipal Bond Fund. Nuveen has made unrealized gains of about $103.3 million on all the CPS bonds it owns, a company spokeswoman said.
Demand for Chicago Board of Education debt grew over the summer as investors gained confidence that the school board could plug much of its 2017 budget gap with budget cuts, state aid and new tax revenues. Market conditions also improved significantly, sending prices of municipal bonds with junk credit ratings up and pushing their yields down to about 4.6% in early July, a 17-year low, according to the S&P Municipal Bond High Yield Index.
Still, when the school district turned to J.P. Morgan for more money in July, it decided to sell the bonds directly to the bank to avoid the risk that investors would reject it. Instead, demand for the bonds rose throughout the summer, and J.P. Morgan sold all of the debt for a $12 million profit in September, Wall Street Journal analysis of data from the Municipal Securities Rulemaking Board shows.
“You’ve gone from having maybe two to three people being interested in these deals to all of a sudden having 20 investors interested,” said Mr. Miller of Nuveen.
J.P. Morgan committed to hold the $150 million in bonds it purchased for about six weeks until the board of education prepared documentation allowing them to be sold to institutional investors.
The certainty J.P. Morgan provided came with a high price: The bank paid 91 cents on the dollar for the debt at a yield of 7.25%, much higher than the approximately 6% yield on the school board’s outstanding bonds at the time. It sold the debt at prices as high as 102 cents on the dollar in early September and its trading profits, plus a $1.2 million purchaser’s fee, amount to the 9.5% return in six weeks.
J.P. Morgan has a longstanding relationship with Chicago Public Schools and is the top underwriter of its bonds over the past 10 years, according to data from Thomson Reuters. The bank views the school board as a high-priority client that it understands well and is willing to support its short- and long-term capital needs, the bank spokeswoman said.
THE WALL STREET JOURNAL
By MATT WIRZ and HEATHER GILLERS
Updated Oct. 2, 2016 11:31 p.m. ET
—Aaron Kuriloff
contributed to this article.
Write to Matt Wirz at [email protected] and Heather Gillers at [email protected]
CHICAGO — Bonds sold by U.S. states, cities, schools and other issuers in the municipal market could be held as liquid assets by banks under legislation introduced on Tuesday in the U.S. Senate, bolstering the case for purchasing the debt while helping financial institutions weather market crises.
The bipartisan measure would classify high-quality municipal bonds at the same level as corporate debt, allowing banks to use munis to comply with new 30-day federal liquidity requirements.
Federal rules approved in 2014 and effective next year are aimed at ensuring big banks will be able to access sufficient cash during a financial crisis. But the rules excluded muni bonds from the types of securities that count as high quality liquid assets, or HQLAs.
Muni debt issuers fear the exclusion would deter banks from buying muni debt, hurting their ability to fund everything from schools and bridges to water treatment plants and hospitals.
“If banks retreat from the muni-bond market, it could choke off a critical source of investment on which our cities and localities rely. This bill protects the stability of our markets while providing continued access to muni bonds for local governments,” Senator Chuck Schumer, a New York Democrat, said in a statement.
Schumer, along with Senators Mark Warner, a Virginia Democrat, and Mike Rounds, a South Dakota Republican, led a group sponsoring the legislation.
Putting munis on par with corporate debt “would be acceptable,” according to Washington State Treasurer James McIntire, president of the National Association of State Treasurers (NAST), which has been pushing for the inclusion of munis under the rules.
A House bill would also allow banks to count munis toward banks’ liquidity but at a higher face value, 85 percent, versus 50 percent in the Senate bill, according to NAST.
By REUTERS
SEPT. 27, 2016, 6:39 P.M. E.D.T.
(Reporting by Karen Pierog; editing by Daniel Bases, Bernard Orr)
The NFMA Disclosure Committee released the draft Recommended Best Practices in Disclosure: Charter School Disclosure (Primary Offering & Continuing Disclosure).
Comments will be taken through November 30, 2016.
To view the paper, click here.
To read the press release, click here.
GFOA’s Resiliency Task force has produced numerous articles, case studies, and other resources on Financial Resilience.
Wells Fargo & Co. may be forced to leave the municipal-debt underwriting business for a short period of time because of the backlash from the bank’s mishandling of client accounts, according to Court Street Group, a New York-based research and consulting firm.
by Romy Varghese
September 30, 2016 — 11:40 AM PDT Updated on September 30, 2016 — 2:24 PM PDT
Chicago Treasurer Kurt Summers plans to divest $25 million the city has invested with Wells Fargo & Co. after the company admitted to opening potentially millions of bogus client accounts, joining state officials who have pulled business from the bank because of the scandal.
Summers, whose office manages the city’s $7 billion investment portfolio, plans to “unwind these assets as expeditious as possible in a fashion that is prudent and will protect taxpayer money,’’ according to a statement from his office sent to Bloomberg News.
“The City Treasurer is proud to stand with working families from Chicago and across the nation by divesting in Wells Fargo & Co.,’’ according to the e-mailed statement. “Chicago deserves better.’’
The move comes amid mounting pressure on Wells Fargo, which is facing a national furor over the fake accounts debacle. After California’s treasurer barred the bank from bond and investment deals last week, Illinois Treasurer Michael Frerichs said he plans to take similar steps. On Monday, he said he’s suspending $30 billion in investment activity from Wells Fargo, which won’t be a broker dealer for the state for at least a year.
Illinois won’t be using Wells Fargo on any new bond sales until further notice, according to Governor Bruce Rauner’s administration, which hasn’t done any bond business with the bank.
Council Measure
“We are very sorry and take full responsibility for the incidents in our retail bank,” said Gabriel Boehmer, a spokesman for Wells Fargo. “We have already taken important steps, and will continue to do so, to address these issues and rebuild the city’s trust.”
Chicago may take further steps to sever relations with the bank. Alderman Edward Burke, chair of the city council’s finance committee, introduced a measure on Sept. 30 that would bar Chicago from doing business with Wells Fargo for the next two years. The plan, which will be considered at a finance committee meeting on Oct. 5, would prevent Chief Financial Officer Carole Brown, the comptroller and treasurer from using Wells Fargo as a municipal depository, bond underwriter, trustee in loan agreement, investment broker or financial adviser, according to a statement. The plan would also “encourage” pension funds to divest their Wells Fargo investments.
Chicago has paid Wells Fargo more than $19 million since 2005, according to Burke’s office.
Bloomberg Markets
by Elizabeth Campbell
October 3, 2016 — 7:06 AM PDT Updated on October 3, 2016 — 9:20 AM PDT
California, the nation’s largest issuer of municipal bonds, is barring Wells Fargo & Co. from underwriting state debt and handling its banking transactions after the company admitted to opening potentially millions of bogus customer accounts.
The suspension, in effect immediately, will remain in place for 12 months. A “permanent severance” will occur if the bank doesn’t change its practices, State Treasurer John Chiang said Wednesday. The state also won’t add to its investments in Wells Fargo securities. Chiang already replaced Wells Fargo with Loop Capital for two muni deals totaling about $527 million that will be sold next week.
“Wells Fargo’s venal abuse of its customers by secretly opening unauthorized, illegal accounts illegally extracted millions of dollars between 2011 and 2015,” Chiang said in a news conference in San Francisco. “This behavior cannot be tolerated and must be denounced publicly in the strongest terms.”
The move by California is the latest to punish the bank, which is facing a national furor over the fraudulent accounts. San Francisco, the home of Wells Fargo, last week removed it from a banking program for low-income residents. Authorities including the U.S. Consumer Financial Protection Bureau fined Wells Fargo $185 million on Sept. 8 for potentially opening about 2 million deposit and credit-card accounts without authorization. Chief Executive Officer John Stumpf has forfeited $41 million in pay.
Connecticut decided last week to add Morgan Stanley to serve as lead underwriter with Wells Fargo on a state bond issue planned for next month to help ensure a successful sale, according to the state treasurer’s office. Connecticut is reviewing its relationship with the bank. New York’s Metropolitan Transportation Authority voted to hold off on approving Wells Fargo as a underwriter until the agency completes its analysis of the company’s practices, according to an online broadcast of a board meeting Wednesday.
Federal prosecutors in New York and San Francisco have opened criminal inquiries, a person familiar with the matter has said. Wells Fargo already faces a raft of lawsuits by fired or demoted workers, customers and investors.
Chiang, a Democrat who’s running for governor in 2018, oversees about $2 trillion in banking transactions a year and manages a $75 billion investment pool that includes $800 million in Wells Fargo securities. Chiang said the effect on the bank is “significant” since he targeted the most profitable lines of business. Wells Fargo made $1.7 million from underwriting three bond deals, according to his office.
Gabriel Boehmer, a spokesman for Wells Fargo, said the bank has “diligently” worked with the state for the past 17 years.
Underwriter Rankings
“We certainly understand the concerns that have been raised. We are very sorry and take full responsibility for the incidents in our retail bank,” Boehmer said in an e-mailed statement. “We have already taken important steps, and will continue to do so, to address these issues and rebuild your trust.”
Wells Fargo was the second-largest underwriter of municipal debt in California in the first half of the year, according to data compiled by Bloomberg. The firm, which trailed Citigroup Inc., handled sales of $3.9 billion in securities, or 11 percent of total issuance.
The bank ranked fifth in overall municipal-bond underwriting this year through June, selling $13.7 billion in debt, for 5.9 percent market share.
Chiang, who called for the resignation of Stumpf, said other state treasurers should also withhold business from the company. “Those that have the financial wherewithal, those who have the courage, I think they ought to follow suit,” he said.
Bloomberg Markets
by Romy Varghese
September 28, 2016 — 11:40 AM PDT Updated on September 28, 2016 — 5:11 PM PDT
Illinois is joining California in suspending Wells Fargo & Co. from handling “billions” of dollars in investment work and the underwriting of state debt after the company admitted to opening potentially millions of bogus customer accounts.
Treasurer Michael Frerichs said in a statement the he will announce details of the ban during a news conference in Chicago on Monday. The suspension includes municipal-bond underwriting, according to Greg Rivara, a spokesman for the treasurer.
“In isolation, Illinois is not as significant as California, but its part of a mosaic that’s starting to take form,” Charles Peabody, a managing director at Compass Point Research LLC, said in a telephone interview, noting that it’s surprised industry watchers that the cross-selling scandal has begun to impact Wells Fargo’s corporate bank. “And the mosaic that’s being built out does not paint a bright picture for 2017 earnings.”
The pullback comes as pressure builds on Wells Fargo Chief Executive Officer John Stumpf and the bank’s board to resign because of the fake-account debacle. Stumpf told Congressional lawmakers this week that the San Francisco-based bank was working to help any customers who where hurt by its actions and is “deeply sorry” that Wells Fargo broke clients’ trust. Stumpf has forfeited $41 million in pay.
“We certainly understand the concerns that have been raised,” said Gabriel Boehmer, a spokesman for Wells Fargo. “We are very sorry and take full responsibility for the incidents in our retail bank. We have already taken important steps, and will continue to do so, to address these issues and rebuild trust with the State of Illinois.”
Authorities including the U.S. Consumer Financial Protection Bureau fined Wells Fargo $185 million on Sept. 8 for potentially opening about 2 million deposit and credit-card accounts without authorization. Federal prosecutors in New York and San Francisco have opened criminal inquiries, a person familiar with the matter has said. Wells Fargo already faces a raft of lawsuits by fired or demoted workers, customers and investors.
California Treasurer John Chiang suspended Wells Fargo for one year on Wednesday and called for Stumpf to quit. Connecticut decided last week to add Morgan Stanley to serve as lead underwriter with Wells Fargo on a state bond issue planned for next month to help ensure a successful sale. Other states such as Alaska and Oregon said they’re maintaining business with Wells Fargo.
Wells Fargo wasn’t ranked among the top four underwriters of municipal debt in Illinois during the first half of 2016, according to data compiled by Bloomberg. The company was the second-largest underwriter in California during that period, handling sales of $3.9 billion in securities, or 11 percent of total issuance.
The bank ranked fifth in overall municipal-bond underwriting this year through June, selling $13.7 billion in debt, for 5.9 percent market share, according to data compiled by Bloomberg.
Bloomberg Business
by Katherine Greifeld and Elizabeth Campbell
September 30, 2016 — 2:49 PM PDT Updated on September 30, 2016 — 5:11 PM PDT
SAN FRANCISCO — The California State Treasurer’s Office said it replaced Wells Fargo & Co as the lead underwriter on two bond sales that had originally been for scheduled for Tuesday, a day before the state announced sweeping sanctions against the company.
Management of the two sales, totaling nearly $730 million, was replaced by Jefferies LLC in one sale and by Loop Capital Markets LLC and Raymond James & Associates, Inc in the other.
On Wednesday, State Treasurer John Chiang announced the suspension of Wells Fargo as a managing underwriter on state negotiated bond sales for the next 12 months. California is the nation’s largest issuer of municipal debt.
Wells Fargo agreed on Sept. 8 to pay $190 million to settle a case by California prosecutors and federal regulators over what were potentially more than 2 million unauthorized credit card and deposit accounts opened by branch employees scrambling to meet sales quotas. The bank said it fired 5,300 employees over the issue.
Tuesday’s postponed bond sale had consisted of $200 million of general obligation index floating rate bonds. The state replaced Wells Fargo with Jefferies LLC as the senior manager, and the sale is now scheduled for Thursday.
The second sale was nearly $528 million of lease revenue refunding bonds from the State Public Works Board, issued to refund certain outstanding debts. Loop Capital and Raymond James will now manage the sale, which is scheduled to take place on Oct. 5.
Chiang, who oversees nearly $2 trillion of California’s annual banking transactions and manages a $75 billion investment pool, called for the state on Wednesday to suspend Wells Fargo’s “most highly profitable business relationships with the state of California.”
Over the past 21 months, Wells Fargo had served as senior manager in three California deals, resulting in $1.7 million of profits, according to the Treasurer’s Office.
By REUTERS
SEPT. 28, 2016, 7:21 P.M. E.D.T.
(Reporting by Robin Respaut; Additional reporting by Dan Freed in New York; Editing by Peter Cooney)
CHICAGO — Wells Fargo & Co faces possible bans from doing business with the city of Chicago and the state of Illinois in the wake of its sales scandal that erupted earlier this month.
Alderman Edward Burke, who heads the Chicago City Council’s finance committee, introduced an ordinance on Friday that would suspend the bank from acting in several capacities, including as a municipal depository, bond underwriter and financial adviser.
“The city council should not engage in any business for the next two years with this institution that has deceived, defrauded and duped its customers,” Burke said in a statement.
Illinois Treasurer Michael Frerichs set a Monday news conference to announce “plans to suspend billions of dollars in investment activity with Wells Fargo,” according to an advisory from his office on Friday.
Wells Fargo staff opened checking, savings and credit card accounts without customer say-so for years to satisfy managers’ demand for new business, according to a $190 million settlement with regulators reached on Sept. 8. The bank said it fired 5,300 employees over the issue.
On Wednesday, California State Treasurer John Chiang announced a sweeping suspension of the state’s business relationships with Wells Fargo for the next 12 months. The bank is also under pressure from Oregon’s treasurer to reform its management structure and executive compensation.
U.S. lawmakers called on Thursday for Wells Fargo chief John Stumpf to resign and a top House Democrat demanded the bank be broken up because it is too big to manage.
Chicago’s finance committee is scheduled to take up the proposed ordinance on Wednesday. The city has paid Wells Fargo $19.45 million in fees since 2005, according to the committee.
The bank served as senior underwriter on five Chicago bond issues totaling nearly $969 million since 2006, according to Thomson Reuters data.
Wells Fargo made the list of 15 senior underwriters tapped by Illinois this month for bond sales over the next three years. A spokeswoman for Governor Bruce Rauner declined to comment on whether his office is rethinking Wells Fargo’s selection.
By REUTERS
SEPT. 30, 2016, 5:42 P.M. E.D.T.
(Reporting by Karen Pierog; Editing by Matthew Lewis)
Citing Wells Fargo’s “venal abuse of its customers,” the California treasurer took the unusual step on Wednesday of suspending many of its ties with the San Francisco bank as it continues to reel from the scandal over the creation of as many as two million unauthorized bank and credit card accounts.
The state treasurer, John Chiang, said he was suspending Wells Fargo’s “most highly profitable business relationships” with the state for at least a year, including the lucrative business of underwriting certain California municipal bonds.
On Tuesday alone, he said, he had pulled Wells Fargo off two large municipal bond deals.
“How can I continue to entrust the public’s money to an organization which has shown such little regard for the legions of Californians who placed their financial well-being in its care?” Mr. Chiang wrote in a letter on Wednesday to the bank’s chairman and chief executive, John G. Stumpf, and the bank’s board members.
Mr. Chiang said he was also suspending making any additional investments in Wells Fargo securities and would suspend the bank’s work as a broker-dealer hired to buy investments on the treasurer’s behalf.
The suspensions will last for one year, Mr. Chiang said, or longer if he finds evidence that Wells Fargo has “re-engaged in the same behavior” or failed to abide by the terms of a consent order it signed with the Consumer Financial Protection Bureau and the Office of the Comptroller of the Currency.
The move could cost Wells millions of dollars in banking fees because California is the largest issuer of municipal debt in the country. A state official said the suspension did not affect Wells Fargo’s role in every municipal bond deal, but it would cut them out of a significant portion. In addition to overseeing bond deals, the state treasurer also manages $75 billion worth of investments.
But more than anything the move is symbolically hurtful for Wells, which has a large presence in California, particularly in San Francisco, where its top executives work and live.
Mr. Chiang, a Democrat who is running for governor in 2018, said his office had “long relied on Wells Fargo, our oldest California-based financial institution, as a partner to meet the state’s investment and borrowing needs.”
So far this year, California has sold about $50 billion in municipal debt out of total of about $318 billion issued nationwide, according to Municipal Market Analytics, a research firm.
Mr. Chiang noted that he sits on the board of the state’s giant public pension funds, Calpers and Calstrs, which have a combined $2.3 billion invested in Wells Fargo stock and debt securities. He said he would use his position on the pension boards to push for governance changes at Wells Fargo, including separation of the chairman and chief executive roles. Currently, Mr. Stumpf holds both positions.
In a statement, the bank responded: “Wells Fargo has diligently and professionally worked with the state for the past 17 years to support the government and people of California. Our highly experienced and proven government banking, securities and treasury management teams stand ready to continue delivering outstanding service to the state.”
Separately, on Thursday, Mr. Stumpf is scheduled to testify in Washington before the House Financial Services Committee, having already appeared last week before the Senate’s banking panel. The responses he gave to the Senate committee investigating the bank’s misdeeds were widely viewed as a disaster. Nevertheless, according to a copy of his prepared remarks, he plans to stick with the same script he used last week.
His planned testimony, which was obtained by The New York Times, is a nearly word-for-word repetition of the introduction he prepared for last week’s Senate hearing, with just one notable difference: Hastening a policy change, Mr. Stumpf plans to say that Wells Fargo will eliminate sales goals for its retail bankers by Oct. 1, three months earlier than it had planned.
Those aggressive sales goals, which pushed Wells Fargo employees to open as many accounts as possible for customers or risk losing their jobs, have been blamed for the scandal now engulfing the bank, where myriad banking and credit card accounts may have been opened without the customers’ authorization.
“We decided that product sales goals do not belong in our retail banking business,” Mr. Stumpf will say, according to the testimony.
As he did at the Senate hearing, Mr. Stumpf plans to say he is “deeply sorry” and will “accept full responsibility for all unethical sales practices.”
Under fire over the unauthorized accounts, Wells Fargo’s board announced on Tuesday that it was stripping Mr. Stumpf of unvested stock awards valued at $41 million. He will also forgo his bonus this year and a portion of his $2.8 million base salary.
The clawback of both Mr. Stumpf’s compensation and that of Carrie L. Tolstedt, who until recently ran Wells Fargo’s retail banking division, was a move that members of the Senate panel suggested last week. The fact that the board decided to do so right before the House hearing does not seem coincidental.
And the move to retract a portion of Mr. Stumpf’s lavish compensation — at the time of Wells Fargo’s latest annual disclosure, he held shares and options valued at around $247 million — has not appeased some senators who criticized Mr. Stumpf last week.
“This is a small step in the right direction, but nowhere near real accountability,” Senator Elizabeth Warren, Democrat of Massachusetts, said in a statement.
She again called for Mr. Stumpf to resign, to “return every nickel he made while this scam was ongoing” and to face a criminal investigation.
On Wednesday, in what felt a bit like a warm-up for Mr. Stumpf’s appearance on Thursday, the House Financial Services Committee grilled the Federal Reserve chairwoman, Janet L. Yellen, about the handling of the Wells Fargo scandal. Some lawmakers called for tougher punishment of big banks and their executives when they run afoul of the law.
“Will you at least seriously consider breaking up Wells Fargo?” asked Representative Brad Sherman, Democrat of California.
Ms. Yellen responded that regulators would hold financial institutions to “exceptionally high standards of risk management, internal controls, consumer protection.”
Others on the committee continued to press the issue.
“How long does this stuff have to go on before you get outraged and take action?” asked Representative Michael Capuano, Democrat of Massachusetts. He said that the $185 million fine against Wells Fargo, which has $1.9 trillion in assets, “is barely a footnote in their annual report.”
Ms. Yellen said that regulators had already begun a review of practices at all of the largest banks.
“We are undertaking a look comprehensively, not only in the consumer area but compliance generally, because there has been a very disturbing pattern of violations,” she said.
And regulators are working to complete a long-pending rule on executive compensation designed to limit excessive risk-taking at financial firms, Ms. Yellen said. “I will do everything that I can at the Federal Reserve to be ready to act on this as soon as possible,” she added.
Wells Fargo has been in crisis mode since it acknowledged this month that its employees had, over the course of several years, opened as many as 1.5 million bank accounts and 565,000 credit card accounts that may not have been approved by customers. The company has fired 5,300 employees for ethics violations.
Mr. Stumpf’s efforts to minimize these actions did not play well at last week’s Senate hearing. Facing a barrage of criticism about Wells Fargo’s leadership and what ex-employees describe as a toxic sales culture of relentless pressure to meet unrealistic goals, Mr. Stumpf maintained that the problem did not extend beyond rogue employees whose activities “did not honor our culture.”
Banking analysts were not enthusiastic about the idea of him continuing that line of argument at Thursday’s House hearing.
“Given the nearly universal assessment that Mr. Stumpf’s Senate appearance was lackluster, sticking with the script may prove imprudent,” Isaac Boltansky, an analyst at Compass Point Research & Trading, wrote in a note to clients after reading the prepared remarks.
One big question facing Mr. Stumpf is whether he will remain at the helm of the bank. Some analysts who follow the bank are beginning to openly speculate about Mr. Stumpf’s possible ouster.
“Our support for the C.E.O. is now wavering,” Mike Mayo, a banking analyst at CLSA, wrote in a research note on Monday. “His actions have been reactionary versus leading.”
THE NEW YORK TIMES
By MICHAEL CORKERY and STACY COWLEY
SEPT. 28, 2016
The Exposure Draft, Certain Debt Extinguishments, is out for public comment through October 28, 2016.
Let us hear from you!
This article explores the Omnibus Exposure Draft, the Leases project, and the forthcoming Statement on fiduciary activities.
The GASB is working toward the issuance of an initial document for public comment in its project reexamining the financial reporting model. The Invitation to Comment will seek feedback from stakeholders on elements of the existing model that the GASB’s research identified as areas of potential improvement. This article previews what the Board is preparing for issuance at the end of 2016.
Unlike other due process documents, which contain proposals from the Board for new or amended standards, an Invitation to Comment is a neutral document that seeks stakeholder input on a variety of alternatives before the Board develops a position on them.
It is important to note that the feedback received during the initial pre-agenda research indicated that much of the financial reporting model has been effective in providing information that is useful for making decisions and assessing accountability. Therefore, the Board decided that the approach of the financial reporting model reexamination will be to make improvements to the existing model, rather than start over with a clean slate.
TARGETED AREAS OF POTENTIAL IMPROVEMENT
The Invitation to Comment is expected to present a number of targeted areas of potential improvement to governmental fund financial statements, including:
The Board plans to consider other areas identified for potential improvement during the research in future due process documents.
MAPPING OUT THE INVITATION TO COMMENT
Chapter One
The first chapter will make the case for why the Board is exploring recognition approaches for governmental funds—to improve the effectiveness of governmental fund information, develop conceptual consistency, and provide a basis for establishing guidance for complex transactions.
Chapter Two
This chapter will introduce three alternatives that fall on a continuum for recognition approaches for governmental fund financial statements:
For each of these three recognition approaches, the document will describe:
Stakeholder input will give the Board additional insight as to which recognition approach yields the most understandable and useful information about the governmental funds.
Chapter Three
This portion of the document will consider a statement of cash flows for governmental funds for the short-term (working capital) financial resources and long-term (total) financial resources recognition approaches.
A cash flows statement presents a government’s receipts and disbursements into different categories—operating activities, noncapital activities, capital and related financing activities, and investing activities—based on the nature of the transaction. Currently, cash flows statements are required in the proprietary funds (funds reporting activities for which a government generally charges a fee for goods or services).
This document will seek input on whether there would be a need for a cash flows statement if the governmental funds were to use either of the recognition approaches other than near-term financial resources. It also would consider which cash flows categories are most relevant.
The chapter also will consider two presentation format alternatives for the resource flows statement for governmental funds:
Input on these very different formats will assist the Board in evaluating which provides financial statement users with the most understandable and useful information.
We welcome your input once the Invitation to Comment has been issued in December 2016.
Los Angeles – Municipal bond pros at the 26th annual Bond Buyer California Public Finance Conference expect interest rates to have the biggest impact on issuance next year.
In a live market survey Wednesday 50% of the audience said rates will have the biggest effect on the market, 25.8% picked new money, and 22% chose refunding activity.
A panel of municipal bond market influencers at the conference in Los Angeles, which attracted a record number of attendees, commented on results as the audience responses were tabulated. Led by moderator Jessica Matsumori, analytical leader, education team for S&P Global Ratings, the panel was comprised of Bill Lockyer, counsel for Brown Rudncik LLP and former Treasurer of the State of California, Andy Nakahata, managing director and head of new business development for the western region at National Public Finance Guarantee and Rep. Loretta Sanchez, D-Calif., a candidate for the U.S. Senate.
“It’s such a great way to get the pulse of the market,” Matsumori said.
The audience was nearly split about whether it matters if the Federal Reserve raises interest rates by less than 100 points, as 56.9% said yes and the remaining 43.1% said no. This question was especially timely, as it was announced Wednesday that the Fed will hold rates where they are now.
“Even if they did something in December, it would be a small move up. I think the question is, is the government going to step and build more infrastructure? These are issues that are hard to grapple with in Congress,” Sanchez said.
Defaults have been a hot topic, so it was surprising to see that 60.5% of the audience said that muni defaults have not affected the market.
“On an absolute rate level that is correct,” Nakahata said. “Credit spreads are so thin — but on the other hand, it has affected how certain people look at certain types of credits.”
Pensions are another popular topic and one that won’t be going anyway anytime soon. When asked what will happen if investment assumptions prove to be too optimistic for CalPERS pension returns, 43.5% said that employer/employee contributions will be increased, 20.1% said benefits will be cut for future employees, 1.3% said benefits will be cut for current employees and 35.1% said all of the above.
“Given the magnitude of the issue, it would be great to come up with a solution that is all of the above, where everyone would share a little bit of the pain, but I don’t see a clear path to achieve a solution like that,” Nakahata said.
Green bonds were also a topic of conversation, in the midst of a record year for their issuance. A whopping 50.9% of the audience said that green bonds are purely a marketing ploy and part of a fad that won’t last. Still, 31.3% said that the designation makes some difference to investors, 13.5% said they have the potential to drive serious environmental change and 4.3% said greenness is “The wave of the future – will soon be a requirement for most bonds.”
“It is going to take some time and I do think we have to wait and see what happens, but part of that will be if there is a greater definition of what exactly truly is a green bond. In order for it to be meaningful, there has to be a common [definition] which everyone subscribes to or … my cup of coffee could be a green bond,” Nakahata said.
The Bond Buyer
By Aaron Weitzman
September 21, 2016
US local governments are facing a jump in short-term borrowing costs in the latest example of how the reform of Wall Street’s $2.7tn money market industry is rippling through the financial system.
A key interest rate used to set the coupon payments on some short-dated municipal debt has moved up from what was in effect zero in March to 70 basis points this week.
“It’s huge,” said Jon Mondillo, portfolio manager at Alpine Funds, which invests in municipal bonds. “It’s been a double barrelled shot in the face for issuers.”
State governments and other public institutions that tap the municipal bond market in the US — which is tax exempt for domestic investors — have been beneficiaries of the long period of low interest rates.
The increase in the Securities Industry and Financial Markets Association (Sifma) rate catapults it above one week Libor, a global benchmark indicative of the cost of unsecured bank borrowing.
“It is a bit startling given where we have been the last seven or eights years,” said Tim Schaefer, deputy treasurer for the state of California. “Not unexpected I might add . . . It creates concern. But by no means should it cause us to give up on the market.”
The jump in Sifma’s rate will hit the $175bn market for variable rate demand notes (VRDNs), or shorter-dated debt carrying a floating interest rate that resets weekly. New York, California and Texas are some of the largest state issuers, according to Sifma data.
The upward move in borrowing costs stems from US regulators’ reform of money market funds, which invest in short-term debt sold by companies, banks as well as public borrowers such as states. The reforms allow fees to be imposed on investors pulling money out of funds during periods of financial stress and, in some instances, stop investors withdrawing money altogether.
Although the reforms do not take effect until next month, they have already prompted investors to move money out of so-called prime and tax-exempt funds, which buy debt sold by US municipalities.
Assets in tax exempt funds assets have fallen from $266bn at the start of 2016 to $143bn, according to data from the Investment Company Institute. That is the lowest level since the ICI began compiling records in 2002.
A drop in appetite to invest in such funds pushes up the cost of borrowing for municipal borrowers.
Karen Mills, treasurer for the Town of Cary in North Carolina, said the sharp move was a concern but that 70bp was still a cheap rate to issue debt at. “We are looking into it, trying to understand if the market will settle back to normal or if we should move the issuance [of VRDNs] into fixed-rate money,” she said.
Financial Times
September 16, 2016 7:32 pm
Joe Rennison in New York
Cities are experimenting with ways to meet the goals of affordable housing while still reaping the benefits of the sharing economy.
Home-sharing services like Airbnb are creating an awkward dilemma for cities and counties, especially in areas where housing costs are high. Municipalities are struggling to balance the economic boost from the growth of home-sharing services with the pressing need for affordable housing.
Before we go any further, let’s put the considerable growth of such services into perspective. One study found that 400,000 Airbnb guests who visited New York City in 2012 and 2013 spent $632 million, supporting 4,580 jobs. As compared to tourists staying in hotels, Airbnb guests tended to stay two days longer and spent nearly $200 more at local businesses during their visit.
But in New York as in other cities and counties, this new revenue comes with a hitch: Home-sharing services take apartments off the long-term rental market and are a factor in driving up rents to unaffordable levels. Airbnb alone has 1.5 million listings in 34,000 cities.
The problem is particularly acute in New York City, despite a state law that prohibits residential properties with three or more units from being rented for less than 30 days unless the permanent resident is present. According to a report released in June by a consortium of housing activists, 55 percent of the 51,000 Airbnb listings in New York City violate that law. (This June the New York Legislature passed a law barring the listing of such units on a home-sharing site; violators could be fined up to $7,500.)
The report contends that the number of vacant and available apartments in New York City would increase by 10 percent if “commercial profiteer” listings — listings that are booked several times per month and listed for at least three months per year by someone who advertises multiple apartments on Airbnb — were returned to the rental market. Presumably, rents would drop by an offsetting amount, making for significantly more affordable shelter for low- and moderate-income families.
The study showed that rents had risen fastest in the New York City neighborhoods where Airbnb is the most popular — including gentrifying, predominantly minority neighborhoods like Bedford-Stuyvesant. It’s only fair to note that the report was commissioned by affordable housing advocates who have long been critics of Airbnb.
New York is not alone in trying to deal with its home-sharing dilemma. Municipal leaders around the globe are increasingly torn between how to balance the goals of affordable housing and still reap the vitality and revenue from the so-called sharing economy.
In Chicago, city aldermen passed an ordinance in June, backed by Mayor Rahm Emanuel, that imposes a 4 percent surcharge on short-term rentals — that is, in addition to Chicago’s 17.4 percent hotel tax. The surtax will be used to help fund services for the homeless.
San Francisco, where rents are infamously high, requires short-term rental sites to take down any rental listing not registered with the city or be subject to fines for each one. Airbnb is attempting to block the ordinance by suing the city in federal court. It claims the city is violating the Communications Decency Act, which prevents governments from holding Internet platforms liable for content created by their users.
Meanwhile, several cities are tapping into home-sharing as a revenue stream — ignoring, for now, the issue of affordable housing. In a recent deal worth about $5 million a year to Los Angeles, Airbnb will collect lodging taxes from rental hosts who are supposed to, but often do not, pay the same kind of lodging taxes as hotels. L.A. tax officials have struggled to track down hosts and make sure they pay. Now they’ll get some help from Airbnb itself.
“There is going to be a lot of debate about how this industry is regulated,” Miguel Santana, L.A.’s top budget official, told the Los Angeles Times. “We just want to make sure that while that conversation is taking place, the city is not missing out on millions of dollars in revenues.”
GOVERNING.COM
BY FRANK SHAFROTH | SEPTEMBER 2016
School districts are under continuous pressures to provide a high quality education to their students with ever tighter budgets. GFOA has developed the Best Practices in School Budgeting and numerous related resources and supports in order to help school districts better align their limited resources with their student outcome and achievement goals.
Step 1. Plan and Prepare. The planning and budgeting process begins with mobilizing key stakeholders, gathering information on academic performance and cost structure, and establishing principles and policies to guide the budget process.
Step 2. Set Instructional Priorities. The budget needs to be rooted in the priorities of the district. Intentionally created instructional priorities provide a strong basis for developing a district’s budget and strategic financial plan, as well as presenting a budget document.
Step 3. Pay for Priorities. Current resources and expenditures must be thoroughly analyzed in order to find capacity to pay for top instructional priorities.
Step 4. Implement Plan. The “strategic financial plan” is the long-term road map for implementing the district’s instructional priorities. A “plan of action” describes how the strategic financial plan will be translated into coherent actionable steps.
Step 5. Ensure Sustainability. The planning and budgeting process should be one that can be replicated in the future in order to ensure the district remains focused and plans accordingly for reaching its student achievement goals.
The Best Practices in School Budgeting incorporate research proven practices into a cohesive budget process that is centered on aligning resources with student outcomes through strong collaboration of academic and finance staff. The following provides more information on the Best Practices and how to incorporate this process in your district.
A corner of the municipal-bond market that has quietly enjoyed near-zero borrowing costs for more than six years has seen interest rates spike by nearly 7,000 percent since February as investors flee tax-exempt-money-market funds.
And it may soon get worse with investors starting to price in higher benchmark rates in recent weeks. While the Federal Reserve isn’t seen tightening at this week’s policy meeting, U.S. central bankers may still boost rates as soon as December, futures contracts indicate.
“If the Fed hikes, you could see higher short-term rates,” said Anthony Valeri, fixed income strategist for LPL Financial in San Diego. Investors in munis with yields that reset periodically “will see higher yields,” he said.
Since the Fed raised interest rates in December for the first time since 2006, municipal-bond investors have enjoyed strong returns as most state and local governments have seen borrowing costs drop as inflation remained subdued. While another Fed hike could once again benefit the $3.7 trillion municipal-bond market, variable-rate borrowers are being hit with higher yields as investors bail out of municipal-money-market funds in advance of new regulations taking effect Oct. 14.
Since August, 10-year municipal bond rates have risen 13 basis points to 1.56 percent, already the biggest monthly increase since May 2015. The Federal Open Market Committee “appears to be split” on whether to raise rates when it’s next meeting winds up Sept. 21, Citigroup Inc. said in a report Sept. 12.
Municipal money-market assets have shrunk $110 billion year-to-date, according to Bank of America Merrill Lynch data. They’re now at the lowest since 1999 as investors shifted money into funds that buy only government debt, which are exempt from the new Securities and Exchange Commission rules that require floating net-asset values and impose liquidity fees and redemption suspensions under certain conditions.
Since the first of the year, the yields as measured by the SIFMA Municipal Swap index, a measure of tax-exempt debt with rates that reset every week, have risen to about 0.7 percent from 0.01 percent, the rate at which it had been near for about six years.
“The fact that SIFMA has increased by 70 basis points is pretty incredible,” said Matt Posner, principal with Court Street Group LLC in New York. “That’s primarily the result the the new regulations.”
The spike has made it difficult for issuers of short-term debt with rates that reset “to take advantage of lower rates” in the municipal-bond market, said Rob Novembre, chief executive officer of Clarity BidRate Alternative Trading System, a division of Arbor Research & Trading LLC that is being created to handle remarketing of such debt.
“Issuers of VRDOs are losing their ability to take advantage of low rates because they’re trading at taxable levels,” said Novembre.
Municipal issuers with short-term debt tied to swaps also have seen no benefit in the rise of short-term rates as the drop in long-term borrowing costs has flattened the yield curve, leaving issuers still owing large sums to unwind the hedge agreements many entered a decade or so ago. They “all are so deep underwater it’s horrible,” said Andrew Kalotay, a specialist on debt management and derivatives.
“Long-term rates have come down since the Fed increased rates,” said Bryan Kern, managing member of KPM Financial LLC, a swaps adviser based in Charlotte, North Carolina. “For a lot of folks with swaps on their books the liability has grown.”
Bloomberg Markets
by Darrell Preston
September 19, 2016 — 2:00 AM PDT
The $1.9 trillion shortfall in U.S. state and local pension funds is poised to grow as near record-low bond yields and global stock-market turmoil reduce investment gains, increasing pressure on governments to put more money into the retirement systems.
With the Federal Reserve deciding to hold interest rates steady at its meeting Wednesday, the funds will continue to be squeezed by rock-bottom payouts on fixed-income securities just as stocks fall overseas and post only modest U.S. gains. As a result, pensions in Illinois, Missouri and Hawaii this year have moved to roll back the assumed rate of return on their investments, joining the dozens that have taken that step over the past two years.
“There’s little light at the end of the tunnel as far as pension funding is concerned,” said Vikram Rai, head of municipal-bond strategy at Citigroup Inc. in New York. “I expect funded ratios will drop further. It’ll require increased pension contributions on the part of the states and local government, but most state and local governments don’t have the ability to do so.”
Pensions count on annual investment gains of more than 7 percent to cover much of the benefits that come due as workers retire. But public plans had a median increase of 1 percent for the year ended June 30, the smallest advance since 2009, when they lost 16.2 percent, according to the Wilshire Trust Universe Comparison Service.
The chief investment officer of the California State Teachers’ Retirement System, the nation’s second-biggest public pension, on Tuesday said it posted similar returns, falling short of its target for a third straight year.
When investments lag expectations, governments and employees can be called upon to increase annual contributions to make up for the shortfall that’s left behind. The decision by the Illinois Teachers’ Retirement System in August to cut its annual return forecast may increase the state’s pension bill by nearly half a billion dollars.
A reversal of fortune doesn’t seem imminent. The Fed Wednesday opted to hold the benchmark lending rate between 0.25 percent and 0.50 percent, which will keep yields low on mortgages, corporate bonds and other fixed-income securities.
“If there’s a real storm cloud on the horizon, then this is it,” said Dan Heckman, a senior fixed-income strategist at U.S. Bank Wealth Management, which oversees $133 billion. “The municipal-bond market at some point in time down the road will suffer from concerns over this level of underfunding. This is going to continue to be a source of problems for many municipalities, both at the state and local level.”
The decision to adopt more modest expectations from their portfolios has been welcomed by credit-rating companies, given than it will prod public officials to put more cash away instead of waiting for windfalls from the next bull run. S&P Global Ratings has praised the moves as positive, though it may lead to cutbacks in other types of spending.
“We continue to see states trying to balance their budgets and address growing long-term liabilities — which are a fixed portion of their budget — and the need to grow other areas,’’ said S&P’s John Sugden. “Some of these fixed costs are crowding out spending on some other pro-growth investment areas like transportation and education.”
The unfunded liabilities of U.S. public pensions — which measures how much more they need to cover all the benefits that have been promised — are already rising. The obligations stood at $1.95 trillion at the end of June, an increase of $510 billion since the end of 2013, according to the Fed’s figures.
The resulting strain has led to credit-rating cuts to New Jersey, Kentucky and Chicago, which in 2015 was cut to junk by Moody’s Investors Service. Illinois, the lowest-ranked state, has been downgraded twice by S&P since 2013 and three times by Moody’s.
In places like Chicago, where the pensions are short a combined $34 billion, the dwindling returns may diminish efforts to pull them out of the hole.
Mayor Rahm Emanuel last week pushed a plan through the city council to raise water and sewer levies to fund the municipal workers’ pension, its most underfunded. Chicago will now pay about $2 billion more to that pension than previously planned over the next six years.
But that doesn’t take into account the impact if investment performance falls below target. The municipal fund assumes returns of 7.5 percent, while only earning 1.8 percent in the year ended in December, according to actuaries. That’s left it at risk of running out of money, despite the injection of taxpayer money.
“If markets are flat or negative in upcoming years, we will continue to lose principal at a double digit rate,” Jim Mohler, executive director of the fund, told lawmakers in Chicago on Monday. “The projected insolvency for the fund will escalate.”
Bloomberg Markets
by Elizabeth Campbell
September 21, 2016 — 2:00 AM PDT Updated on September 21, 2016 — 11:06 AM PDT
When the Federal Reserve gets around to raising interest rates, bond buyers may find some shelter in a mainstay of the municipal market.
Investors should consider purchasing high-coupon state and local debt that governments have the right to buy back at face value in the future, Alan Schankel, a managing director at Philadelphia brokerage Janney Montgomery Scott, wrote in a report released Monday. While the securities are trading well above par — exposing holders to losses if they’re forced to sell them back for 100 cents on the dollar — the higher interest payments mean the bonds won’t fall as much as others when the central bank moves.
Such debt, known as cushion or kicker bonds, typically pays periodic interest at a rate of 5 percent, a level Schankel said has because “almost ubiquitous.” When the price is factored in, that leaves a yield of 2.14 percent for securities that are called in 9 years, amost half a percentage point more than benchmark 9-year debt, according to Schankel.
“The potential for higher yields combined with the defensive nature of cushion bonds make them worthy of consideration for most municipal-bond portfolios, especially with tax-free interest rates hovering near a 50-year low,” Schankel wrote.
Investors are expected to have time to prepare their defense. The futures market predicts there’s only a 20 percent chance that the Fed will lift its overnight lending rate when it meets on Wednesday. Policymakers have held the benchmark steady since December, when it was raised for the first time since 2006.
Bloomberg Markets
by Romy Varghese
September 19, 2016 — 10:21 AM PDT
Taylor Riggs, a contributor to Bloomberg Briefs, talks with Joe Mysak about this week’s municipal market news.
September 22, 2016
Fitch Ratings-New York-15 September 2016: The volume of public power and water utility bond refundings remains high and has provided considerable budget flexibility in recent years, as debt-service expenditures have dropped, says Fitch Ratings. However, we forecast that long-term US interest rates will rise over 100 bps by year-end 2018. In our view, a rise of that magnitude could reduce refunding volume and limit the budget headroom from which utilities have benefitted.
According to “The Bond Buyer,” which utilizes Thomson Reuters data, refunding again represents the largest use of debt proceeds so far this year. Of the $33 billion of issuance by municipal power and water utilities during first-half 2016, over $16.8 billion of the proceeds, or 51%, were used exclusively for refunding. Moreover, $7.5 billion in proceeds, or 23%, were classified as combined-use, suggesting that some portion was also used for refunding. In 2010, only 21% of issuance proceeds were used exclusively for refunding.
The replacement and refunding of debt at lower rates has allowed public power and water utility issuers to reduce interest expense, thereby creating headroom to recover increasing costs related to environmental compliance, demand-side management initiatives, resource acquisitions and the replacement of aging infrastructure, while limiting rate increases for service.
Lower debt service expenditures have also helped water issuers to address budget shortfalls and recover fixed costs, as consumption patterns have stagnated due to greater appliance efficiencies and drought curtailments. Difficulties in recovering all costs stem from rate structures that traditionally have generated the bulk of revenues from customer usage, while the vast majority of utility costs are fixed in their nature. Together, the trends of declining debt service and greater revenue flexibility have broadly resulted in sustained improvement in financial medians in recent years.
Going forward, the benefits of refunding could decline if a rise in interest rates materializes. Fitch expects the Fed to raise rates once this year and twice in 2017, and our forecast is for 10-year US Treasury yields to reach 2.2% by year-end 2017 and 2.8% by year-end 2018. These increases are manageable and would result in rates that are still low by historical standards; however, we believe the gains from refunding are finite and that even a small rise in interest rates could retard recent improvements and result in additional upward pressure on electricity and water rates.
Contact:
Dennis Pidherny
Managing Director
US Public Finance
+1 212 908-0738
Douglas Scott
Managing Director
US Public Finance
+1 512 215-3725
Rob Rowan
Senior Analyst
Fitch Wire
+1 212 908-9159
Media Relations: Alyssa Castelli, New York, Tel: +1 (212) 908 0540, Email: [email protected].
The above article originally appeared as a post on the Fitch Wire credit market commentary page. The original article can be accessed at www.fitchratings.com. All opinions expressed are those of Fitch Ratings.
ALL FITCH CREDIT RATINGS ARE SUBJECT TO CERTAIN LIMITATIONS AND DISCLAIMERS. PLEASE READ THESE LIMITATIONS AND DISCLAIMERS BY FOLLOWING THIS LINK: HTTP://FITCHRATINGS.COM/UNDERSTANDINGCREDITRATINGS. IN ADDITION, RATING DEFINITIONS AND THE TERMS OF USE OF SUCH RATINGS ARE AVAILABLE ON THE AGENCY’S PUBLIC WEBSITE ‘WWW.FITCHRATINGS.COM’. PUBLISHED RATINGS, CRITERIA AND METHODOLOGIES ARE AVAILABLE FROM THIS SITE AT ALL TIMES. FITCH’S CODE OF CONDUCT, CONFIDENTIALITY, CONFLICTS OF INTEREST, AFFILIATE FIREWALL, COMPLIANCE AND OTHER RELEVANT POLICIES AND PROCEDURES ARE ALSO AVAILABLE FROM THE ‘CODE OF CONDUCT’ SECTION OF THIS SITE. FITCH MAY HAVE PROVIDED ANOTHER PERMISSIBLE SERVICE TO THE RATED ENTITY OR ITS RELATED THIRD PARTIES. DETAILS OF THIS SERVICE FOR RATINGS FOR WHICH THE LEAD ANALYST IS BASED IN AN EU-REGISTERED ENTITY CAN BE FOUND ON THE ENTITY SUMMARY PAGE FOR THIS ISSUER ON THE FITCH WEBSITE.
ENDORSEMENT POLICY – Fitch’s approach to ratings endorsement so that ratings produced outside the EU may be used by regulated entities within the EU for regulatory purposes, pursuant to the terms of the EU Regulation with respect to credit rating agencies, can be found on the EU Regulatory Disclosures page. The endorsement status of all International ratings is provided within the entity summary page for each rated entity and in the transaction detail pages for all structured finance transactions on the Fitch website. These disclosures are updated on a daily basis.
View and download data from SIFMA’s new interactive database, Capital Markets in Your State, including top municipal, corporate and equity issuers, securities industry employment and more.
Click here to view the database.
New York, September 13, 2016 — Moody’s Investors Service, at the request of the New York City Municipal Water Finance Authority, has reviewed a proposed change to supplemental resolutions for its variable rate demand bonds.
The change will eliminate the requirement that successor remarketing agents be rated. Remarketing agents are often capital markets subsidiaries of banks and often are not themselves rated.
Moody’s has determined that the change, in and of itself and as of this time, will not have an adverse effect on the long term credit quality of the Authority’s bonds, currently rated Aa1 (first and second resolutions) with a stable outlook, and therefore will not result in reduction or withdrawal of Moody’s ratings. Moody’s does not express an opinion as to whether the change has, or could have, other non credit-related effects.
This publication does not announce a credit rating action. For any credit ratings referenced in this publication, please see the ratings tab on the issuer/entity page on www.moodys.com for the most updated credit rating action information and rating history.
Nicholas Samuels
Lead Analyst
State Ratings
Moody’s Investors Service, Inc.
7 World Trade Center
250 Greenwich Street
New York 10007
US
JOURNALISTS: 212-553-0376
SUBSCRIBERS: 212-553-1653
Emily Raimes
Additional Contact
State Ratings
JOURNALISTS: 212-553-0376
SUBSCRIBERS: 212-553-1653
Releasing Office:
Moody’s Investors Service, Inc.
250 Greenwich Street
New York, NY 10007
U.S.A
JOURNALISTS: 212-553-0376
SUBSCRIBERS: 212-553-1653
State and local governments are trying unconventional ways to fund their pension liabilities, such as offering lump-sum cash payments to employees.
When it comes to chipping away at pension liabilities, there aren’t a lot of options. In some places, lawmakers can freeze cost-of-living increases to pension payments or move back retirement dates for existing employees. But that’s not legal everywhere. So the majority of pension reforms in the past decade have targeted new employees and focused on controlling the growth of future liabilities.
But some places are getting more creative.
In Philadelphia, where the municipal pension plan is less than half-funded, Controller Alan Butkovitz is pushing a buyout of sorts aimed at the city’s most expensive workers. In exchange for taking an upfront cash payment based on their estimated lifetime benefits, the employee or retiree would accept a reduced level of pension benefits going forward. The benefits would be equivalent to what newer Philadelphia public employees are receiving now.
“We’ve settled on benefits right now that everyone agrees are reasonable and humane,” said Butkovitz. “Their survival and living standard is protected. If you’re going to give them a lump sum of money, behaviorally, people prefer that approach.”
The buyouts would be offered to 31,000 city retirees and 2,500 active employees who are members of Plan 67, the city’s oldest and most generous pension plan in which employees can receive up to 100 percent of their final salary in retirement. Plan 67 is responsible for $5 billion of the city’s roughly $6 billion in unfunded liabilities.
If every eligible plan member takes the buyout, it would reduce Philadelphia’s unfunded liability by $1 billion, according to an independent audit. And, the idea goes, those who opt for the lump-sum payment could use it as an opportunity to pay off debt or a mortgage, or start a new business.
Philadelphia isn’t the only place where hamstrung officials are considering unconventional solutions for their pension plans.
In Illinois, where courts have ruled against any changes to retirees’ payments, lawmakers have contemplated lump-sum payouts to reduce their unfunded pension liability. The state’s public employees plan is currently 34 percent funded.
In Connecticut, Gov. Dannel Malloy is pushing a plan that would split its troubled state employees’ pension fund into two, as a way of isolating the unfunded liability.
Experts say the main difficulty with these approaches is that they tend to be more complicated than they are effective. The proposal in Connecticut doesn’t reduce the actual amount the government owes its retirees — it merely pays for the more expensive pension benefits directly out of the state’s annual budget so the liabilities are not on the pension fund’s balance sheets.
“The split is a helpful accounting exercise, but it really comes down to: Are you really putting in today what you need for the future?” said Greg Mennis, director of The Pew Charitable Trusts’ public-sector retirement systems project.
Connecticut, he added, has a history of not paying its pension bills, which is why the system is so underfunded. S&P Global Ratings said last year that the split could worsen the state’s unfunded liabilities and warned it could downgrade Connecticut if it moved ahead with Malloy’s proposal.
“There are no panaceas,” said Mennis.
Pension buyouts have worked in the corporate sector where employees have taken a lump-sum payment at a slight haircut. But they haven’t been done in the public sector, thanks to the different accounting rules for public pensions that make their liabilities appear lower than comparable corporate-sector plans, said Josh B. McGee, senior fellow at the Manhattan Institute and vice president of public accountability at the Laura and John Arnold Foundation.
That can mask what a government would actually owe an employee who wants to cash out today. Indeed, an initial analysis of Bukovitz’s original idea of a straight pension buyout proved to be too expensive for the city.
The optics are also a challenge, said McGee. “Politically, you’re saying you’re going to cash out and give someone a lump sum. The public perception of that is not that great.”
As for what’s next, Butkovitz said the pension board this month is discussing a number of issues it would like to address via a member survey, including the minimum threshold for participation, the age range of people opting in and whether those who take a lump-sum payment would also agree to financial management classes.
GOVERNING.COM
BY LIZ FARMER | SEPTEMBER 15, 2016
New Census data shows some cities have a lot of residents who consume more public services than they contribute in taxes. That can cause fiscal problems down the road.
Demographic data can say a lot about who lives in a city. It can also be an indicator of that city’s finances.
Generally speaking, if a city has a high number of residents who consume more public resources than they contribute to the tax base, there will more likely be potential problems for that city’s fiscal outlook.
New 2015 estimates from the Census Bureau’s American Community Survey published Thursday provide an updated demographic snapshot for localities. We’ve compiled data on a few key measures — poverty, aging populations and employment status — for the 500 largest cities, showing places facing steeper demographic hurdles.
GOVERNING.COM
BY MIKE MACIAG | SEPTEMBER 15, 2016
The use of private financing to develop microgrids — alternative sources of power generation for use when the energy grid goes down — is on the rise and a growing level of investment is occurring through P3s.
Although 90 percent of microgrid projects had been financed entirely by their private users from 2010 to 2014, the amount of mixed investment in such projects is expected to reach 38 percent this year. Partners will include utilities and public agencies, according to an article in the Aug. 30 issue of Utility Dive.
The use of microgrids to distribute power produced diesel generators solar arrays, combustion turbines and other equipment, is increasing rapidly as well, possibly due to the infrastructure damage caused by serious weather events, such as hurricanes and western wildfires. Interest in microgrids surged in 2012 in the wake of Hurricane Sandy, for example. As a result, U.S. microgrid capacity is expected to reach 4.3 gigawatts in four years, a 116 percent increase in annual installed capacity, according to a report on microgrids published by GTM Research (paywall).
The Port of Los Angeles is also teaming up with Pasha Stevedoring & Terminals L.P. the private company that runs the port, to replace its aging electrical system by installing a $27 million rooftop solar photovoltaic system that will be supplemented by a 2.6 megawatt battery storage system, PV Magazine reported. The Green Omni Terminal Project will be a scalable model that can be used to upgrade the port’s other 26 terminals and others nationwide.
The California Air Resources Board is also providing $14.5 million for the project, which is designed to help the port meet the state’s strict air quality requirements and will incorporate electric vehicles and cargo handling equipment into port operations.
In addition to its environmental benefits, building a microgrid to distribute the energy produced could help the port keep functioning during a disaster or an attack and save a great deal of money. It has been estimated that total service disruption at the port could cost the national economy a billion dollars a day.
Examples of small-town supplemental energy P3 projects — which could lead to microgrid development — are starting to sprout up as well. The village of Minster, Ohio, which owns a local electricity distribution network, negotiated a power purchase agreement with energy and financing company Half Moon Ventures. The company financed the construction of a 3-megawatt solar array and a 7-megawatt lithium-ion energy storage system. The agreement sets electricity fees at prices comparable to those charged by the regional utility and will allow the city to store energy to prevent power disruptions to key businesses in the area should the primary power grid fail, another Utility Dive article said. The project’s success has caused Minster to begin considering building its own microgrid.
Although the ability to build a microgrid may be beyond the reach of many small communities — especially those that do not have access to private financing — large companies, such as Walmart and Ikea could benefit from the existence of this infrastructure through which they could buy renewable energy through power purchase agreements negotiated with alternative energy producers.
NCPPP
September 12, 2016
WASHINGTON – Money market mutual funds’ holdings of municipal bonds fell by nearly $42 billion dollars between the second quarter of this year and the same period last year, a change that is partially the result of soon-to-become-effective rule changes from the Securities and Exchange Commission.
The recorded drop was part of the municipal data the Federal Reserve Board released on Friday in its quarterly Flow of Funds report.
The total amount of money market fund municipal securities holdings in the second quarter of 2016, $216.2 billion, is roughly 16% less than the $257.9 billion the funds held in the same quarter last year. It is a 30% drop from the $309 billion in munis the funds held at the end of 2013.
The decline occurred in the months before a new SEC money market rule is set to take effect on Oct. 14. The rule requires certain money market funds offered to institutional investors to change their method of calculating their net asset value (NAV), or the value per share, to floating from fixed. The rule is designed to prevent investors from getting out of money market funds on a large scale, which happened to the Reserve Primary Fund during the financial crisis in 2008.
Matt Fabian, a partner with Municipal Market Analytics, said that while the SEC rule played a role, the decline can largely be attributed to the trouble tax-exempt rates have had competing with the rising LIBOR. This has happened in the case of retail money market funds, which are not subject to the SEC rule changes but are also seeing large declines.
“In my mind, a big part of the [LIBOR] increase is going to be temporary because the market doesn’t know what is going to happen on Oct. 14 when the new [SEC] rule gets fully unrolled,” Fabian said.
He added that cash managers are reallocating away from money market funds until then, but that once Oct. 14 comes, as long as “the world doesn’t end,” he expects some assets would go back into the funds while a significant portion of the allocations away from the funds will remain permanent.
In all, according to Fabian, money market fund muni holdings have decreased to just over $140 billion as of Sept. 14 from more than $500 billion in 2008.
The flow of funds data also showed the general trend of a decrease in household ownership of munis coupled with an increase in U.S. bank ownership of the securities continued in the second quarter of this year. Household holdings of munis were down 5.2% year over year, falling to $1.64 trillion in 2016 from $1.73 trillion in the same quarter last year. Over that same period, bank holdings increased 10%, rising to $524.1 billion from $474.6 billion the year before.
Household ownership of munis is now down 10.3% from its $1.83 trillion of holdings in 2013 and U.S. bank ownership of munis is up 25% from its $418.9 of muni holdings that same year.
The SEC’s Investor Advocate Rick Fleming recently addressed the narrowing of household ownership of munis in a speech he delivered at the Municipal Securities Rulemaking Board’s Securities Regulator Summit on Aug. 25. He said that data as current as December 2015 showed individuals owned approximately 70% of munis either directly or indirectly through mutual funds or other pooled investment vehicles, but added that “if you drill beneath those statistics, some interesting – and some might say troubling – patterns emerge.”
Fleming said that the wealthiest one-half percent of U.S. households now own roughly 42% of all munis. The bottom 90% of households hold less than 5%. Additionally, only 2.4% of households hold any municipal debt, he said.
The Bond Buyer
By Jack Casey
September 16, 2016
In 2015, 13 states didn’t allocate any private activity tax-exempt bond (PAB) cap to affordable rental housing, according to the Council of Development Finance Agencies (CDFA). Meanwhile, also in 2015 $65 billion in available PAB cap went unused, $54.5 billion of which was carried forward to 2016. And from about 30 states according to the CDFA, an aggregate $10.5 billion could not be carried forward and was abandoned last year. A rough estimate indicates this lost resource just in one year could have made possible 80,000 more affordable apartments. At a time when affordable housing needs throughout the United States are so great, now is the time to review how to unleash this bond cap so more affordable rental housing can be built.
Novogradac & Company LLP
Published by Michael Novogradac on Monday, September 12, 2016 – 12:00am
Executive Summary:
Continue reading.
by Christine Todd, CFA – President of Standish and Head of the Tax-Sensitive and Insurance Strategies
September, 2016
Summary
The description, versus the definition of appropriation bonds is a contradiction in terms. In a financial context, bonds imply the existence of debt. There are lenders and a borrower who is legally obligated to repay the debt under terms of a contract. If violated, bondholders have the right to seek repayment in court.
Appropriation backed municipal bondholders do not have the right to seek repayment in court. The entity that is the source of the appropriation for P&I has no legal obligation to make that appropriation resulting in near immediate monetary default.
Appropriation bonds are issued by a large number of state corporations of the most populous states. Those states have authorized many local governments to issue them as well. All to circumnavigate limits and restrictions on the issuance of legally enforceable debt.
Ironically, it is precisely the voluntary non-mandatory nature of the P&I appropriation that makes their issuance legal – the bonds do not constitute debt within the meaning of constitutional law or statute.
To the uninitiated, the above facts might seem hard to believe, but there is a rational for their large presence since first being introduced in the early 1980’s by the New York State Municipal Assistance Corporation. Originally, they were referred to as “moral obligation” bonds.
Investors are willing to buy appropriation bonds because they understand that failure to make an appropriation for P&I would have a large negative impact on creditworthiness of the appropriating entity
This is undoubtedly true, as long as the appropriating entity, most are states, does not fall on hard times or mismanage its debt or both. In either case, appropriation bonds are the first to go unpaid because the issuer has no legal obligation to repay them.
The U.S. municipal bond market is the only debt market where appropriation backed bonds exist. They account for approximately 20% of the $3.5 outstanding, or $700 billion.
States and municipalities that partake in appropriation financings aren’t the issuers of this kind of “debt”. Instead, they are the appropriating entities that support P&I, not the bond issuers. Governments create state and municipal corporations to be the issuers of all outstanding appropriation backed bonds.
There is simply no legal authorization for any state or municipality to directly issue appropriation backed bonds.
Unfortunately, standard nomenclature to identify appropriation risk does not exist. Not all state corporations issue appropriation bonds. Many constitute government sponsored essential service enterprises. Their bonds are secured by user charges and fees, not by appropriation or general taxation.
To determine whether the bond has appropriation risk, look for phrasing like the following on the cover page of the issue’s official statement.
“The obligation of the State to make financing agreement payments is subject to the State Legislature making annual appropriations for such purpose and such obligation does not constitute or create a debt of the State, and the State has no continuing legal or moral obligation to appropriate money due under any financing agreement.”
Disclosure may instead refer to pledged revenue under a lease or other form of payment agreement. Currently, certificates of participation and pension funding obligations are descriptions commonly used by localities issuing appropriation bonds.
The description of appropriation bonds can be very misleading. The above referenced disclosure quote was taken from an issue of Dormitory Authority of the State of New York Sales Tax Revenue Bonds Series 2015B. There is a high likelihood that bondholders think their investment is secured by a continuing claim on the State’s sales tax. But in fact, payment of P&I rest on voluntary annual appropriations
Appropriation bonds are issued by localities to fund delinquent retirement contributions. They have played a leading role in precipitating almost every municipal bankruptcy going back to and including the Orange County, California default in the 1980’s.
Detroit’s $1.5 billion appropriation pension funding bonds were settled under Chapter 9 at 14 cents on the dollar.
The bonds had a security interest in additionally gaming taxes that generated 14% of P&I. Had it not been for the fact the bonds had a real security interest in other revenues, a recovery value of zero cents on the dollar can be seen. I cannot see why appropriation bondholders even deserve standing in Chapter 9 proceedings. It may evolve to that.
The presence of these non-debt debts is largely the result of constitutional constraints on the issuance of enforceable state and local debt. Unlike enforceable bonds, they can be issued for any purpose and in any amount the issuer chooses and the market will accept. There is potential for misuse.
All but a handful of U.S. states are limited to the issuance of general obligation bonds by their constitutions. GO authorization requires voter approval which is not always forthcoming. That leaves appropriation bonds as the only alternative source of capital improvement funding.
From the investor point of view, I see two solutions, constitutional amendments giving states more flexibility to issue enforceable debt, or providing investors with significantly higher rates on appropriation debt to compensate for the additional risk. Personally, I would stay away from a locally issued appropriation bonds.
Seeking Alpha
Sep. 19, 2016 2:25 AM ET
Carl Dincesen
Disclosure: I/we have no positions in any stocks mentioned, and no plans to initiate any positions within the next 72 hours.
I wrote this article myself, and it expresses my own opinions. I am not receiving compensation for it (other than from Seeking Alpha). I have no business relationship with any company whose stock is mentioned in this article.
When one of the tiniest pension funds imaginable — for Citrus Pest Control District No. 2, serving just six people in California — decided last year to convert itself to a 401(k) plan, it seemed like a no-brainer.
After all, the little fund held far more money than it needed, according to its official numbers from California’s renowned public pension system, Calpers.
Except it really didn’t.
In fact, it was significantly underfunded. Suddenly Calpers began demanding a payment of more than half a million dollars.
“My board was somewhat shocked,” said Larry Houser, the general manager of the pest control district, whose workers tame the bugs and blights that threaten their corner of California citrus country. It is just a few miles down the road from Joshua Tree National Park.
It turns out that Calpers, which managed the little pension plan, keeps two sets of books: the officially stated numbers, and another set that reflects the “market value” of the pensions that people have earned. The second number is not publicly disclosed. And it typically paints a much more troubling picture, according to people who follow the money.
The crisis at Citrus Pest Control District No. 2 illuminates a profound debate now sweeping the American public pension system. It is pitting specialist against specialist — this year in the rarefied confines of the American Academy of Actuaries, not far from the White House, the elite professionals who crunch pension numbers for a living came close to blows over this very issue.
But more important, it raises serious concerns that governments nationwide do not know the true condition of the pension funds they are responsible for. That exposes millions of people, including retired public workers, local taxpayers and municipal bond buyers — who are often retirees themselves — to risks they have no way of knowing about.
“One of the first things I think you should do is publish that number for every city,” said William F. Sharpe, professor emeritus of finance at Stanford University’s Graduate School of Business who won the Nobel in economic science in 1990 for his work on how the markets price financial instruments. He is also a California resident who voluntarily helped his city, Carmel-by-the-Sea, crack the secret pension code — figuring out the market value of its debt to its retirees in 2011 before Calpers resolved to start divulging the information later that year.
“We just about nailed it, which made us feel very good for ourselves — but very bad for the city,” Professor Sharpe said. On a market basis, the city turned out to be $48 million short of what it owed retirees, or four times what the official numbers showed.
The two competing ways of valuing a pension fund are often called the actuarial approach (which is geared toward helping employers plan stable annual budgets, as opposed to measuring assets and liabilities), and the market approach, which reflects more hard-nosed math.
The market value of a pension reflects the full cost today of providing a steady, guaranteed income for life — and it’s large. Alarmingly large, in fact. This is one reason most states and cities don’t let the market numbers see the light of day.
But in recent years, even the more modest actuarial numbers have been growing, as populations age and many public workers retire. In California, some struggling local governments now doubt they can really afford their pension plans, and have told Calpers they want out.
In response, Calpers has calculated the heretofore unknown market value of their pension promises — and told them that’s the price of leaving, payable immediately. Few have that much cash, so it’s welcome to the Hotel California: You can check out anytime you like, but you can never leave.
Calpers says it must bill departing governments for every penny their pensions could possibly cost because once they cash out, Calpers has no way of going back and getting more money from them if something goes wrong. Calpers keeps that money in a separate “termination pool.”
Things went differently for Citrus Pest Control District No. 2. It withdrew first, before realizing the shortfall. Then, four months later, it got the unexpected bill from Calpers.
“I was opening the mail and thinking, ‘Can this be right?’ I thought they put an extra zero on it,” said Tim Hoesterey, one of the district’s two employees.
The bill came just as the district was building up a war chest to fight a virulent new citrus blight, a disease that had already devastated groves in Florida. The directors had armed themselves by raising a growers’ tax per acre fivefold. Suddenly, paying Calpers would wipe out the whole citrus blight reserve.
Some wondered if they should just declare bankruptcy.
“There are people selling their farms, trying to get out of the business, because they can’t make a profit anymore,” Mr. Hoesterey said. He called Calpers to see if the district could get a break, an extended due date, or even stay with Calpers after all. Calpers said no. It was a done deal.
A Calpers spokeswoman, Amy Morgan, said such questions suggested “a misunderstanding of the purpose of Calpers.”
“Calpers does not exist to make money,” she said. “Calpers exists to fully pay out benefits that are promised to its members.” She said the law required Calpers to perform a complete valuation after the termination date had passed, and to recover all the money needed to ensure that the retirees would be paid in full.
Today in California, both the market values and the actuarial pension values for many places are available on a website run by the Stanford Institute for Economic Policy Research. But for the 49 other states, the market numbers remain unknown.
The market-based numbers are “close to the truth of the liability,” Professor Sharpe said. But most elected officials want the smaller numbers, and actuaries provide what their clients want. “Somebody just should have stopped this whole charade,” he said.
For years, people have been trying to do just that. In 2003, the Society of Actuaries, a respected professional body, devoted most of its annual meeting to what was called “the Great Controversy” — the notion that the actuarial standards for pensions were fundamentally flawed, causing systemic underfunding and setting up a slow-moving train wreck when baby boomers retired. It drew a standing-room-only crowd.
The problem reaches far beyond pensions, and into the $3.7 trillion municipal bond market. The reason is that municipal bond ratings take into account the strength (or weakness) of government pension plans. If those numbers have been consistently wrong, as dissidents argued, then actuaries were helping mislead the investors buying municipal bonds.
Arguably, the flawed standards worsened the problem with each passing year: Actuarial values determine the annual contributions that states and local governments make to their pension plans, so if the target numbers are too low, the contributions will always be too small. Shortfalls will be compounding, invisibly.
Much of the debate surrounded the routine practice of translating future pension payments into today’s dollars, which is called discounting. The tiny pension plan at Citrus Pest Control District No. 2 shows clearly what the problem is.
With everybody either retired, or about to be (Mr. Houser will retire later this year), there is no guesswork in determining everybody’s pensions. The actuaries at Calpers project each of the future monthly payments due to Mr. Houser and the other five retirees, assuming they will live to age 90. (Mr. Hoesterey is not included because his retirement benefit is the new 401(k) plan.) Then, they translate all those future payments into today’s dollars with a rate — often called a discount rate. This is exactly how a lender would calculate a home mortgage.
The problem is, which rate should be used? An economist would say the right rate for Calpers is the one for a risk-free bond, like a Treasury bond, because public pensions in California are guaranteed by the state and therefore risk-free. And that’s what Calpers does when it calculates market values. It used 2.56 percent when it calculated the bill for the pest control district, producing a $447,000 shortfall.
But the rest of the time, Calpers and virtually all other public pension funds use their assumed annual rate of return on assets, now generally around 7.5 percent. Presto: This makes a pension appear to have a much smaller liability — or even a surplus.
That was the case with the pest control district for years. And since there seemed to be a surplus, Calpers said the district owed no annual contributions. Calpers’s numbers hid it, but the six members’ pensions were going unfunded.
“Every economist who has looked at this has said, ‘It’s crazy to use what you expect to earn on assets to discount a guaranteed promise you have made. That’s nuts!’” Professor Sharpe said.
But what he calls crazy is enshrined in the actuarial standards. And since adhering to the standards makes public pensions look affordable, there is a powerful incentive to preserve those standards.
“Actuaries shamelessly, although often in good faith, understate pension obligations by as much as 50 percent,” said Jeremy Gold, an actuary and economist, in a speech last year at the M.I.T. Center for Finance and Policy. “Their clients want them to.”
Mr. Gold was also a ringleader of that stormy professional meeting in 2003. Since then, there have been more conferences, monographs, speeches, blue-ribbon panels and recommendations — to say nothing of an unusual spate of municipal bankruptcies and insolvencies in which ailing pension plans have played starring roles. And yet little has changed.
Even as Citrus Pest Control District No. 2 was scrambling to find the cash to pay its unexpected bill this year, another fight broke out within the American Academy of Actuaries, which represents the profession in Washington, over the same issues.
An academy task force had commissioned a paper on how financial economists would measure public pensions. But during the peer review process, the opus was spiked, the task force disbanded and the four authors — Mr. Gold among them — barred from publishing the work elsewhere.
Accusations of censorship flew. The four authors said the academy’s copyright claims were false. The academy’s president, Thomas F. Wildsmith IV, said in a statement to members on the academy’s website that the paper “could not meet the academy’s publication standards.”
In a separate email message to The New York Times he said the academy was committed to helping the public understand the different measurements, and provided a position paper concluding that both measures are useful, but for different purposes.
Then the Society of Actuaries, which handles the education and testing of actuaries, joined the fray. It posted the suppressed paper on its own website, albeit with the authors’ names removed. It claimed to hold the copyright jointly with the academy. It also added a statement that the paper did not reflect the position “of any group that speaks for the profession” but called the authors “knowledgeable.”
The society’s president, Craig W. Reynolds, sent an email message citing other efforts “to develop strong funding programs that are responsive to a rapidly changing environment.”
The four authors then issued a revised version of their paper, with their names on the front — and a claim that they held the copyright. The paper, which runs 19 pages, says in brief: Use market values for public pensions.
Professor Sharpe noted that Calpers’s market-based method was “virtually the precise approach advocated in this paper.”
Almost, but not entirely.
At Citrus Pest Control District No. 2, Mr. Hoesterey said Calpers added a final twist. It took so long to calculate the district’s final payment that the bill arrived four months after the district’s withdrawal date — and then it charged four months’ interest, at 7.5 percent, on the late payment.
Ms. Morgan, the spokeswoman, said the four-month lag was “unfortunate but unavoidable.”
Mr. Hoesterey said Calpers should have warned the district well in advance how big the bill might be, to give it time to find the money. “I kept asking: ‘Does this seem fair to you? What other organization conducts business like this?’” he said.
Seeing no way out, the district paid the whole thing.
THE NEW YORK TIMES
By MARY WILLIAMS WALSH
SEPT. 17, 2016
Kate Boatright discusses some prison rating changes, in light of recent DOJ memo, and Carol Spain provides an update on the status of OPEB liabilities at the state level.
Sep. 14, 2016
In this CreditMatters TV segment, Larry Witte, Senior Director with Global Fixed Income Research, discusses findings for the second quarter of 2016, which was the 15th straight to see more ratings upgrades than downgrades in U.S. public finance.
Sep. 16, 2016
Voters will have more than Donald Trump and Hillary Clinton to consider at the polls in November; they’ll be weighing whether to approve spending for over $200 billion for roads, transit systems, schools and other projects.
For the first time since 2008, voters will see more than half a dozen so-called mega infrastructure projects on ballot measures, including $120 billion in Los Angeles; $53.8 billion in Seattle; $4.7 billion in southeastern Michigan and $2.5 billion in Atlanta. In California, voters will decide on funding housing for the homeless, $9 billion of school-facility bonds and to further finance San Francisco’s transit system. Colorado ballot measures contain $4 billion of bonds for schools in various districts.
Officials are banking on voters giving them authority to tap into near record-low municipal bond interest rates to address a backlog of projects estimated at $3.6 trillion, according to the American Society of Civil Engineers in Washington.
“Everyone’s been talking for years that interest rates are low and it’s a good time to borrow,” said Natalie Cohen, managing director for municipal-securities research with Wells Fargo Securities LLC in New York. “Lower interest rates are with us now, but there’s some expectation they will go up.”
The long list of projects is viewed as a sign of renewed confidence in many state and local governments that a stronger economy has restored revenues and made it possible to focus on new spending to address the backlog of needs including road and highways, transit systems and sewer and water works. The need for such spending has been injected into the U.S. presidential campaign, with both Clinton and Trump promising hundreds of billions of dollars for the country’s fraying infrastructure.
“What we’re seeing going on at the ballots is state and local governments acknowledging they have an infrastructure problem and are now showing a willingness to do something about it,” said Brian Pallasch, managing director government relations and infrastructure initiatives at the civil engineers society. “This problem has been building for years.”
Overall the financial health of many state and local governments continues to improve after suffering setbacks after the financial crisis that began in 2008. S&P Global Ratings said in July that increased consumer spending and housing market expansion have helped improve the credit conditions. And state spending has surpasses pre-recession peaks even as growth continues to lag and pressure state finances, BlackRock Inc. said in a report last month.
Municipalities across the country have already sold more than $294 billion of bonds this year, on pace to surpass 2010’s record amount of bond issuance. More of the bonds are going to fund new infrastructure rather than refinancing higher cost debt sold in previous years, a sign that officials are trying to catch up on needs neglected after the worst recession since the 1930s.
Projects oriented toward improving transportation got a boost this year after Congress and the president approved a $305 billion highway bill that will provide funding over five years, said Wells Fargo’s Cohen, the first long-term surface transportation legislation in a decade. The program creates matching opportunities for local projects. Transportation is the largest need of the civil engineers group’s list.
In Los Angeles, municipal officials are pushing for a new half-cent sales tax and the extension of an existing levy that could raise $120 billion for transportation infrastructure over the next four decades. The plan calls for funding transit projects, road and highway construction as well as walking and biking routes.
“We believe that we will settle once and for all the transportation challenges” in Los Angeles, Phillip Washington, chief executive officer of the Los Angeles County Metropolitan Transportation Authority, said Monday during a conference call on transportation projects.
In general, voters have shown a willingness to approve bond and tax issues. Integrated Market Systems, a San Diego company that tracked 295 bond issues on the ballots during primaries before May 25, found that 77 percent were approved by voters. In March, North Carolina voters approved $2 billion of bonds for new buildings at the University of North Carolina and community colleges, local water and sewer systems, parks and other projects.
“The success of funding ballot measures is very high,” said Michael Likosky, infrastructure principal at 32 Advisors, a New York firm that advises on investments. “Governments are getting stabilized and asking for infrastructure funding again.”
Bloomberg Markets
by Darrell Preston
September 13, 2016 — 2:00 AM PDT
New York’s transit agency is cashing in on the massive development rising from an industrial landscape on Manhattan’s far west side.
The Metropolitan Transportation Authority, which typically uses fare-box revenue and bridge and tunnel fees to secure its debt, raised $1.06 billion Wednesday by selling its first bonds backed by real-estate. The securities will be repaid from money the agency receives from leasing land in Hudson Yards, a 26-acre site whose development has triggered a surge of construction in residential towers, office space and retail near the riverside west of Eighth Avenue.
Goldman Sachs & Co., the lead underwriter on the deal, priced the bonds — which have 5 percent coupons and mature in 2046, 2051 and 2056 — at yields of 1.88 percent, 2.38 percent and 2.63 percent, respectively, according to data compiled by Bloomberg.
“People like larger names in high-tax states that are unique in their credit story,” said Sean Carney, head of municipal strategy at BlackRock Inc., which manages about $124 billion of municipal debt.
The Hudson Rail Yards Project, developed by affiliates of Related Cos and Oxford Properties Group, is transforming Manhattan’s largest tract of undeveloped land. When completed by 2029, it will have three office towers, nine residential buildings, 1 million square feet of retail anchored by Neiman Marcus, a luxury hotel, 15 acres of public space and a cultural center. Monthly rent payments will cover the bonds. Time Warner Inc., KKR & Co. and Wells Fargo & Co. are among the future occupants.
The new bonds, called Hudson Rail Yards Trust Obligations, may be a draw to New York investors looking to diversify their portfolios, said Scott Richman, chief investment officer at Whitehaven Asset Management, which oversees $110 million of assets, the bulk of which is municipal debt.
“For the mutual funds, this entity will count as a different name and for better or worse a different name is actually worth a lot in the municipal market,” Richman said. “So even though it might have a similar credit backing to a much larger issuer, that will create demand within the space.”
The sale comes amid strong demand for municipal bonds that has kept yields — which move in the opposite direction as price — near record lows. The MTA’s most actively traded securities — revenue bonds with a 4 percent coupon that mature in 2036 — changed hands Wednesday at an average yield of about 2.6 percent, down from a 2.67 percent yield when they were first sold on June 23, according to data compiled by Bloomberg.
MTA’s rail yards run from 30th to 33rd streets and between Tenth and 12th Avenues. The MTA leased the airspace above the above the rail yards to Related and Oxford. The developers are almost finished building a platform over the eastern half of the site and will do the same on the western half.
The rail yards are the center of a larger rehabilitation of the once-decrepit area, called the Hudson Yards District. A new 7 subway line station, financed by $2 billion of city bonds, opened on the site a year ago to connect the area to midtown Manhattan. To the south is the High Line, a landscaped promenade on a former elevated rail line that extends from Greenwich Village through part of Chelsea.
The MTA’s real estate consultant Jones Lang LaSalle Americas, Inc. has valued the Western Rail Yards at $3.2 billion to $3.7 billion, according to bond documents.
“With this transaction MTA is taking advantage of significant value of the Hudson Rail Yard assets and low interest rates to monetize the ground leases on the Eastern and Western Rail Yards,” Pat McCoy, the agency’s finance director, said in an e-mail.
The bulk of the bond proceeds will repay notes the MTA sold to finance capital projects ahead of the sale, according to McCoy. In the event a tenant defaults on lease payments, the agency agrees to pay interest on the bonds for up to seven years, according to McCoy. The MTA also has the option to take over a defaulted lease and make the full payments.
Moody’s Investors Service rates the bonds A2, its sixth-highest investment grade and one step below MTA’s transportation revenue bonds, citing the stability provided by the escalating ground rent payments, given the high value of the real estate. Kroll Bond Rating Agency assigned its A- rating, one step lower.
The bonds may be redeemed early if Related and Oxford elect to prepay their leases, which could leave debt due in 2056 paid off by 2026, under one scenario.
“All of a sudden you don’t have a long bond in your portfolio, you have a 10-year security,” said Robert Amodeo, head of municipals in New York for Western Asset Management Co., which holds $25 billion of the securities.
There’s also a risk that development of the Western Rail Yards may fall behind schedule and real estate values could fall, he said.
Those risks are offset by the structure of the lease payments, which are senior to mortgage payments paid by Related and Oxford and the MTA’s willingness to step in to pay interest payments if there’s a default. The developers and lenders have a strong motivation to avoid default, said Rachael McDonald, a Moody’s analyst in New York.
“Given the high potential value of the properties once completed, we believe there are strong incentives in place for the tenants to pay,” McDonald said.
Bloomberg Markets
by Michelle Kaske and Martin Z Braun
September 14, 2016 — 2:00 AM PDT Updated on September 14, 2016 — 11:16 AM PDT
Following a weak July, companies and municipalities were ready to dip their toes back in the markets for stocks and bonds last month, judging by the number of requests for unique securities codes known as CUSIP numbers that are used to identify securities.
U.S. and Canadian companies, for example, asked for 12% more CUSIPs in August than in July, although through August the requests were down 8.6% from the same period last year, according to a report from CUSIP Global Services, which administers the system.
Municipal bond requests were up 7% for the month and are up 3.4% year to date through August. CUSIPs are issued to help facilitate ordering, trading and clearing, and are required by exchanges for the listing of most public and private securities.
“We did see a slower issuance after Brexit,” said Gerard Faulkner, director of operations for CUSIP Global Services, in an interview. Issuance is often softer in the beginning of the year and picks up as the months progress, but there is no hard and fast rule. “It’s hard to say if there’s always a pattern or trend,” he said.
Companies and municipalities are sensitive to interest-rate fluctuations, Mr. Faulkner said, particularly in the bond markets.
“If market rates are coming down, we do see an uptick in corporate bond issuance,” he said.
Bond issuers often act when market sentiment is strongly predicting a Federal Reserve move at its next meeting.
Among state bond issuers, Texas is leading the way with 1,414 new CUSIP requests this year, followed by New York and California with 1,093 and 836, respectively.
“Based on the August data, we expect to see a sustained pace of new security issuance through the next several months,” Mr. Faulkner said in a statement that accompanied the report.
The U.S. market for initial public offerings has been lackluster this year, but August indicates that activity may pick up. Domestic corporate equity CUSIP orders soared to 1,078 last month, the highest monthly tally since April 2015, CGS said.
CUSIP stands for Committee on Uniform Security Identification Procedures.
THE WALL STREET JOURNAL
By MAXWELL MURPHY
Sep 14, 2016 7:10 am ET
GASB Chair David A. Vaudt recently announced the appointment of a consultative group to assist with the Board’s development of implementation guidance relating to the accounting and financial reporting standards for other postemployment benefits (OPEB). The members of the consultative group are:
ABOUT THE PROJECT
The implementation guidance developed in this GASB project will address the standards contained in Statement No. 74, Financial Reporting for Postemployment Benefit Plans Other Than Pension Plans; Statement No. 75, Accounting and Financial Reporting for Postemployment Benefits Other Than Pensions; and related pronouncements. The GASB expects to issue two drafts for public comment—one containing proposed implementation guidance for OPEB plans and governments applying Statement 74 (fourth quarter of 2016) and the other proposing implementation guidance for governments applying Statement 75 (third quarter of 2017).
WHAT DO CONSULTATIVE GROUPS DO?
The GASB assembles consultative groups at the discretion of the GASB Chair for projects expected to lead to implementation guidance. Consultative groups serve as a sounding board, providing suggestions and feedback to the GASB staff as materials are developed. As part of this process, consultative group members review drafts of materials prepared by GASB staff, commenting as appropriate.
HOW ARE PARTICIPANTS SELECTED?
Consultative groups are officially appointed by the GASB Chair after consultation with the other GASB members and GASB staff. Consultative group members typically have a particular expertise or experience with the standards being addressed and also are capable of articulating the views of other, similar constituents.
Members primarily are identified from the GASB’s database of stakeholders, including persons who have indicated a willingness to volunteer for a consultative group. In general, the GASB attempts to maintain an appropriate balance of financial statement preparers, auditors, and users on each consultative group. However, consultative groups related to the development of implementation guides generally are composed primarily of preparers and auditors because they are consulting on relatively technical accounting matters. Consultative groups for projects related to postemployment benefits also include actuaries and employee benefit consultants.
Within each group, the GASB seeks to include a variety of types of stakeholders, such as finance officers from governments, as well as employee retirement systems, and auditors in government and private practice. The GASB also tries to balance other factors that may be relevant, such as governments of various sizes and from geographic areas of the country.
Brief Overview of Green Bonds
Green Bonds raise funds for new and existing projects with environmental benefits. They are similar to mainstream bonds with the difference residing essentially in a defined use of proceeds for specific green projects. From a credit perspective, Green Bonds are indistinguishable from other bonds. Operationally, Green Bonds largely function as conventional debt instruments. They are risk-weighted and credit rated in the usual way, based on the creditworthiness of the issuer, and they are generally listed, traded and regulated in the same way as other bonds in the international bond markets. Issuers and the dealers/managers expect pricing and transaction costs to be similar to the issuer’s regular bonds.
However, there are a number of advantages to issuing a Green Bond as opposed to a regular corporate bond. From the issuer’s perspective, a Green Bond (i) results in the diversification of its investor pool (e.g. greater numbers of asset managers and insurance or pension funds), and (ii) contributes to ‘green’ investor relations and corporate social responsibility initiatives. From a dealer/manager’s perspective, Green Bonds can be marketed as premium products to their clients as many investors are required to invest in products such as Green Bonds in order to meet sustainability guidelines or criteria in their investment strategies.
Green Bond Market
The Green Bond market accounted for US$800m of issuance in 2007, but has expanded significantly every year since then. Moody’s reported in February 2016 that Green Bond issuance for 2016 could exceed US$50bn2.
The Green Bond Principles3
In order to standardise Green Bonds, the Green Bond Principles (“GBP”), the first set of principles for verifying the credentials of Green Bonds, were launched in 2014 with the latest iteration published in June 2016. The GBP are voluntary guidelines that recommend transparency and disclosure and promote integrity in the development of the Green Bond market by clarifying the approach for issuance of a Green Bond. The GBP: (i) provide issuers guidance on the key components involved in launching a Green Bond; (ii) aid investors by ensuring availability of information necessary to evaluate the environmental impact of their Green Bond investments; and (iii) assist dealers/managers by moving the market towards standard disclosure which will facilitate transactions.
As there is no standard definition of what constitutes a ‘Green Bond’, the ‘Use of Proceeds’ section of a typical Green Bond Prospectus plays a key role in allowing investors to assess whether or not a given bond is “green enough” for them. The GBP reflect this, with disclosure of use of proceeds being central to the GBP. The GBP are not, however, prescriptive as to the form such disclosure should take. As a practical matter this means that an issuer will designate a “green” use of proceeds in the prospectus or other issuing documentation and then provide summarised information about the green uses, reporting and second party opinions (if any). Typically in a basic Green Bond, the use of proceeds, reporting and second party opinions do not form part of the terms and conditions of the Green Bond and do not create specific contractual obligations. However, they typically form part of the disclosure documents or are referred to in the disclosure documents.
Types of Green Bonds
The GBP identify four types of Green Bonds (additional types may emerge as the market develops):
Green Use of Proceeds Bond – a standard debt obligation for which the proceeds are moved to a segregated account or otherwise tracked by the issuer and attested to by a formal internal process that will be linked to the issuer’s lending and investment operations for projects. The vast majority of Green Bonds currently fall within this category.
Green Use of Proceeds Revenue Bond – a debt obligation in which the credit exposure in the bond is linked to the pledged cash flows of the revenue streams, fees, taxes etc., and the proceeds of the bond are used to fund related or unrelated green project(s) such as a utility provider issuing a bond backed by fees on electricity bills.
Green Project Bond – this is a project bond for a single or multiple Green Project(s) for which the investor has direct exposure to the risk of the project(s) with or without potential recourse to the issuer.
Green Securitised Bond – a bond collateralised by one or more specific projects, including covered bonds, ABS, and other structures. The first source of repayment is generally the cash flows of the assets. This type of bond covers, for example, asset-backed securitisations of rooftop solar PV.
Investor Appetite
The initial demand in the Green Bond market was largely driven by environmentally and socially responsible investors and this segment of the market has continued to grow (e.g. dedicated Green Investment Funds are developing rapidly). However, the market has quickly become mainstream with institutional investors and Green Bonds are developing into their own asset class. With the growth in diversity of issuer type and structure, the investor base for the Green Bond product has expanded to include more pension funds, insurance companies, asset managers, and retail investors. For their investors, Use of Proceeds Green Bonds are fixed income products that meet their underlying financial requirements, but which in addition enable them to show support for initiatives they deem to be important global priorities.
For all categories of investors, providing certainty and transparency on the use of proceeds and investments are, and will continue to be, important requirements. Green Bonds are part of a wider trend toward increased focus on social and environmental responsibility among companies and financial institutions. This trend is strongly encouraged by governments, public and other regulatory authorities, NGOs and even the community at large.
Recent Developments in the Green Bond Market
The GBP provide a minimum standard of process guidelines that recommend transparency and disclosure in the Green Bond market. As a result, the environmental undertakings of Green Bonds issuers are only partially reflected in transaction documentation. A microcosm has developed around the GBP in support of the Green Bond market that involves standard providers, certifiers and assurance providers (including accountancy firms, ESG analysts and academics). Some markets and jurisdictions have begun to integrate elements of the voluntary GBP guidelines into domestic Green Bond regulations and mandatory market criteria. In many jurisdictions adopting mandatory regimes, the GBP are the minimum starting point to which additional mandatory requirements are added. The regulator in these regimes takes a more active role in setting out: (i) rules for listing Green Bonds; (ii) the liability and covenant requirements; and (iii) the Green Bond catalogue of sectors and projects which define “green” for that market.
There has been a difference in the approach to the development of Green Bond markets in different jurisdictions. They are roughly split into those markets which, for the time being, rely on a voluntary approach to criteria and reporting and those which have implemented codified criteria and/or enshrined it in legislation. There is some market debate on the need: (i) to provide greater clarity on what a Green Bond is and what distinguishes it from regular bonds; (ii) for independent certification; (iii) for green catalogues and definitions; and (iv) for green covenants and liabilities. While standardisation of disclosure will support credibility and provide criteria for independent validation in the Green Bond market, a balance has to be struck between enhancement and over-regulation. It is important nonetheless to be aware of regional differences in the developing Green Bond market.
In terms of recent market trends, we have noticed an increase in the demand for specific products, including both investment grade and high-yield corporate Green Bonds, bespoke structured deals such as project bonds and securitisations and nationally driven products (e.g. Pfandbriefe, Schuldscheine and green Sukuk). There is increased interest from emerging market issuers in developing Green Bond frameworks, for example in India, China and Mexico and we are seeing prominent global stock exchanges dedicating separate platforms to Green Bonds.
Considerations for Green Transactions
We have worked closely with a number of issuers, dealers/managers, financial intermediaries and trade bodies in the Green Finance sector and our considerable experience in this field means we are well placed to help structure your green transaction and advise you on green requirements and market expectations. These are some of the key points you will need to consider including in your Green Bond:
White & Case
by Cenzi Gargaro, Gavin McLean, Karsten Wöckener, Tallat Hussain
30 Aug 2016
White & Case is an international law firm that serves companies, governments and financial institutions. The global presence of White & Case gives us both an opportunity and a responsibility to provide legal counsel and assistance through our social responsibility programme and green initiatives.
Footnotes
1 The vast majority of which are in the area of renewable energy and energy efficiency
2 www.moodys.com/research/Moodys-Green-bond-issuance-could-exceed-50-billion-in-2016–PR_343234
3 See the latest iteration of the GBP at www.icmagroup.org/Regulatory-Policy-and-Market-Practice/green-bonds/
Mindy Hauman, a Professional Support Lawyer at White & Case, assisted in the development of this publication.
This publication is provided for your convenience and does not constitute legal advice. This publication is protected by copyright.
© 2016 White & Case LLP
They badly need to improve their ability to generate investment returns. A Canadian province’s initiative looks like a model worth studying.
For all of the angst about the burden of funding public employees’ pension funds on state and local government budgets — and on the public workers who contribute part of their paychecks to their retirement funds — the most critical factor in the equation is the funds’ ability to achieve their investment-return targets. The money the funds earn on investments pays, on average, more than 60 cents of every dollar that is disbursed to retirees.
But the news is not good on the investment front. According to the Wilshire TUCS performance tracking service, median returns in fiscal years 2014 and 2015 were 3.43 percent and 1.07 percent, respectively — nowhere close to the sector’s average assumed rate of return of 7.5 percent. And experts say that it will be even harder for public pensions to make money in stocks and bonds over the coming decades.
Yet efforts to increase the efficiency and effectiveness of investment-management practices for retirement assets, such as the Investment Modernization and Cost Reduction Act proposed by the Oregon State Treasurer’s Office or the Bloomberg Liu initiative for the New York City Retirement System, have met with great resistance.
One modernization approach in particular, pooling assets to invest on a collective basis, holds a lot of promise. But only a handful of governments have moved to pool assets to one degree or another. Most pooling proposals, such as combining the Chicago and Illinois teachers’ retirement systems or Pennsylvania’s attempt to combine its 3,200 local pension plans, have involved consolidation or mergers that would mean giving up control of the assets. This has been a non-starter for pension trustees and board members.
But a new pooled-asset entity just launched in Canada could provide a model for U.S. public pensions funds to move forward, not only in protecting retirement systems’ long-term sustainability but also in increasing their ability to compete in the global financial markets.
This $38 billon pooled platform, the Investment Management Corporation of Ontario (IMCO), is organized as a nonprofit corporation, and it provides investment management services to pension funds at cost. Seeded with assets from the Ontario Pension Board and another public agency, IMCO enables pension funds to enhance returns by lowering costs and leveraging scale while retaining control of their assets. Remarkably, pension funds join IMCO as members, on a voluntary basis, and elect board members from their own ranks. What’s more, it hasn’t cost Canada’s national government a dime.
Ontario’s initiative offers encouragement to U.S. policymakers and researchers who have recognized the benefits of asset pooling. A 2010 Government Accountability Office study found that pooling pension assets could achieve economies of scale and reduce the investment fees paid to outsourced managers. As the study suggested, that could alleviate some of the budgetary pressures on states and municipalities due to unfunded pension obligations. The GAO study cited the mandate of the Massachusetts Pension Reserves Investment Trust Fund “to reduce the state’s significant unfunded liability and to assist participating local retirement systems in meeting their future pension obligations.”
State investment boards chartMassachusetts’ investment fund is one of 15 state pooled-asset structures, which are commonly called state investment boards and often are responsible for managing several different types of funds in addition to pensions. The North Dakota State Investment Board, for example, invests the assets of the state’s sovereign wealth fund, funded by tax revenues from oil extraction and production, as well as the assets of two pension funds for public employees and teachers. As the table here shows, 12 of the 15 state investment boards already oversee pooled public pension funds.
Ontario’s approach takes the advantages of the asset pooling already being realized by the U.S. state investment boards to the next level by introducing a cost-recovery model designed to end pension funds impoverishing reliance on money managers and consultants.
American policymakers interested in ensuring the long-term sustainability of our public-sector employee retirement systems might look at what the Canadian province has done. As healthy investment returns prove tougher than ever to come by, it’s hard to see an argument for failing to modernize our struggling retirement systems’ organizational structures as a step toward maximizing their ability to make money for the benefit of retirees and taxpayers alike.
GOVERNING.COM
BY JILL EICHER | SEPTEMBER 8, 2016
If you’re an investor that follows the stock or bond markets with any diligence, you’ve surely come across some headline with a dire prediction screaming something like “stock valuations are just like before the crash of 1929!” or similar such parallels. It grabs us because it preys on the intrinsic fear of uncertainty that all investors face. Cognitively, we know it is hyperbole, but emotionally we feel a little bit of nervous twinge because, well, who knows? This time they just might be right. After all, isn’t there a pithy maxim that tells us that “those who do not remember the past are condemned to repeat it?”
This year, the headlines for municipal bonds are anything but dire. In fact, it’s been quite the opposite–everyone is predicting a great year for munis. The market is up around 4.50% year-to-date (source: Barclays Municipal Bond Index). Intermediate and long municipal bond rates are now at multi-generational lows. Thomson Reuters’ bellwether Municipal Market Data (“MMD”) benchmark curve has the 10-year and 30-year AAA yields hovering in the 1.40% and 2.15% range, respectively.
Municipalities and public authorities alike are taking advantage of the low interest rate environment to refund their higher yielding debt. As data from The Bond Buyer shows, there are more refundings than there are bonds issued for new projects. Investors getting their money back from refunded bonds are finding fewer bonds to reinvest in. This supply-demand imbalance is further fueling the market’s gains.
The rising tide is lifting all boats. Mutual funds are prospering, finding their assets under management up by more than $50 billion, enjoying 11 uninterrupted months of positive flows since October 2015 (source: Investment Company Institute). Municipal ETFs have enjoyed similar positive flows during the same period, netting $5.7 billion. Money is also flowing into separately managed accounts. Cerulli Associates reported that flows into municipal SMAs were up 33.9% in 2015. With no signs of these SMA flows abating, 2016 could well become the fifth consecutive year of asset growth nearly making or exceeding 30%. By that estimate, the top SMA tax-exempt bond managers could see upwards of $45 billion added to their AUM by year end.
There are even flows coming into the market from so-called ‘non-traditional’ buyers. Given negative rates in Europe, foreign buyers are putting money to work in municipals so as to enjoy the positive risk adjusted rates. It’s unclear what the split is between taxable and tax-exempt buy-in from the internationals, but there is 100% agreement that it’s coming in.
Not only are rates lower, credit spreads are tighter. The spread in yield between AAA general obligation bonds and A hospital bonds is about 57 basis points. At the start of 2014, the spread was 125 (source: MMD Thomson Reuters). It seems that, with all that money to put to work, investors are more open-minded about expanding their credit parameters.
I hate to be a ‘Debbie Downer’ in the midst of all this ebullience, but I have in mind another pithy maxim, this one from Shakespeare: “What’s past is prologue” (The Tempest, Act 2, Scene 1). When these conditions occurred previously—the large flows, the non-traditional buyers, the eschewing of credit standards—it never ended well, as is detailed below and in the charts.
An event occurs, usually tied to rates, which suddenly changes everyone’s perspective. Money starts flowing out as fast as it flowed in. The non-traditional buyer who had been taking advantage of the arbitrage, gets jittery or finds better opportunities in other markets. The individual investor usually just panics and sells. As investors large and small rush to the exit en masse, they quickly discover the persistent liquidity problem the municipal bond market has when faced with large outflows. Prices back-up fast in a volatile reaction.
The past here is really not that far in the past and the parallels are striking. Think back to the time period from September 2011 to the end of 2012. For 15 consecutive months, mutual fund investors poured in nearly $65 billion into the market. The trend culminated in January 2013 when investors bought an astonishing $7.1 billion of municipal bond mutual fund shares. It was the largest single month of inflows since September 2009 and would prove to be the third largest inflow over the last ten years.
Then in May 2013, Federal Reserve Chairman Ben Bernanke made what he thought was a fairly innocuous announcement regarding tapering off the Fed’s quantitative easing program. Fearing rates were about to rise, nothing short of panic ensued. Over the next few weeks, investors pulled out nearly $65 billion from the market (see When Bonds Turn Negative, Keep Your Perspective). Outflows exceeded both the Credit Crisis of 2008 and the Meredith Whitney-caused blow-out in 2011—two other recent examples when the market lost its collective reason.
The whole episode was later given the cutesy moniker of “Taper Tantrum” but it was anything but cutesy. In a few short weeks, investors lost billions of dollars of net worth in their municipal bond holdings. From the beginning of May 2013 to mid-September. Thomson Reuters’ MMD AAA 10 year yield spiked from 1.66% to over 2.80%—a nearly 115 basis point give up. The 30 year AAA yield rose from 2.79% to just shy of 4.40% over the same time, a 160 basis point roll-back.
Look, I know it’s not 2013 all over again. Yes, the parallels are there, but the circumstances are different, the facts are different, the markets are different—there are a host of reasons things aren’t ‘just like’ the prior period of disaster. Recall that other pithy maxim: “predictions are difficult—particularly about the future?”
Yet something lingers in the back of my mind. The particulars today may indeed be very different, the circumstances completely divergent—but the market’s reaction to a trigger event that precedes a crisis hasn’t changed. We don’t forget history, but we don’t necessarily learn from it either. In the heat of the moment, people are still people and people will still panic and act irrationally. An event will occur and, if history is any guide, it won’t be one anyone is anticipating. Today’s bull market in municipals will face a crisis in the months ahead. Flows will reverse and the exits will clog. When that happens, as the nearly ubiquitous saying these days goes, “Keep calm and carry on.”
Barron’s
Sep 7, 2016
by Barnet Sherman, Contributor
Barnet Sherman has managed money for and advised to mutual funds, high net worth clients, consultants and insurance companies on successful investment strategies in the municipal bond market.
WASHINGTON — A bill introduced in the Senate by Republicans would put Indian tribal governments more on a par with state and local governments for bond financings, giving them better access to capital to support infrastructure and local economic development.
The Indian Community Economic Enhancement Act of 2016 (S. 3234), introduced this summer by Sen. John Barrasso, R-Wyo., chairman of the Senate Committee on Indian Affairs, and Sen. John McCain, R-Ariz., would create an Indian Economic Development Fund to support the Bureau of Indian Affairs’ loan guarantee and the Community Development Financial Institutions bond guarantee program for Indian tribal communities.
The Senate Committee on Indian Affairs is scheduled to hold a hearing on the bill on Wednesday.
“Accessing capital is paramount for economic development in tribal communities,” Barrasso said. “This bill will break down existing barriers for growth, support loan and bond guarantee programs … and increase opportunities for tribal members.”
In a joint release, the Senators said the legislation was based on input they had received from Indian tribes and businesses. The bill would amend several pieces of existing legislation, including: the Native American Business Development, Trade Promotion, and Tourism Act of 2000; the Native American Programs Act of 1974; the Indian Trader Act; and the Buy Indian Act. The Republican Senators said the bill would also spur tribally owned businesses by improving and expanding on these current laws.
“Many Indian reservations across my home state of Arizona and the western United States continue to struggle with high unemployment rates and few business opportunities,” McCain said. “We must do more to change this.”
Kathleen Nilles, a partner at Holland & Knight in Washington, said the bill is “trying to do a lot of different things,” but added the effort to make the loan guarantee program more effective could be positive for tribal governments.
“One of the biggest problems for tribes in getting tax-exempt financing is just establishing to a regular lender their credit worthiness,” Nilles said. “Loan guarantees are really good for struggling tribal governments. They can result in getting a loan versus not.”
An area of the bill Nilles said struck her was a provision that states, “for purposes of financing and economic or community development, the essential governmental functions of an Indian tribe shall be considered to include any function that may be performed or financed by a state or unit of local government with general taxing authority.”
Indian tribal governments have long called for a repeal of tax law restrictions that limit them to only issuing governmental bonds if the proceeds are used for “essential governmental functions” such as schools or roads. Unlike state and local governments, tribes cannot issue private activity bonds. The vague nature and implicit reference to repealing the essential governmental function in the bill does raise additional questions, Nilles said.
“I’m somewhat skeptical that it would be effective since it overrides a tax code provision without even citing it,” Nilles said. “I’m wondering if it would really be that effective because it says for purposes of financing and economic or community development, yet doesn’t even mention tax-exempt financing.”
Barrasso and McCain’s bill, introduced on July 14 and referred to the Senate Committee on Indian Affairs, would establish an Indian Economic Development Fund that would allow Indian tribes to deposit funds beginning one year after the enactment of the measure.
Funding would be allocated beginning two years after the enactment of the act by the Secretary of the Treasury and administered through the Secretary of the Interior, according to the bill.
For each fiscal year, the Assistant Secretary for Indian Affairs would provide up to either $7.5 million or 40% of fund amounts in credit subsidies to the loan guarantee program of the Bureau of Indian Affairs under the Indian Financing Act of 1974.
No more than 5% of the fund can be used for administrative purposes each fiscal year. A reserve fund would also be created within the fund.
Nilles called the fund an “interesting” concept because of the access it allows tribal governments in depositing their own funds to an account.
“Tribes have gaming money, investment income on holdings or excess cash they could put into this fund and it could be used to support financing for other Indian tribes,” Nilles said. “It sounds like a really novel idea.”
In a statement put in the Congressional Record in July, Barrasso said remote locations and a lack of infrastructure are just two of the problems affecting the quality of life for tribal communities as well as the ability to build “strong sustainable economies.”
“Indian tribes could engage in more cohesive community development and infrastructure building,” Barrasso said. “Federal bureaucracy is diminished, thereby reducing the costs of economic development.”
The Barrasso bill follows the bipartisan Tribal Tax and Investment Reform Act of 2016 (H.R. 4943) introduced by Rep. Ron Kind, D-Wis., in April, which would remove the special status for tribal government and establish a volume cap for their tax-exempt bonds. That bill, which also would effectively place tribal governments more on par with state and local governments under the federal tax law, is currently before the House Education and the Workforce Committee.
Under The American Recovery and Reinvestment Act passed in 2009, Tribal Economic Development (TED) bonds were created to ease restrictions on tribes’ abilities to issue bonds.
Although TED bonds are not subject to the “essential governmental function” requirement, many tribes are hesitant to access them because they cannot be used for projects on trust land. The Kind bill would remove the location restriction that deters many tribes from utilizing TED bonds.
In August, the Internal Revenue Service published a notice saying the volume cap limit for TED bonds is $191.51 million and the amount of available cap is $957.54 million.
The Bond Buyer
By Evan Fallor
September 6, 2016
The Congressional Municipal Finance Caucus has recently launched its website.
NABL members should check the list of members of the Municipal Finance Caucus. If your representative is already a member of the caucus, contact them and thank them for joining. If your representative is not a member, contact them and ask them to join.
The website also includes news related to the caucus and additional resources, including letters from stakeholders, letters to house leadership and testimony before the House Ways and Means Tax Policy subcommittee.
The caucus’s website can be found here.
Tax-increment financing began in 1952 in California as a way to jump-start development in blighted areas.
Since then it has spread to nearly every state. Typically new property tax revenue generated by development in a TIF district is pledged to pay for public infrastructure within the district. Laws in some states also allow sales tax to be diverted and some permit TIF funds to be spent on private development costs.
New TIF bond issues in 2015 totaled nearly $700 million, according to data analyzed by Elise Lomel of the financial advisory firm PFM Group in Atlanta. That total, which excludes refinancings, was the highest yearly total since 2006, excluding California, which largely exited the TIF sector by 2012. Not all TIF projects involve the issuance of debt.
However, the numbers have bounced around in recent years, and the total in the first half of 2016 came to just $77 million, her analysis found. Counting California, the peak for non-refinancing TIF bonds since 2000 occurred in 2006, at about $3 billion.
U.S. property values began falling in late 2006 as the real estate bubble burst. That eventually led to declines in property tax receipts, sometimes below levels needed to cover debt service.
“Certainly some projects failed, or they had to be restructured or refinanced, but really what happened is nothing new could happen,” said Toby Rittner, chief executive of the Council of Development Finance Agencies. He said use of the tool “really took a back seat.”
Compared with a decade ago, “there’s absolutely more scrutiny” of TIF proposals by both the public and private sectors, he said. He estimates no more than 30% of local governments still back TIF bonds, a common practice 15 years ago.
THE WALL STREET JOURNAL
By SCOTT CALVERT
Sept. 6, 2016 2:37 p.m. ET
Write to Scott Calvert at [email protected]
Total unfunded state other postemployment (OPEB) liabilities have increased, according to S&P Global Ratings’ latest survey of U.S. states. For states that have completed new OPEB actuarial studies since our last survey (which used 2013 or prior studies), total liabilities increased $59.4 billion, or 12% over a span of two years. This reverses a trend of stable to declining liabilities found in our 2014 and 2013 surveys. However, looking at recent growth in total liabilities alone would ignore that many states have taken measures to curb their liabilities, with 17 of the 41 states reporting new data showing a decline in liabilities. Also, several states, such as Alaska, have made significant contributions or changes to plans yet to be reflected in new actuarial data. Nevertheless, the growth in total state OPEB liabilities underscores the magnitude of liability growth states can experience over a short period of time absent fully funding actuarially required contributions (ARC) or implementing reforms.
Many states have favored underfunding OPEB ARC as a trade-off to address more immediate rising costs amid a slow revenue growth environment, a practice that we do not view as sustainable. A trend of underfunding and potential changes to actuarial assumptions suggests that OPEB liabilities and annual costs will continue to rise. Given the lean margins we see across many states, fully funding ARC, or even growth in pay-as-you-go expenses, could tip states into budgetary imbalance. While we view efforts to better align OPEB funding with actuarial costs as favorable, increased payments might come at the cost of other areas of budget management.
Treatment of OPEB liabilities varies widely across states, and as such, our analysis studies a variety of ratios, plan offerings, and flexibility to adjust benefits. We also recognize that changes to plan offerings and increases in funding could mitigate OPEB challenges, noting that often OPEB reform efforts produce material improvement in key metrics only as a result of sustained commitment on the part of policymakers and sometimes over many years.
Overview
07-Sep-2016
Federal and state agencies have used two types of P3 agreements to transfer ownership or control of unneeded property to private developers but a range of challenges hinder their use, the U.S. Government Accountability Office (GAO) has found.
GAO was asked by the Senate Committee on Homeland Security and Government Affairs and one of its subcommittees to review how federal and state agencies have used P3s to dispose of or arrange for private management of excess properties.
The report focuses on two types of P3s: enhanced use leases, through which a private developer manages a government-owned property for an extended length of time, and swap exchanges, through which a private developer assumes ownership of government property in return for building a new asset or completing other construction for the public partner.
The report’s authors also examined negotiated sales agreements, in which a property sale is contingent on one of the partners meeting specific property-related requirements but private developers do not generally consider these types of agreements to be P3s.
GAO found that federal agencies have used P3s to deal with excess property fewer than 10 times per year, according to the General Services Administration (GSA), and states’ use of these types of agreements seems to be even lower. For example, none of the three states that were identified as potential negotiators of P3s for this purpose — Washington, Virginia and Texas — could recall recent examples of such agreements being finalized.
GAO identified several obstacles to using P3s to deal with excess government property. They range from a lack of private sector interest in underused properties that have not been well maintained or require massive environmental remediation to difficulty in assessing both the value of such property and the costs of developing or repairing it.
GAO also pointed out that GSA, which helps agencies to acquire and manage their buildings, needs to obtain experience and expertise in conducting P3s. For example, GSA’s inspector general has expressed concern over the agency’s lack of experience in negotiating P3 agreements in connection with GSA’s proposal to swap the FBI’s dilapidated Washington, D.C., headquarters to developers of a replacement building. P3 negotiations for a similar project, involving the potential swap of several federal buildings in the southwest portion of the city in exchange for construction of a new GSA building, fell through in February.
The need to obtain political support from policy-makers and the surrounding community for private development of public assets is another potential hurdle to using P3s to manage excess government property, noted the report’s authors.
Despite these obstacles, P3s could help governments to divest themselves of underused, superfluous or obsolete properties and transfer the responsibility of maintaining and operating historic buildings and infrastructure that may be needed in the future to private developers, GAO said in its report. The report notes that the National Aeronautics and Space Administration worked with GSA to enter into an up-to-96-year lease with a private developer to rehabilitate, develop new uses for, operate and maintain Moffett Federal Airfield and the historic Hangar One in Mountain View, Calif. The Department of Transportation also is working with GSA to swap unused property near the Volpe Natural Transportation Systems Center in Massachusetts to a private developer in exchange for construction of a new facility.
NCPPP
September 8, 2016
The issuance of U.S. municipal green bonds – bonds backing projects with positive environmental effects — is increasing, joining a trend in the broader market for similarly labeled debt instruments. S&P Global Ratings estimates the municipal market will see between $6.3 billion and $7.2 billion of green bonds in 2016 (see chart 1), a meaningful step up from $4.1 billion in 2015 and $2.4 billion in 2014. Our 2016 estimate is based on actual data through July from Climate Bonds Initiative (CBI) assuming issuance stays on pace and average par remains the same.
However, we believe the market for U.S. municipal green bonds could be significantly larger. A recent HSBC report conservatively identified $30.3 billion of municipal bonds issued from 2014 to 2016 that met its green standard, only $10.9 billion of which were actually labeled green by issuers. This suggests the potential for significant growth simply by a broader acceptance of this asset classification. The same HSBC report estimates that green labeled municipals represented about 8% of the total $118 billion in labeled green bonds issued globally since 2007.
Overview
Issuance of green labeled transactions in the corporate debt market may reach $15 billion this year while they are just beginning in the real estate sector (see “The Corporate Green Bond Market Fizzes As The Global Economy Decarbonizes,” published April 15, 2016 on RatingsDirect, and “New Shoots Emerging In Green Bond Market For Real Estate,” published Aug. 22, 2016). Globally, the market for green bonds is expected to expand significantly as signatories to the December 2016 Paris climate change agreement increase efforts to reduce carbon emissions (see “The Paris Agreement: A New Dawn for Tackling Climate Change, Or More Of The Same?,” published Jan. 18, 2016).
07-Sep-2016
Abstract
This brief provides a basic overview of evaluation designs to assist pay for success (PFS) stakeholders engaged in deal development. It focuses on comparison and its relation to various designs, and it presents key questions that PFS planners should address as they participate in evaluation design discussions. In PFS projects, strong evaluations are tasked with determining what happened, if the program caused these outcomes, and if outcome payments are triggered.
Read the full Brief.
The Urban Institute
Kelly Walsh, Rebecca TeKolste, Ben Holston, John Roman
September 7, 2016
Infrastructure managers are under pressure to increase their investment in the U.S. as American investors boost infrastructure exposure and the investment climate in Europe — the top region for infrastructure deals — becomes less hospitable.
Managers are in a tough spot. They have more capital than viable deals. At the end of the first quarter, infrastructure managers were sitting on a record $124 billion in unspent capital commitments, according to London-based alternative investment research firm Preqin.
At the same time, the U.K.’s vote to leave the European Union, combined with the upcoming referendum on the Italian government and elections in Germany and France, are starting to cause some infrastructure managers and investors to steer clear of Europe.
This makes the U.S.’s infrastructure need — estimated by the American Society of Civil Engineers to total $3.6 trillion by 2020 — a tempting target. But the much lower cost of municipal bond financing and the high political cost of privatizing publicly funded infrastructure has put the bulk of these potential projects beyond managers’ reach.
However, there are signs of change.
Both U.S. presidential candidates have plans to boost infrastructure investment. Democratic nominee Hillary Clinton’s proposal is to spend $275 billion over five years for infrastructure that would be funded through business tax reform. Some $250 billion would be direct public investment with the remainder going to fund a national infrastructure bank that would offer loans, loan guarantees and other forms of credit. The bank would expand the Build America Bonds program.
Republican nominee Donald J. Trump has proposed $800 million to $1 billion in infrastructure spending, which would be financed with government bonds.
What’s more, U.S. state and local governments are beginning to increase their use of public-private partnerships for everything from roads to courthouses.
And a new IRS regulation released in August makes it easier for infrastructure to be financed with a combination of municipal bonds and private investment.
Geopolitical uncertainty
Outside of public-private partnerships, infrastructure managers increasingly are investing in renewable energy as the U.S. moves away from coal and traditional energy sources. Regulatory changes are making renewable energy investments more attractive to investors.
“A lot of institutional investors today, because of uncertainty in Europe, don’t want to take the geopolitical risk that is happening there,” said Timothy C. Ng, chief investment officer of outsourced CIO firm Clearbrook Global Advisors LLC, New York. “If anything goes sideways, it will affect your projects and they won’t get done.”
So a lot of capital is flowing to the U.S. for infrastructure, as well as for real estate and private equity investment, Mr. Ng explained.
“There’s huge money here now,” Mr. Ng said.
And that is putting more pressure on managers to seek out deals in North America.
Europe is the top region for infrastructure investment. There were 266 deals in Europe in the first half of this year compared with 178 in North America, according to Preqin. The U.S. accounted for 140 of the North American transactions.
Investors typically like to invest their money at home first, said John Sweeney, vice president of New York-based placement agency Park Madison Partners LLC.
Institutional investors globally have an increased appetite for infrastructure, Mr. Sweeney said, because of its low volatility and risk profile.
“This creates a problem for infrastructure funds and infrastructure investors because as more capital is flowing into the sector, pricing is becoming more competitive,” Mr. Sweeney said. “And the deal flow was already not as robust as it should be considering there’s a lot of need in the U.S.”
For investors, the too-much-capital-for-too-few investments is a classic recipe for lower returns, increasing the burden on managers to find viable deal sources.
This overabundance of capital is a concern for officials at longtime infrastructure investor New Mexico Educational Retirement Board, Santa Fe, said Bob Jacksha, CIO of the $11.4 billion pension fund.
“We were one of the first, perhaps the first, U.S. public pension plans to have an active infrastructure program,” Mr. Jacksha said. New Mexico ERB has invested in infrastructure since 2008.
“We have seen the demand increase as other funds have joined us and as they have allocated more and more capital to the space,” he said.
A lot of that demand is for core assets, because of the perceived safety of that category, Mr. Jacksha said. So New Mexico ERB officials have been investing in projects that involve construction.
“We are now often investing in something other than core, as that has become expensive,” and in core greenfield projects, Mr. Jacksha said. “Some other investors may not classify these as core.”
The ERB also has invested in build-to-core projects — projects sold to core buyers after they’re built.
ERB has about 73% of its $413 million in infrastructure exposure — fair value plus unfunded commitments — in the U.S.
Move to U.S.
Infrastructure manager IFM Investors Pty. Ltd. plans to invest as equally as possible in the U.S. and Europe to maintain the diversification of its open-end fund, said Julio Garcia, head of infrastructure, North America, in the New York office. Some 55% of IFM’s global open-end fund portfolio is invested in the U.S., Mr. Garcia said.
In the past 18 months, IFM invested a combined $4 billion in two toll roads: the Indiana Toll Road and the Circuito Exterior Mexiquense in Mexico City. In May, IFM sold a stake in the Indiana Toll Road to the $307.2 billion California Public Employees’ Retirement System, Sacramento, and Allstate Corp.
Mr. Garcia sees a lot of opportunity in the U.S. in energy infrastructure — especially in the midstream space, the pipes that transport oil from source to refinery to market.
Wilson Magee, New York-based director of global real estate and infrastructure securities at Franklin Templeton (BEN) Institutional LLC, said he is seeing “interesting capital investment opportunities” in water and wastewater projects as municipalities need to upgrade their systems.
Franklin Templeton’s global infrastructure funds have 30% to 35% invested in the U.S.
Over time, Mr. Magee said he expects that airports, which are mostly publicly owned in the U.S., will switch to a model that includes private ownership. “The model elsewhere around the world is long-term concession contracts,” he said.
The first big airport project in the U.S. is a public-private partnership that includes finance, design, construction, operation and maintenance of New York City’s LaGuardia Airport Central Terminal B, with a lease term through 2050.
There are other airport public-private partnerships on the drawing board. Los Angeles World Airports, the city agency that operates the City of Los Angeles’ three airports, is considering a public-private partnership to finance a modernization program for Los Angeles International Airport that would include a 2.25-mile automated people mover.
In August, the Denver City Council approved continued negotiations with a consortium led by Ferrovial, a Spanish firm that runs London’s Heathrow Airport, for a partnership to upgrade one of its terminals.
“There is increased interest in P3 in the U.S. recently,” said Justine Kastan, an attorney in law firm Rutan & Tucker LLP’s Palo Alto, Calif., office who specializes in public-private partnership infrastructure investments.
In August, the IRS made regulatory changes that increase the length and flexibility of public-private partnerships, Ms. Kastan said.
But even before the IRS rule change, governmental interest in P3s had increased, she said.
“I think there is a growing national awareness that we have infrastructure needs that aren’t being met,” Ms. Kastan said.
PENSIONS & INVESTMENTS
BY ARLEEN JACOBIUS | SEPTEMBER 5, 2016
This article originally appeared in the September 5, 2016 print issue as, “Infrastructure managers feeling the heat”.
— Contact Arleen Jacobius at [email protected] | @Jacobius_PI
Bond insurers — companies that provide a money back guarantee to investors on bonds sold by municipalities — were one of the biggest casualties of the 2008 financial crisis. Governments liked to insure their bonds because it typically allowed them to sell the bond with the insurer’s higher credit rating. That let governments get a lower interest rate cost on the bonds, making it worth the insurance expense. But the insurers’ effectiveness was essentially obliterated when their own credit ratings were downgraded amid the 2008 crisis. A little over a decade ago, half of new bonds issued in the municipal market were insured. Today, just 6 percent are.
While they’re down, bond insurers are far from out.
In their monthly outlook, analysts Alan Schankel and Eric Kazatsky of Janney Montgomery Scott predict insurers are biding their time for a comeback. Some existing bond insurers have restructured since the crisis while a new one — Build America Mutual — has come on the scene.
Meanwhile, insurers have been decreasing their exposure to outstanding bonds as governments have not re-upped their insurance when refinancing old debt.
The Takeaway: Low-interest rates have driven down the need for bond insurance because even low-grade governments are getting historically low rates on their bonds. But Schankel and Kazatsky say that has also provided a window for insurers to regain their financial health after losing a lot of money in municipal bankruptcies. When rates rise, more governments will turn back to insurance.
“Bond insurance plays an important role for many municipal investors,” the authors wrote. “We expect that role to expand, along with market share, if not immediately, then in coming months and years.”
GOVERNING.COM
BY LIZ FARMER | SEPTEMBER 2, 2016
Municipal-bond buyers are sticking by their mutual-fund managers, even though the chance that many of them will beat the market is no better than a coin toss.
The broad shift into low-cost index funds, which have drawn cash away from those that buy and sell stocks and bonds in a quest for outsize returns, has largely stopped at the U.S. state and local securities market, a bastion of buy-and-hold investors looking for steady, tax-exempt income. And they’re not necessarily being rewarded for their loyalty: About 50 percent of the actively-managed funds lagged a Bloomberg benchmark over the past five years, according to Morningstar Inc. data on those holding debt maturing from 5 to 12 years.
“You have some entrenched ways of investing here,” said Chris Alwine, who oversees more than $167 billion in municipal-bond assets at Vanguard Group Inc., one of the biggest providers of index funds. “You had the belief that you couldn’t index it. That’s been thrown out.”
The traditional way of investing hasn’t gone with it. As cash flooded into municipals amid turmoil in global financial markets, actively run funds took in $48.7 billion in the 12 months through July — eight times more than those built to mimic the performance of an index, according to Morningstar. As a result, the managed investment vehicles had $653 billion of assets, compared with $27 billion held by their passive competitors.
That stands in contrast to other markets over the same time period. Souring on underperforming stock and taxable-bond managers, investors withdrew almost $380 billion and put $367 billion into index funds.
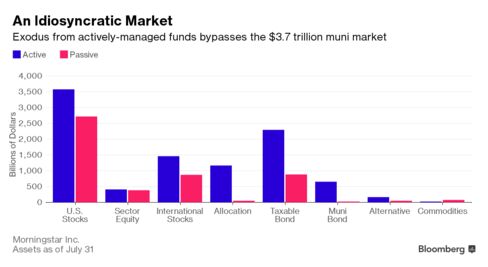
While passive municipal funds are growing at a faster rate than active ones — if only because they are relatively new and had far fewer assets to begin with — there are several reasons for their slow inroad to the $3.7 trillion market, said Karen Schenone, a San Francisco-based fixed-income strategist at BlackRock Inc.’s iShares unit, a provider of exchange-traded funds, or ETFs.
Some investors prefer buying bonds issued by their local governments or, if they live in high-tax states like New York and California, state-specific funds, instead of the nationally oriented ETFs. Investors also tend to focus on the indicated yield without considering total return, Schenone and Alwine said. Active funds generally yield more than ETFs.
“Most people think, ‘I want a manager who’s doing credit research, adjusting for duration, looking for blowups,” Schenone said.
That also leads to bigger fees, though not necessarily better returns. The average expense for actively-managed open-end municipal funds is 0.91 percent, compared with 0.3 percent for ETFs, according to Morningstar. Yet over the past five years, only about half of the intermediate active funds tracked by Morningstar returned more than the Bloomberg Barclays Intermediate Index as of June 30. The index returned 6.48 percent for the 1-year period, 4.7 percent over three-years return and 4.47 percent over five.
Awaiting Opportunity
JPMorgan Chase & Co.’s $4.5 billion Intermediate Tax Free Bond Fund was among the laggards. Chloe Etsekson, a spokeswoman for JPMorgan, said more than 90 percent of the fund’s holdings were in lower-yielding AAA and AA rated bonds, a higher percentage than the index.
“VSITX is a low volatility fund for asset allocators looking to use the municipal portion of their overall fixed income allocation as the anchor and source of cash when fixed income volatility spikes,” she said in an e-mail. “It is structured to provide liquidity when other opportunities arise.”
BlackRock’s $7.6 billion, iShares National Muni Bond ETF, the biggest municipal ETF, outperformed 77 percent and 72 percent of national intermediate active managers, over 1 and 3 years, according to data compiled by Bloomberg.
The rise of “robo advisers,” that use software programs to build portfolios could give a boost to ETFs, said Schenone. Web-based financial advisers Wealthfront Inc. and Betterment are using BlackRock’s as its only municipal holding, she said.
Vanguard, a pioneer in mutual fund indexing, has been a later entrant than BlackRock to passive municipal management. The world’s largest mutual fund manager started its first fund last year. Vanguard’s $460 million index fund pales in comparison to its actively managed $52 billion intermediate fund.
This year, the passive fund’s ETF shares returned 4.13 percent, beating the 3.92 percent posted by Vanguard’s actively managed intermediate fund.
“We believe fully in low-cost active but we also believe in indexing,” Alwine said. “Ultimately, it comes down to investor preferences.”
Bloomberg Business
by Martin Z Braun
August 29, 2016 — 2:00 AM PDT
Commerce Statler Development LLC — the company created by developer Mehrdad Moayedi to redevelop the landmark hotel — sold the tax increment finance grant the city of Dallas provided for the huge downtown deal.
The Statler developer used the almost $46.5 million in city incentives that helped fund the project to back a unique $26.5 million public bond offering, filings for the bond offerings show.
Securities firm Jefferies LLC underwrote the public debt offering, which was made through the Wisconsin Public Finance Authority.
The sale of the tax-free bonds allowed the Statler developer to access funds that wouldn’t be provided from the city’s tax increment financing for years.
“This is an innovative funding tool that will allow Dallas taxpayers to realize immediate benefit of the TIF money the city of Dallas is investing,” Moayedi said in a statement. “It made sense to us to be able to utilize funds now to enhance the quality of the project.
“We are thrilled with the outcome and the citizens of Dallas are going to be impressed with the new Statler.”
The City of Dallas approved the sale of the debt based on the future payout from the TIF district.
“The city had to approve this deal because the municipal bond issuer in Wisconsin required the consent of the municipality in which the project is located,” said Karl Zavitkovsky, who heads Dallas’ economic development office.
He said other developers may have have sold their incentives in the private markets without requiring the city’s consent.
“I’ve never heard of anyone doing this,” said John Crawford with the economic development group Downtown Dallas Inc. “It’s a very unique creative concept to getting your money on the front end.
“Typically it’s paid out over several years, and you have to wait your turn because of the amount of money available,” Crawford said. “It makes a lot of sense for the developer to do this and expedites the project and reduces the liability.”
The cost of the Statler redevelopment has grown to more than $221 million, according to the SEC filings.
The original budget for the ambitious project was estimated about $175 million in early 2014 when the Dallas City Council approved redevelopment plans for the landmark downtown building.
Opened 58 years ago as one of the country’s most modern hotels, the 19-story building on Commerce Street had been empty for a decade when construction work started to transform the building in a mixed-use development.
The current construction — which is scheduled to wrap up early next year — will remake the old Statler Hotel into 219 apartments, 150 hotel rooms, and retail and office space. Originally the project had been expected to open in late 2016.
To qualify for the $46.5 million in city economic incentives, the developers must have completed the Statler redo by October of next year and have invested a minimum of $120 million in the project, according to the prospectus for the bond offerings.
The massive redevelopment has been financed in part with an $85 million EB-5 loan and $51.2 million in bridge loans based on the value of tax credits promised on the project by the federal and state governments, according to details provided to the bond buyers.
Financial data provided for the Statler project indicates that the redevelopment will cost almost $150 million. There’s more than $63 million additionally in “soft costs” for the developer’s fee, architectural and engineering fees and other items.
New York-based bond rating firm Moody’s assigned a Baa3 rating to the bonds, which pay an interest rate of about 3.8 percent.
Investors who purchased the Statler bonds were warned that the project must be completed and meet all city requirements before the public incentives will be paid.
Developer Moayedi also warned bond investors of his ties to United Development Funding, a Grapevine-based investor and lender that is being investigated by federal prosecutors.
About 40 percent of Moayedi’s projects have previously been developed with UDF funding.
“UDF is not associated with funding” of the Statler, according to the information supplied to bondholders.
The Statler developer said that it couldn’t predict what impact the federal investigation of UDF “may have on the developer or the developer’s ability to complete the project or continue funding the project.”
Other developers who have redone downtown historic buildings say they know of no other cases where the city economic incentives have been sold as a bond to investors.
It’s creative — it may set a trend,” said Larry Hamilton, whose firm has done more downtown historic building conversions than any other company. “What a great idea.”
The Dallas Morning News
By Steve Brown
Real Estate Editor
Published: 31 August 2016 12:52 PM
Updated: 01 September 2016 01:55 PM
Jenny Poree discusses how a provides a policy change by the US Department of Justice regarding federal prisons will negatively impact our rated prison portfolio and Ashley Ramchandani provides an update on higher education rating actions in Illinois.
Aug. 30, 2016
Fitch Ratings-New York-29 August 2016: The chances of a near-term improvement in funded ratios for many state-wide pension systems are remote, Fitch Ratings says, even as annual pension contributions made by state governments continue to rise. In particular, state systems that employ 30-year rolling amortization or similar methods to calculate their annual required contributions (ARC) are at greater risk of having pension sustainability problems over the long run.
Actual pension contributions have risen rapidly in recent years as governments have attempted to stem the erosion of their systems’ funded ratios and catch up with rising ARCs, the contribution benchmark calculated by actuaries as necessary to eliminate the unfunded pension liability over time. The average actual contribution in fiscal 2014 is roughly 89% greater than in 2008, the year the global financial crisis began, while the ARC has risen an average of 72% since then.
However, actual contributions remain inadequate relative to the ARC. Based on Fitch’s last state pension update, a little more than half of major state-wide systems received an annual contribution in fiscal 2014 at or above their ARC. The remaining systems received lower contributions. A shortfall in actual contributions, relative to the ARC, deprives a system of investable resources, increases its unfunded liability and elevates the future ARC that will be calculated at subsequent funding valuations.
Inadequate contributions relative to the ARC are not the only weak contribution practice. In many cases, a system’s ARC itself is a poor benchmark of contribution adequacy. The ARC is a product of multiple, separate assumptions reflecting the disparate policy priorities of each system. These priorities include cost stability, equity and certainty of achieving full funding. For many systems, progress in achieving full funding is sacrificed for short-term cost stability. This is particularly true for major systems employing 30-year rolling amortization or other amortization assumptions that create a similar outcome.
Under a 30-year rolling amortization, the ARC is an inadequate measure of contribution sufficiency because at each successive annual funding valuation the ARC is recalculated based on a new 30-year open period, much like refinancing a home mortgage loan year after year. The resulting ARC is likely to provide a higher degree of contribution stability at a lower cost than if it were calculated based on more conservative, alternative methods, such as a consistently fixed, closed-period amortization, various layered amortization approaches, or even a shorter rolling period, such as over 20-years.
For systems using a 30-year rolling amortization, the resulting ARC may too low to cover the cost of new benefits each year plus the accrued interest on the pre-existing unfunded liability — hence the unfunded liability can rise each year, even when the full ARC is paid and other assumptions are achieved. Many governments using 30-year rolling amortization while consistently paying their full ARC each year have still seen their funded ratios languish well below prerecession levels.
Implementation of GASB 67 and 68 standards, which created a new, parallel “accounting” valuation for financial reporting purposes, has not altered the challenges associated with weak pension funding practices. Although similar assumptions inform both funding and accounting valuations for the pension liability, the funding valuation remains how systems arrive at an ARC, the rough equivalent of the actuarially determined employer contribution (ADEC) under the new standards.
Given legal protections that limit the near-term positive impact of reforms and other trends affecting pensions, we expect liabilities will remain elevated and ARC increases to continue. Most governments have been able to absorb higher pension contributions, and Fitch expects this to remain the case, especially as past reforms begin to have an impact. In a smaller number of cases, pensions may result in downward rating pressure, particularly as past contribution shortfalls and limited reforms continue to drive the unfunded liability and ARC higher, reducing expenditure flexibility and straining operations.
Contact:
Douglas Offerman
Senior Director
US Public Finance
+1 212 908-0889
Rob Rowan
Senior Analyst
Fitch Wire
+1 212 908-9159
Media Relations: Elizabeth Fogerty, New York, Tel: +1 (212) 908 0526, Email: [email protected].
The above article originally appeared as a post on the Fitch Wire credit market commentary page. The original article can be accessed at www.fitchratings.com. All opinions expressed are those of Fitch Ratings.
ALL FITCH CREDIT RATINGS ARE SUBJECT TO CERTAIN LIMITATIONS AND DISCLAIMERS. PLEASE READ THESE LIMITATIONS AND DISCLAIMERS BY FOLLOWING THIS LINK: HTTP://FITCHRATINGS.COM/UNDERSTANDINGCREDITRATINGS. IN ADDITION, RATING DEFINITIONS AND THE TERMS OF USE OF SUCH RATINGS ARE AVAILABLE ON THE AGENCY’S PUBLIC WEBSITE ‘WWW.FITCHRATINGS.COM’. PUBLISHED RATINGS, CRITERIA AND METHODOLOGIES ARE AVAILABLE FROM THIS SITE AT ALL TIMES. FITCH’S CODE OF CONDUCT, CONFIDENTIALITY, CONFLICTS OF INTEREST, AFFILIATE FIREWALL, COMPLIANCE AND OTHER RELEVANT POLICIES AND PROCEDURES ARE ALSO AVAILABLE FROM THE ‘CODE OF CONDUCT’ SECTION OF THIS SITE. FITCH MAY HAVE PROVIDED ANOTHER PERMISSIBLE SERVICE TO THE RATED ENTITY OR ITS RELATED THIRD PARTIES. DETAILS OF THIS SERVICE FOR RATINGS FOR WHICH THE LEAD ANALYST IS BASED IN AN EU-REGISTERED ENTITY CAN BE FOUND ON THE ENTITY SUMMARY PAGE FOR THIS ISSUER ON THE FITCH WEBSITE.
Norwalk, CT, August 29, 2016 — The Governmental Accounting Standards Board (GASB) today proposed guidance that state and local governments would apply when extinguishing debt prior to its maturity. Specifically, the Exposure Draft, Certain Debt Extinguishment Issues, proposes guidance for transactions in which only existing resources are placed in a trust for the purpose of extinguishing debt.
Current GASB standards provide guidance on how to account for and report when the proceeds of refunding bonds are placed in a trust for the future repayment of outstanding debt. However, the standards do not apply when only existing resources (in other words, other than bond proceeds) are placed in a trust for the future repayment of outstanding debt. Consequently, governments could account for what is essentially the same transaction in two different ways.
The Exposure Draft proposes uniform accounting and financial reporting guidance for debt that is “defeased in substance,” regardless of the source of the resources that are placed in a trust.
“Whether you borrow the money to extinguish the debt or use cash you already have, the treatment ought to be the same because the economic substance of the transaction is the same,” said GASB Chair David A. Vaudt. “From a government’s perspective, the source of the money that is being used to refund debt should not matter as long as the requirements for in-substance defeasance are met.”
In this context, in-substance defeasance refers to a situation in which the debt remains outstanding but sufficient resources—in the form of essentially risk-free monetary assets—have been placed into an irrevocable trust to make payments on the debt when they come due. When debt is defeased in substance, the debt and the resources placed in trust are no longer reported in the financial statements. Governments are required, however, to disclose information in the notes to the financial statements about debt that has been defeased in substance.
The Exposure Draft also proposes guidance relating to prepaid insurance on debt that is extinguished and notes to the financial statements for certain defeased debt. One proposal would require disclosure if a government is not prohibited from subsequently exchanging the essentially risk-free monetary assets in the trust with monetary assets that are not essentially risk-free.
The Exposure Draft is available on the GASB website, www.gasb.org. Stakeholders are encouraged to review and provide comments by October 28, 2016.
The governor’s office for Illinois, a state with notoriously weak finances, this week issued a stark warning about what might happen if it reduced the assumed rate of return for its Teachers’ Retirement System.
“If the board were to approve a lower assumed rate of return taxpayers will be automatically and immediately on the hook for potentially hundreds of millions of dollars in higher taxes or reduced services,” the state’s senior adviser for revenue and pensions wrote in a memo.
Unlike corporate pensions, US public pensions discount their liabilities using the rate of return they expect to generate on their investments. Some experts complain that these rates have been set unrealistically high. Lower return expectations would push up the cost of liabilities on their balance sheet, and force Illinois to make higher contributions. If costs to the pension were to increase by $250m it would nearly equal an entire year’s appropriation for six universities.
Financial Times
Last updated: August 26, 2016 5:27 pm
Nicole Bullock in New York
Key Points
It’s that time of year when students wind down their summer breaks and start to turn their thoughts to school. Municipal bond investors may want to follow their lead.
Bonds issued by school districts—along with other highly rated general obligation bonds from cities and states and revenue bonds backed by essential services—can serve as the stable foundation of a municipal bond portfolio. School districts in most states tend to have high credit ratings, boasting A-level ratings or better. Why? One reason is that school district bonds in most states are backed by property taxes, which can be a stable and reliable revenue source. A strong property tax pledge can help support the credit quality of school district bonds, in our view.
FINANCIAL ADVISOR
AUGUST 24, 2016 • COOPER J. HOWARD AND ROB WILLIAMS
Property Assessed Clean Energy (PACE) financing can be a powerful tool for building owners. Financing an energy efficiency or renewable project in this manner enables the work to be done without immediate payment. The obligation is paid over a period of time – generally as long as 20 years – through an assessment on the property’s tax bill. If the building is sold, the obligation is assumed by the new owner.
It can be a win/win. The vendor gets the work and the home or business owner gets the upgrade. That work presumably lowers building expenses, increases performance and/or makes the structure more environmentally sound. PACE funding structures must be approved at the state and local jurisdictions.
Continue reading.
Energy Manager Today
By Carl Weinschenk
August 23, 2016
The Minnesota Supreme Court this week ruled that fees St. Paul was charging property owners for street maintenance amounted to a tax and therefore should be subject to the city’s constitutional limits on taxing authority.
The case was brought by two churches who argued they were asked to pay for a service that benefitted the public, not just the property owner. The fee applied to routine street services including street sweeping, snow plowing, streetlight maintenance and litter pick-up. It affects more than 81,000 St. Paul homes, churches, nonprofits, universities and businesses.
St. Paul’s city attorney framed the loss as a technical one, telling the Twin Cities Pioneer Press that “it’s not a question of if the city can collect assessments but how it goes about doing so.”
The Takeaway: This case is more than a technical debate. St. Paul is like many cities and counties across the country in that it’s seen an increasing share of its budgeted income come from fees rather than taxes in recent decades. Simply put, it’s easier to raise a fee — or create a new one — than it is to raise a tax.
It’s important to note that this ruling only immediately applies to St. Paul. But it could spark copycat suits in other municipalities. At a minimum, it might give municipalities pause when instituting a new fee — to consider whether they are actually charging for an individual service or a public good.
GOVERNING.COM
BY LIZ FARMER | AUGUST 26, 2016
The proposals could reshape several large U.S. cities for decades to come — if they pass.
Transit agencies in Atlanta, Detroit, Los Angeles and Seattle are appealing to voters this fall to fund new services that the cities hope could transform their metropolitan areas for decades to come.
By going to voters in a presidential election year, the agencies are betting that big turnouts will help their cause. But even though local transportation measures generally fare well at the ballot box, each of these particular metropolitan areas has had a tricky history with transit. In fact, just getting the proposals on the ballot took significant effort in Atlanta and Detroit, and opponents are already organizing to block the far-reaching efforts in Los Angeles and Seattle.
The ballot measures push for new rail lines, better bus service and more connections to destinations such as airports, universities, hospitals and job centers.
Here’s a rundown of each.
Going Regional (Finally) in Detroit
Voters in four Detroit-area counties will vote on whether to increase their property taxes by an average of $95 a year to vastly improve transit in the region. If approved, the proposal would cost $4.6 billion over 20 years.
The plan calls for building commuter rail between Detroit and Ann Arbor, adding four new bus rapid transit routes among major traffic arteries, creating bus routes that cross county borders and increasing regular bus service throughout the area. It also ensures that the region’s four existing transit providers integrate services to share a fare card and a common call center.
It would be a major development for Detroit, which, until 2012, was the only major metropolitan area without a regional transportation authority. Michigan lawmakers OK’d the authority in order to get federal funding for Detroit’s new streetcar line.
Warren Evans, the executive of Wayne County, which includes Detroit, praised the decision to put the tax hike and plan before the voters. That decision means “progress on an intractable problem that has dogged this region for 50 years,” he said.
“This is an important decision for the citizens of this region,” he added. “They will have to ask themselves a question: Should we join virtually every other urban area in the country in recognizing the importance of an efficient and effective public transportation system?”
Boosting Service in Atlanta
In another transit-starved area, Atlanta voters will decide whether to increase their sales taxes by 0.5 percent over 40 years to get better bus service, expanded rail routes and better incorporation of technology.
MARTA, Atlanta’s transit system, hasn’t specified exactly how the $2.4 billion raised would be spent. But its leaders have proposed a menu of possibilities that also includes circulator buses, new rail stations on MARTA’s existing subway lines and improvements to existing stations. The money would only come from within the city itself, not the rest of the three-county area MARTA now serves.
The vote in November, however, is complicated by the fact that the city council put another sales tax hike of 0.4 percent on the ballot for other transportation measures. That initiative would devote money to acquiring the remaining land to complete the so-called BeltLine, a 22-mile loop of parks, bicycle trails and other amenities around the city. In addition, it would pay for more bike trails, make roads more pedestrian- and bike-friendly, fix up sidewalks, and help coordinate traffic signals.
If both measures pass, it would raise Atlanta’s sales tax to 8.9 percent, far higher than it is in other counties in the metropolitan area.
Expanding Farther and Wider in Seattle
Seattle’s Sound Transit agency wants to double the size of its light rail network and expand its ability to reach the far-flung areas of Puget Sound. It’s asking voters to approve $54 billion in new funding over 25 years. The plan, known as ST3, would pay for seven light rail extensions, which would help grow the network from 54 miles to 116 miles; add commuter rail and bus rapid transit; and reach 37 new communities, bringing ridership up to 700,000 passengers a day.
All of that would cost a pretty penny, about $169 a year for an individual taxpayer or $326 annually for a typical household. It would be paid for through increases in property, sales and car-tab taxes.
Peter Rogoff, Sound Transit’s CEO and a former head of the Federal Transit Administration, said the ballot measure could change the nature of the Seattle-area transit agency. “Right now, we are a commuter bus operator with a single light rail line,” he told Progressive Railroading magazine. “The big transformation will be moving this from a light rail line to a true regional network.”
But opponents say the improvements would do little to alleviate congestion in the Seattle area. Even by Sound Transit’s own estimates, the agency would only provide 1 percent of trips in the region, according to the group Smarter Transit. “Today innovative ideas around ride sharing, driverless cars and bus rapid transit are being developed. But ST3 has little or none of these,” the group says on its website.
Doubling Down on Taxes in Los Angeles
Transportation planners in Los Angeles County want to build on previous wins at the ballot box. They’ll ask voters in November to make permanent a previous sales tax hike for transportation, plus add another half-cent sales tax hike to pay for both highway improvements and new transit projects. The tax increases would raise the cumulative sales tax in L.A. County to 9.5 percent.
The proposal, called Measure M, is expected to generate $860 million a year if it passes with the required two-thirds majority. It could be a close call. A similar measure in 2008 barely squeaked by with 67.2 percent of the vote, but a related bonding proposal fell just short in 2012. This year, Measure M will appear on a crowded ballot alongside 17 statewide ballot measures.
County supervisors voted 11-2 to put the put the proposal on the ballot, but many city officials, particularly in the southern part of the county, oppose it.
GOVERNING.COM
BY DANIEL C. VOCK | AUGUST 23, 2016
In addition to providing the financing, technical expertise and labor cities need to maintain and improve vital infrastructure projects, P3s can produce revenues that could keep municipal pension plans solvent, suggested a resident of one Florida city that is facing this dilemma.
A solid pension plan should be 80 percent to 90 percent funded but Sarasota’s general plan is only 71 percent funded and is projected to incur a $54 million unfunded liability in the years ahead, wrote Lewis Solomon, a professor emeritus at George Washington University Law School in an Aug. 8 Herald Tribune op-ed.
To keep its underfunded pension plan afloat, the city is reducing cost-of-living adjustments and other plan benefits and limiting the number of workers who can enroll. The city should instead consider investing the plan’s funds in a P3 project that can serve the dual purpose of producing good returns for the plan while rehabilitating Sarasota’s struggling water and wastewater system, Solomon suggested.
“Rather than these palliatives, Sarasota could monetize its water and sewer system by entering into a public-private partnership for these assets. By providing access to private capital, this approach would quickly help the municipality achieve the general plan’s 80 percent funding target and substantially lessen the millions in current, annual contributions to pay down the plan’s unfunded liabilities,” he wrote.
Robert Poole of the Reason Foundation recently made a similar suggestion, pointing out that pension funds looking for relatively safe investments would do well to consider buying into existing or “brownfield” infrastructure P3 projects than in new “greenfield” ones.
By leasing its water system — representing more than $100 million in water and sewer projects — to a private developer for 20 to 30 years, Sarasota could obtain private financing for and rehabilitation of 175 miles of water pipes and its deteriorating lift stations, Solomon estimated.
More than 2,000 communities use P3s to fund and conduct vital water-related infrastructure projects, Michael Deane, executive director of the National Association of Water Companies has noted.
One example is the Bayonne (N.J.) Municipal Utilities Authority, which leased its ailing water and wastewater system to Kohlberg Kravis Roberts and United Water in 2012 for 40 years, Solomon pointed out. Through the deal, the authority received $150 million from the developer, which also agreed to invest $107 million in the city’s water system and provide technical expertise to rehabilitate it.
“This infusion of capital was critically important to the city because it eliminated $130 million of existing debt and improved both the authority’s finances and Bayonne’s credit rating,” according to a June 10, 2015, article on two successful municipal water P3s published by the Wharton School at the University of Pennsylvania.
Although it is not yet common for pension plans in this country to invest in public infrastructure projects, interest is growing. For instance, the California Public Employees Retirement System announced recently its purchase of a 10 percent share — at least $330 million — of the company that operates and maintains the Indiana Toll Road.
Pension fund managers in Canada have figured this out. Several are invested in such projects internationally and the Trudeau government is encouraging them to do so domestically.
NCPPP
August 22, 2016
Geoff Buswick provides an overview of the MCDC initiative and Carol Spain discusses current economic factors impacting Pennsylvania local governments.
Aug. 23, 2016
America’s states and cities are finally seizing on record-low interest rates to finance needed work on roads, bridges and schools.
After borrowing costs tumbled worldwide as central banks sought to jump-start their economies, agencies from New York to California have sold about $272 billion of bonds this year and are funneling more into construction projects, instead of just paying off higher-cost debt. That’s put the municipal market on track to approach the record level of sales reached in 2010, when the federal government was seeking to hasten the nation’s recovery by footing some of the bills on debt issued for public works.
“That’s going to be the story for the year — rebuilding infrastructure,” said Mikhail Foux, head of municipal strategy in New York for underwriter Barclays Plc, which forecasts that issuance may reach $400 billion this year.
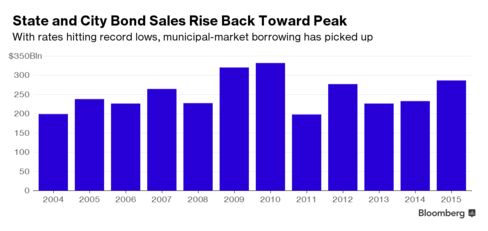
The spree shows how local U.S. agencies are benefiting from turbulence in global financial markets that’s kept the Federal Reserve from raising interest rates since its initial increase in December — a move that at the time spurred speculation states and cities were missing an opportunity. The need for such spending has been injected into the U.S. presidential campaign, with both Democrat Hillary Clinton and Republican rival Donald Trump promising hundreds of billions of dollars for the country’s fraying infrastructure.
While localities for years pocketed savings by refinancing, this year they’ve stepped up borrowing for planned public works — many of which were put on hold as officials struggled with budget shortfalls that persisted long after the recession ended in 2009. So-called new-money deals — which fund projects instead of paying off old debt — accounted for 40 percent of the sales through early August, compared with 35 percent for the same period last year, according to Bank of America Merrill Lynch.
The new issues this year included those for a terminal at New York’s LaGuardia Airport, improvements at Chicago’s schools and work on Texas’s roads. Next month, Alabama plans to offer $550 million of debt backed by highway funding it’s set to receive from the federal government, allowing it to begin work without waiting on Washington.
Irvine Ranch Water District, an agency serving 380,000 customers in California’s Orange County, this month issued its first new-money bonds since December 2010. The timing of its $117 million deal, some of which retired older securities, was driven partly by the market, said Rob Jacobson, the district’s treasurer. The proceeds are being used for a facility to treat waste-water remnants called biosolids, which are currently processed elsewhere.
“It turned out to be an excellent time,” Jacobson said. “The market is fantastic.”
The longest-maturing securities, which come due in March 2046, yielded 2.23 percent, 0.74 percentage point above benchmark munis. The 10-year securities yielded 1.29 percent, 0.64 percentage point less than top-rated bonds, data compiled by Bloomberg show.
The pace of new bond deals is expected to stay brisk. There were $16 billion scheduled over the next month, an increase from the $6.9 billion that were planned for 30 days out at the start of July, data compiled by Bloomberg show.
On Friday, Fed Chair Janet Yellen said the case for raising interest rates is getting stronger, and speculation has increased that the central bank will tighten monetary policy: the futures market predicts a 56 percent chance that rates will be increased in December, compared with the 45 percent odds given a month ago.
The increased supply hasn’t diminished the municipal market’s rally, which has driven yields — which move in the opposite direction as prices — to record lows. With negative rates in Japan and Germany, even the diminished payouts have been a draw to investors looking. U.S. state and local-government debt funds have taken in cash for almost a full straight year, according to Lipper US Fund Flows data.
Barclay’s Foux said more bonds may be on the way if either Trump or Clinton follow through on their promises to fix crumbling roads and bridges.
“It’s going to be a massive boost,” he said.
Bloomberg Business
by Romy Varghese
August 26, 2016 — 2:00 AM PDT Updated on August 26, 2016 — 7:24 AM PDT
Fitch Ratings-New York-19 August 2016: Maintenance problems that halted two of the US’s largest transit systems will likely spread to other systems unless funding needs are addressed and adequately managed, Fitch Ratings says, noting that long-term planning will help manage maintenance and capital requirements.
Although Washington Metropolitan Area Transit Authority’s (Metro) funding process has begun, Metro demonstrates that successful funding requires effective planning and oversight.
Following an accident in 2009, the National Transportation Safety Board recommended that Metro implement a series of costly safety improvements. In 2010, Metro began a $5 billion, six-year capital-improvement plan to address those recommendations and others. As of January 2016, the authority had spent approximately $3.7 billion of the capital plan. Despite the expenditures, safety issues remain due to lack of planning and oversight. Last month, Metro began a project that will last for the rest of the year and shut down some train lines for as long as 24 days at a time to address emergencies.
In June, Southeastern Pennsylvania Transportation Authority (SEPTA) removed one-third of its train fleet due to a defect. Last week, it announced a plan to bring some of the cars back into service on Aug. 21. The defect’s source appears to have been attributable to the manufacturer. However, SEPTA’s significant long-term capital improvement backlog could contribute to maintenance issues that may interrupt its service.
Between fiscal 2011 and 2014, SEPTA’s capital program funding fell to approximately $300 million per year on state funding cuts. In 2013, the authority estimated its repair backlog to be $5 billion, dwarfing the amount of the capital program. A rise in state funding is projected to nearly double the annual capital program by fiscal 2018. However, at that rate, the repair backlog will take many years to address, raising the likelihood of additional costly service disruptions.
The knock-on effects of the downtime to these systems will affect an increasingly large number of people and businesses. For many transit systems, increased demand has been rising as migration to US cities has increased. According to the US Census Bureau, the population of 19 of the 20 largest cities rose in 2015, while New York City saw the largest number of new residents. Reflecting the city’s growing population, the Metropolitan Transportation Authority, New York’s largest transit system, reported that it provided 1.7 billion annual rides in 2015 — the highest since 1948.
Contact:
Scott Zuchorski
Senior Director
Global Infrastructure & Project Finance
+1 212 908-0659
Michael Rinaldi
Senior Director
U.S. Public Finance
+1 212 908-0833
Rob Rowan
Senior Analyst
Fitch Wire
+1 212 908-9159
Media Relations: Elizabeth Fogerty, New York, Tel: +1 (212) 908 0526, Email: [email protected].
The above article originally appeared as a post on the Fitch Wire credit market commentary page. The original article can be accessed at www.fitchratings.com. All opinions expressed are those of Fitch Ratings.
ALL FITCH CREDIT RATINGS ARE SUBJECT TO CERTAIN LIMITATIONS AND DISCLAIMERS. PLEASE READ THESE LIMITATIONS AND DISCLAIMERS BY FOLLOWING THIS LINK: HTTP://FITCHRATINGS.COM/UNDERSTANDINGCREDITRATINGS. IN ADDITION, RATING DEFINITIONS AND THE TERMS OF USE OF SUCH RATINGS ARE AVAILABLE ON THE AGENCY’S PUBLIC WEBSITE ‘WWW.FITCHRATINGS.COM’. PUBLISHED RATINGS, CRITERIA AND METHODOLOGIES ARE AVAILABLE FROM THIS SITE AT ALL TIMES. FITCH’S CODE OF CONDUCT, CONFIDENTIALITY, CONFLICTS OF INTEREST, AFFILIATE FIREWALL, COMPLIANCE AND OTHER RELEVANT POLICIES AND PROCEDURES ARE ALSO AVAILABLE FROM THE ‘CODE OF CONDUCT’ SECTION OF THIS SITE. FITCH MAY HAVE PROVIDED ANOTHER PERMISSIBLE SERVICE TO THE RATED ENTITY OR ITS RELATED THIRD PARTIES. DETAILS OF THIS SERVICE FOR RATINGS FOR WHICH THE LEAD ANALYST IS BASED IN AN EU-REGISTERED ENTITY CAN BE FOUND ON THE ENTITY SUMMARY PAGE FOR THIS ISSUER ON THE FITCH WEBSITE.
NEW YORK — U.S. public universities are increasingly turning to public-private partnerships to develop student housing and other campus projects, sometimes using the structure to transfer borrowing and liability risks to the private sector.
Over the last five years, there has been an “uptick” in universities and colleges leveraging the private sector to deliver housing needs, said Kevin Wayer, an international director and co-president of the Public Institutions group at commercial real estate firm Jones Lang LaSalle.
“The notion of having the private sector deliver student housing is something that has been going on for many years, but I think it has definitely increased in utilization since the financial crisis,” Wayer said.
The financing structure, known as “P3,” is being employed both by schools that are fiscally strapped and those with healthier balance sheets.
Brailsford & Dunlavey, a project management firm, has seen on average a 50 percent year-over-year growth since 2011 in P3 transaction values it has consulted on for higher education institutions, said Brad Noyes, senior vice president.
In 2011, the transaction value for such P3 projects was $320 million, he said. Year-to-date the firm “has $2.5 billion worth of transactions we’re providing advisory work on,” Noyes said.
Use of P3s can contribute to reduced debt on universities’ balance sheets, said Todd Duncan, assistant vice president of housing, food and retail services at the University of Cincinnati’s main campus.
While still only a “fraction” of the U.S. municipal infrastructure market, the P3 market is building, Moody’s Investors Service said in a report issued in March.
“Universities are also expanding their use of different types of P3s beyond privatized student housing to include other university facilities,” Moody’s said. The report added: “More local governments and higher education institutions are exploring different types of P3s with more hybrid P3s and DBF (design, build, finance) structures.”
Universities might engage in P3s for a number of different reasons, including the efficiency that developers can bring to projects, Duncan said.
Increased operating costs for institutions and decreased state contributions have led to a financing gap, said Kurt Ehlers, managing director at Corvias Campus Living, a development group.
From fiscal 2008 to fiscal year 2016, state spending per student at public two- and four-year colleges decreased 18 percent, according to Michael Mitchell, a senior policy analyst at the Washington, D.C.-based Center on Budget and Policy Priorities.
The National Council for Public-Private Partnerships, a non-profit that advocates for P3s, lists 18 types of P3 partnership structures on its website. The council did not have a national figure for how much money is being spent on higher education P3 projects.
A newer P3 structure gaining in popularity has the developer not only help finance, build or renovate a project, but also maintain the facility, sometimes for decades, Ehlers said. In return for maintaining standards, the developer can count on a fixed incentive fee.
“From a sustainability standpoint, these properties, these assets become self-sustaining,” Ehlers said.
At the University of California in Merced, developer group Plenary Properties Merced will finance, build and maintain project areas that include student housing, academic facilities and recreation spaces.
The four-year $1.3 billion project will be financed through payments from the university and through funds contributed by the developer. UC Merced plans to fund its contribution of roughly $600 million by issuing bonds, said Stuart Marks, senior vice president at Plenary Group and a leader on the 2020 Project.
The developer will fund the difference via Plenary equity and privately placed notes, he said.
The university will pay the developer over 35 years while it provides continued maintenance of the facilities, Marks said.
“You get the economies of scale and efficiencies through having one developer responsible,” he said.
By REUTERS
AUG. 26, 2016, 2:18 P.M. E.D.T.
(Reporting by Stephanie Kelly; Editing by Daniel Bases and Dan Grebler)
Norwalk, CT—August 23, 2016—A Post-Implementation Review (PIR) of Governmental Accounting Standards Board (GASB) Statement No. 49, Accounting and Financial Reporting for Pollution Remediation Obligations (issued 2006), concluded that Statement 49 accomplished its objectives of providing more consistent, timely, and complete reporting of pollution remediation obligations by state and local governments.
“The PIR report on Statement 49 tells us that, overall, the standard provides creditors and other users of financial statements with useful information,” said GASB Chair David A. Vaudt. “The GASB acknowledges the issues raised by some governments in applying certain provisions of the Statement, and will consider those issues when addressing the provisions in the future.”
The PIR team developed its final report based on input from financial statement users, preparers, and auditors. The Statement 49 PIR team reached the following overall conclusions:
The PIR team had no standard-setting process recommendations as a result of the review.
The review of Statement 49 was undertaken by an independent team of the Financial Accounting Foundation (FAF), the parent organization of the GASB and the Financial Accounting Standards Board (FASB). The team’s formal report is available here. The GASB’s response letter to the report is available here.
With the completion of the GASB Statement 49 review, the PIR team has begun its review of GASB Statement No. 54, Fund Balance Reporting and Governmental Fund Type Definitions. For more information on the PIR process and to express an interest in participating in a review, visit the FAF website.
The U.S. Federal Housing Administration (FHA) issued final guidance in the form of Mortgagee Letter 2016-11 regarding the subordination of Property Assessed Clean Energy (PACE) assessments on Tuesday, July 19, 2016. As originally announced in August of 2015, the guidelines are part of a broader initiative to expand the accessibility of clean energy financing options while simultaneously preserving the value of underlying property with PACE assessments.1 Most PACE programs permit the PACE assessment to generate a lien on the property that is pari passu with real estate taxes and other assessments on real property and comes ahead of any mortgage lien on the property; a structure for which both the FHA and the Federal Housing Finance Agency (FHFA), the conservator of Fannie Mae and Freddie Mac, have expressed concerns. To address these concerns, the FHA announced that it will begin insuring mortgages on properties with PACE assessments that meet five conditions.
FHA Guidance on PACE Assessments
Super-Priority Lien Status
The paramount condition in the FHA guidance is centered around the concern that PACE assessments could take super-priority lien status over a mortgage in the event of default or foreclosure. Under this condition, PACE assessments cannot have superior priority lien status to the mortgage, except in the event of a default. Even in the event of default, a PACE assessment can only take priority over an FHA-insured mortgage to the extent of the installment of the PACE assessment that is delinquent. The guidelines also indicate that an event of default cannot accelerate full repayment of the PACE assessment; although, the guidelines permit a notice of lien with respect to the full PACE assessment amount to be filed in the public records.2
Special Assessment Treatment
A second condition requires that PACE assessments are collected and secured in the same way as a special assessment against the property (i.e. the PACE obligation must be escrowed by the lender).3 Essentially, this condition clarifies that the FHA will insure mortgages with PACE assessments attached if such assessments are treated like a property tax under state law, but will not do so if the PACE assessment is given first priority lien status in a manner other than described under the first condition.4 Legally, the FHA cannot accept PACE assessments that would treat the entire PACE assessment as a priority lien over the mortgage, except in circumstances of default or delinquency similar to other property tax assessments.5 This condition should please mortgage lenders, however, it does raise a concern about what would happen in a scenario where the FHA-insured mortgage enters into default and the defaulted assessment amount exceeds the escrow amount. It is unclear whether the FHA would be required to pay the remaining amount owed or whether that amount would be passed along to the purchaser of the foreclosed property.
Free Transferability
A third condition requires that there are no terms or conditions of the PACE assessment that would limit the transfer of the encumbered property to a new homeowner. This requirement includes a prohibition against a restriction that could require third-party consent to transfer the property, unless such restriction could be terminated at no cost by the homeowner.6
Public Record
A fourth condition requires that the PACE assessment be readily apparent in public records to all parties involved in the mortgage transaction and must: (i) state the loan amount; (ii) include the expiration date and cause of expiration; and (iii) specify that a default cannot accelerate the expiration date.7 It is not clear how this requirement will affect PACE programs that allow for a delay in the filing of the assessments in the public records.
Continue with the Property
A fifth and final condition requires that the PACE assessment attach to the property upon sale, including foreclosure.8 This requirement ensures that, in the event of a foreclosure or deed in lieu thereof, the balance of the PACE assessment will transfer to the new property holder instead of becoming immediately due and interfering with payment of the mortgage loan.
Disclosure and Appraisal Requirements
The FHA guidance further includes disclosure and appraisal requirements.
The disclosure requirement specifies that, in the event of sale of a property with a PACE assessment, the sales contract must specify whether the PACE assessment will remain attached to the property or if it will be satisfied by the seller at or before closing.9 If the PACE assessment will remain attached, all terms and conditions of the PACE assessment must be disclosed to the buyer and further made part of the sales contract.
Lastly, if the PACE assessment will remain with the property, any appraiser must include in its analysis the impact of the PACE-related improvements (i.e. solar panels) on the value of the property, irrespective of whether such impact is positive or negative.10
Lingering Questions and Concerns
While the FHA’s guidance is certainly a step in the right direction, there are still loose ends that need to be tied up. First, it is unclear from the guidelines who will be charged with enforcing the various conditions and requirements therein. For example, who will ensure that an appraiser is considering the impact of the PACE-related improvements on the value of the property? Will someone at the FHA scrutinize the appraisal, or will the program administrators be stuck with this task?
Second, the FHA’s previously-issued guidance in 2015 stated that the FHA intended to coordinate with the Consumer Financial Protection Bureau (CFPB) to address consumer disclosure requirements, yet the final guidance does not refer to any such collaboration. Additionally, though the Department of Energy’s Best Practices Guide for Residential PACE Financing (Best Practices Guide) stresses the importance of property owner education and disclosures,11 the utilization of the Best Practices Guide is not mandatory. The FHA explicitly states that it may be used to align state and county PACE programs with consumer protection goals; however, state and local legislatures are not required to utilize the Best Practices Guide.
Lastly, we note that under the “Fair Housing and Equal Opportunity” resources section at the end of the Best Practices Guide, there is a link to the U.S. Department of Housing and Urban Development’s website for the purpose of providing more information on “program structure, operation and evaluation to ensure equal access under the Fair Housing laws.”12
FHFA’s Position Remains Unchanged
The FHFA, the conservator of Fannie Mae and Freddie Mac (who collectively represent roughly 80% of the residential mortgage market), has a long-standing objection towards the “super-priority lien” status of PACE assessments, citing lack of knowledge on behalf of lenders as well as the lenders’ inability to account for additional risk and potential decline in the value of the property.13 Indeed, the FHFA recently stood by its objection to PACE assessments receiving super-priority lien status, stating that it does not intend to allow Fannie Mae or Freddie Mac to purchase mortgages on properties encumbered by PACE assessments.14
Conclusion
The guidelines promulgated by the FHA are a positive development and will allow property owners with existing PACE obligations—or those who wish to obtain them— to receive FHA-insured mortgage loans. Any positive impact will be mitigated, however, by the fact that the guidelines will affect roughly only 15% of the residential mortgage market. To have a more resounding and pervasive impact, the FHFA would have to release similar guidelines, yet it remains unclear whether they will do so.
Footnotes
1) U.S Department of Housing and Urban Development, Guidance for Use of FHA Financing on Homes with Existing PACE Liens and Flexible Underwriting through Energy Department’s Home Energy Score, (August 2015).
2) U.S Department of Housing and Urban Development, Mortgagee Letter 2016-11, (July 2016).
3) Id.
4) U.S. Department of Housing and Urban Development, FHA to Insure Mortgages on Certain Properties with PACE Assessments, Real Estate Rama, (July 2016).
5) Id.
6) U.S. Department of Housing and Urban Development, Mortgagee Letter 2016-11, (July 2016).
7) Id.
8) Id.
9) Id.
10) Id.
11) See Department of Energy, Best Practices Guidelines for Residential PACE Financing, Page 5 (July 2016).
12) Id. Page 14.
13) U.S Department of Housing and Urban Development, Statement of Alfred M. Pollard, General Counsel, FHFA, before the California Legislature, Keeping Up with Pace, (June 2016).
14) FHFA Won’t Budge on PACE LOANS, Asset-Backed Alert, (July 29, 2016).
Dechert LLP – Patrick D. Dolan, Kira N. Brereton and Noah Tischler
USA August 17 2016
PACENation applauds and strongly supports guidance for residential PACE issued today by the U.S. Department of Housing and Urban Development (HUD). The guidance clearly shows the Obama Administration’s strong commitment to Property Assessed Clean Energy financing, a bipartisan initiative adopted by 18 states thus far that encourages home owners to make energy efficiency and renewable energy upgrades to their properties. To date, over 100,000 households have made their homes more valuable, healthier and comfortable using PACE. The nearly $2.25 billion spent has created 22,000 jobs, many of them in the communities that offer PACE, and will save the equivalent of 12.5 billion kWh’s over the life of the measures.
The guidance issued today by HUD’s Federal Housing Administration (FHA) sets standards that will allow qualifying homes with PACE assessments to be purchased or refinanced with mortgage products provided by FHA.
“This is another critical step forward to make PACE financing available for more home owners so we can achieve our nation’s energy goals”, said Jeff Tannenbaum, PACENation’s founder.
PACE uses a financing mechanism that state and local governments have relied on for decades to promote improvements to private property that meet a public purpose. With PACE, home owners work with local contractors to decide which measures make sense. Funding is provided by private sector investors and repaid by each participating home owner as a charge on their property tax bill. PACE is completely voluntary and only impacts home owners who choose to participate.
Today’s release also includes an update to the U.S. Department of Energy’s PACE best practices guidelines. Strong consumer protection policies already adopted by PACENation and its members may make PACE financing the safest way for households to pay for investments they need and want to make in their homes.
David Gabrielson, PACENation’s Executive Director, said “We are thrilled by today’s announcement and appreciate the hard work that went into producing this guidance. We look forward to continued work with all market stakeholders on solutions that will make PACE available for more homes.”
PACENation is a national not-for-profit organization that is supported by foundations and in part by its members: organizations and individuals that recognize the power of PACE financing and seek to make it available as a financing option for all property owners that want to make clean energy (and in many places, water conservation) upgrades to their buildings. To learn more and find out how you can get involved, visit us at www.pacenation.org
PACENation
July 19, 2016
PHOENIX Public finance startup Neighborly is offering municipal issuers a chance to win a free bond financing.
The San Francisco-based financial services company is launching what it calls the “Neighborly Bond Challenge,” which will offer winning municipalities the opportunity to sell up to $10 million of bonds on Neighborly’s platform free of charge. Orrick, Herrington & Sutcliffe will be bond counsel. Applications will be accepted through Sept. 9, and the winners will be announced Sept. 21 at The Bond Buyer’s California Public Finance Conference.
Neighborly, which has a registered broker-dealer arm, aims to “democratize” the muni market be encouraging local investment from millennials and others who wouldn’t typically invest in muni bonds directly.
“In modernizing public finance, Neighborly is looking forward to financing innovative public projects being conceived right now by governments throughout the United States,” said Jase Wilson, Neighborly’s chief executive officer. “We are extremely excited about the opportunity to work with municipal finance thought leaders and to have Orrick as bond counsel for the Neighborly Bond Challenge. Neighborly’s goal is to reduce complexity and use data to create transparency in the municipal finance industry. Neighborly provides the same market accessibility for a parent buying a $100 muni bond for their child’s graduation as the world’s
largest bond funds. ”
James McIntyre, Neighborly’s head of public finance, cited the success of Denver, Colo.’s 2014 “mini-bonds,” which were sold in $500 denominations, and said Neighborly is looking to produce more small-investor triumphs like that.
“We just want to build upon their success and get people thinking about muni bonds,” he said.
Issuance of the five winning selections is targeted for between the fourth quarter of this year and the fourth quarter of 2017. Interested municipalities can apply on Neighborly’s website, where they are invited to fill out information about their proposed financing including how the bonds would be used, what their current ratings are, and who is on their finance team. Neighborly says ideal projects for the challenge would be those with a direct positive impact on the issuer’s local community.
“Ideal financings include those that support schools, create microgrids, tackle water scarcity, create resiliency, or benefit those in need,” the company’s website reads. “Think sustainable or green projects that would benefit from our technological economies of scale.”
Burlington, Vt. Mayor Miro Weinberger said he is strongly considering applying to the challenge as the city is planning some financings to improve its infrastructure.
“We are regular participants in the municipal bond market,” Weinberger said. “I think there’s a quite good chance we’re going to put in an application.”
Weinberger said he is often struck by the cost of a bond issuance, and feels that what Neighborly is offering could offer significant savings. He said he also likes the idea of the company’s mission of fostering more direct and local muni investment.
“It would be great if more of the public would get to participate,” he said.
The Bond Buyer
By Kyle Glazier
August 11, 2016
Municipal issuers have retail buyers in mind when they take a trip to the primary market to sell their tax-exempt bonds.
They say they have recently been delivering the 4%-or-less coupons that are in high demand by traditional buy-and-hold investors who have a growing appetite for cost-efficiency in the current low yield climate.
“We are giving investors the coupons they are looking for, hoping to increase the number of buyers interested and hoping to improve the pricing,” Tim Rosnick, deputy controller of the Los Angeles, Calif., Unified School District told The Bond Buyer in an interview on Wednesday.
He said the district incorporated the preferred 4% coupons into two bond issues totaling $1.2 billion it sold earlier this month as a means of being flexible and accommodating of buyers’ growing demand for sub-5% coupons.
The greater the demand, the lower the yields, which enhances cost savings, Rosnick said, as the district prepared to return to market with a competitive sale of $455 million refunding of GO dedicated unlimited ad valorem property tax bonds on Thursday.
While the deal is restricted from having zero coupon bonds or coupons higher than 6%, Rosnick said the structure will be at the discretion of the winning bidder.
“Other than the minimums and maximums, they have a great deal of flexibility in terms of coupons,” he said. However, he said he expects 4% coupons to surface on some of maturities given the recent trend for the lower coupon product.
Retail demand for sub-5% couponing is increasing, other issuers and financial advisors confirmed.
“We are aware of retail demand and routinely look at alternative couponing structures,” Jorge Rodriquez, managing director and head of public finance at Coastal Securities, said in an interview on Thursday.
As a co-financial advisor for the city of San Antonio earlier this month, Rodriguez said it made sense to structure some of the general improvement and refunding bonds and combination tax and revenue certificates of obligation from a $306.44 million sale with 4% coupons to benefit the hearty investor demand.
At the same time, that structure was advantageous for the city as some of the maturities with 4% coupons were oversubscribed – even though they were priced at a premium.
For instance, 4% coupons were structured in 2034, 2035, and 2036, to yield 2.43%, 2.48%, and 2.53% at the pricing.
Final decisions, according to Rodriguez, are often determined by a series of criteria, including investor demand, credit, size of the maturity, and yield to maturity calculations.
“All of those drive how you have to coupon it,” he said.
Rodriguez said his firm consults with the underwriters to get price indications by maturity on a variety of coupon levels, including 3%, 4%, and 5%, and then chooses the coupons that will grab the most investor attention.
“You have to be able to move the bonds and also want to price them at the lowest possible kick to the issuers,” he said.
Using lower coupons typically means a lower yield to maturity, which results in a lower cost to the issuer, Rodriguez said. For instance, structuring a maturity with a 4% coupon versus a 5% coupon may translate into 10 basis points of yield to maturity savings. That is very attractive for issuers selling a large transaction, Rodriguez said. On the city’s recent deal, 5% coupon bonds due in 2033 had a yield to maturity of 2.996%, versus the 4% coupons due in 2034, which had a yield to maturity of 2.981%, according to Municipal Market Data.
New York City is also among issuers around the country aiming to please retail buyers with preferred couponing to meet their investment needs.
As a large and frequent issuer of municipal debt, New York City wants to keep abreast of the changing patterns of investor demand and try to meet that demand, according to the New York City Comptroller’s office.
“Individual investors – who often live or work in our city – have always been important to the success of our bond sales,” New York City Comptroller Scott M. Stringer told The Bond Buyer in a prepared statement.
“We will continue to make a concerted effort to give individuals a fair chance to purchase bonds and invest in New York City’s success.”
The city recently drew substantial demand for 4% coupons that were included in its Aug. 2 GO sale of tax-exempt bonds totaling $800 million, according to data provided by the New York City comptroller’s office.
The 4% coupons generated 51% of the $215 million taken during the two-day retail order period, while 37% were for the 5% coupons, and 12% were for the sub-4% coupons.
The strong demand for 4% coupons comes in response to the absolute low level of interest rates, the comptroller’s office said. There is a particular effort by professional retail investors, such as money managers, financial advisors, and trust departments acting on behalf of individuals, to avoid the higher dollar prices associated with 5% coupons, which was the dominant coupon structure up until three to four months ago, the comptroller’s office said.
On the city’s GO sale, retail investors veered from recent buying patterns and participated in longer maturities in order to get higher yields – even if it meant accepting lower than the 5% coupons they previously favored, an underwriter involved in the deal said after the pricing.
The retail crowd chased the 3% and 4% “handles” available in 2029 with a 2.07% yield and 2036 with a 2.78% yield. They even participated in the 2039 maturity, which had a split 3% and 4% coupon yielding 2.90% and 2.71%, respectively, he said.
“The market acceptability of sub 5% is becoming more and more prevalent,” the underwriter added. “With absolute yields as low as they are people are sacrificing a little less coupon to pick up a little more yield to the call.”
Since 5% coupons once dominated the market, retail investors also have an increased need for coupon diversify away from the previous market standard, the comptroller’s office noted.
At the same time, the city benefits from having lower coupons, such as 4% coupons, which are priced as premiums to a call date with a slightly higher yield, and act as a natural hedge against rising interest rates versus the 5% coupons, the comptroller’s office said.
Other issuers around the country are also tailoring their coupon structures for retail, while also achieving some cost savings of their own.
“The Connecticut State Treasurer’s Office structures its bond sales to meet the preferences of a variety of investors and to strike a balance between current and future debt service costs for the general obligation program,” Deputy State Treasurer Lawrence A. Wilson said in an email on Wednesday.
“We also are mindful that many retail customers prefer to purchase bonds with coupons of 4% or lower in order to avoid the higher prices associated with 5% coupons,” he said. “Some institutional customers also prefer to purchase bonds with lower coupons,” he added. “We structure our bond sales with a variety of coupons accordingly.”
For instance, he said Connecticut’s recent new issues have been structured with lower coupons to both accommodate retail investors’ cost efficient strategy, as well as to manage the state’s future debt costs.
“The lower coupons also allow us to balance current and future debt service costs, particularly for our general obligation bond program, for which premium must be used to cover near-term interest costs,” Wilson explained. “Because of this, the budget impact of selling 5% coupon bonds at a premium is lower debt service in the short-term, but higher debt service in the future.”
Therefore, selling lower coupon bonds for the GO program helps the state manage future debt costs, Wilson added.
For example, of the $250 million in tax-exempt GO bonds the state sold earlier this month via competitive bid at record low rates, he said $100 million, or 40%, of the bonds were assigned coupons of 4% or less by the winning bidder.
Additionally, when the state sold GOs back in May, of the $57 million in orders from retail investors during the retail order period, $29.1 million, or 51%, of those orders were for 4% or lower coupon structures, according to Wilson.
Of the total $501.4 million of bonds sold, $114.6 million, or 23%, of the bonds were sold with 4% or lower coupons to both retail and institutional investors, he added.
Wilson noted that Connecticut two decades ago was one of the first states to pioneer the now widely-used retail order period as a marketing technique and still gives its in-state residents priority status on bond issues.
Like Connecticut, New York City makes frequent use of retail order periods and makes an effort to offer a variety of coupons to their loyal, mom and pop investors, while also giving their orders preference over institutional orders when it comes to new issues, the comptroller’s office said.
The Bond Buyer
By Christine Albano
August 18, 2016
The U.S. Department of Transportation (USDOT) announced the establishment of the Build America Bureau, “which will drive transportation infrastructure development projects in the United States by streamlining credit and grant opportunities while providing technical assistance and encouraging innovative best practices in project planning, financing, delivery and monitoring.”
“The Build America Bureau will be a one-stop shop to help develop projects and provide financing in a single streamlined, effective and comprehensive manner,” said U.S. Transportation Secretary Anthony Foxx. “It will allow USDOT to be responsive to America’s changing transportation needs and opportunities, so we can deliver real, tangible infrastructure development for local, regional and national population centers.”
The Build America Bureau combines the following USDOT programs: the Transportation Infrastructure Finance and Innovation Act (TIFIA), the Railroad Rehabilitation & Improvement Financing (RRIF), the private activity bond (PAB), the Build America Transportation Investment Center (BATIC) and the new $800 million Fostering Advancements in Shipping and Transportation for the Long-term Achievement of National Efficiencies (FASTLANE) grant program.
The bureau will utilize the full resources of all the modes within USDOT and continue to promote a culture of innovation and customer service. To the customer, there will be a single entity in charge of USDOT credit, large scale and intermodal project development and a single point of contact for working with USDOT on infrastructure finance and development.
The Bureau Outreach and Development team, continuing the work of the BATIC, will work with the project sponsors to support them on how they can best combine credit, funding and innovative project delivery approaches, such as public-private partnerships (P3s) and then offer project-level technical assistance to get them ready to pursue it.
The department’s credit team will be able to underwrite loans from multiple sources together, so that the customer is no longer getting a TIFIA loan or a RRIF loan, but instead a single credit package from USDOT to help them build the infrastructure they need. Also, the bureau will manage the application and evaluation process for the FASTLANE grant program, which funds high-impact projects that address key challenges affecting the movement of people and freight.
BATIC, which was announced in 2014, has expanded the department’s ability to meet the needs of the nation’s transportation system. BATIC serves as a single point of contact and coordination for states, municipalities and project sponsors looking to utilize federal transportation expertise, apply for federal transportation credit programs and explore ways to access private capital in P3s. Since BATIC’s formation, USDOT has closed more than $10 billion in financing to support $26 billion in projects.
Railway Age
Thursday, July 21, 2016
Often-uninformed city leaders struggle with the decision, and taxpayers pay the price for their lack of financial knowledge.
These days it’s not hard to convince people to live downtown, or, for that matter, to get developers to build places for them to live. Increasingly, both millennials and baby boomers want urban amenities. They want to live close to work, parks and restaurants, and they want to be able to walk or bike to them. As a result, downtown populations have soared: 65,000 people now live in downtown Seattle, downtown Los Angeles — traditionally not a residential area — is home to 52,000 people, downtown Philadelphia has 57,000, and Boston has 17,000 (a 50 percent increase since 2000).
Needless to say, these cities aren’t subsidizing downtown development. In some cases, they’ve actually started to extract fees and concessions from developers to build downtown. But that’s not the case everywhere.
In Houston, where I live, 150,000 people work downtown, but fewer than 5,000 people live there. Clearly, it has room to grow — and there are takers. Several thousand luxury units are currently under construction. Rentals can go for close to $5,000 per month, while condominiums can go for as little as $300,000 or as much as $1 million or more. But the market for downtown living isn’t as robust as in other cities. So Houston is paying developers $15,000 a unit to build there.
Which raises some pretty basic questions: How much should cities spend to buy downtown residents? And when should they stop?
Yes, I said “buy” residents. When city leaders provide a financial subsidy for a development, that’s what they are doing — paying money to acquire residents or stores or offices that wouldn’t otherwise be built in a certain place.
The obvious answer to when a city should stop buying residents is when developers stop asking for subsidies. But we know all too well that this never happens. Urban real estate developers always ask for subsidies whether they need them or not, and cities often provide them even when they’re not needed. Why else would cities subsidize billion-dollar sports stadiums to house teams that are worth billions and that are owned by sports tycoons worth billions?
That’s why cities need to know a lot about the economics of private real estate development deals, specifically when and why projects pencil out or don’t. It’s something that, amazingly, cities know little about. If you’re going to subsidize a developer, for example, you should only do it when you know you can’t get the project you want done any other way. Alternatively, if you’re going to soak a developer for impact fees or other community benefits, you should do so only when you know it won’t kill a project you otherwise want. That’s why cities should have a lot of financial analysis capacity — not just to balance their own budgets, but to understand whether developers are balancing their own budgets on the backs of the taxpayers.
So perhaps the real question is: How do cities ensure they have the financial IQ to decide when and when not to subsidize development?
GOVERNING.COM
BY WILLIAM FULTON | AUGUST 2016
Tax incentives aren’t always the best way to lure businesses. Many are simply going where the talent is.
Ryan Woodings owns a 15-person tech startup in Boise, Idaho.
His company, MetaGeek, specializes in helping businesses fix and maintain their Wi-Fi systems. Or, as the website puts it, “making Wi-Fi more awesome for more people.” A decade ago, MetaGeek was a side project out of Woodings’ house. His mom was his first hire. Eventually, the company grew and moved into an actual office in a suburban neighborhood on the outskirts of Boise.
The location posed some problems. Foremost among them was what might be termed the “intern dilemma.” Each semester, MetaGeek seeks the help of a handful of student interns from Boise State University. “Being 20 minutes away from campus,” Woodings says, “we could only get students who had a car and had certain class schedules.”
So MetaGeek did what a lot of companies are doing these days. It moved downtown. The student interns are now able to bike over to the office between classes. In the afternoons, MetaGeek employees can take walks on the nearby greenbelt that runs through town along the Boise River. If they want to bike home, the city runs a bicycle rental program and has an expanding network of dedicated bike lanes. “Downtown Boise is where everything is,” Woodings says. “When you have a lunch meeting, or get coffee with a client, it’s always downtown.”
MetaGeek is one of several tech companies that have put down roots recently in the center of Boise. Last summer, Boise State moved its computer science department downtown so that it could be closer to students’ potential employers. And Boise isn’t unusual. In cities across the country, businesses are trying to capitalize on the increasing density of tech talent clustered in the heart of cities. In Massachusetts, General Electric is setting up its new headquarters along the central Boston waterfront. In Rhode Island, Hasbro has moved 350 jobs to downtown Providence. In Illinois, nearly 50 companies, from Kraft Heinz to Motorola Solutions, have reestablished their headquarters in or near Chicago’s loop. According to the U.S. Census Bureau, the number of metro area jobs located within three miles of downtowns increased seven percentage points between 1996 and 2013. The suburbs still have about three-quarters of metro area jobs, but downtowns are luring quite a few employers back.
Much of that has to do with the tastes of the millennial generation, adults 34 and younger, many of whom continue to express a preference for walkable neighborhoods with bike lanes, public transit and a mix of recreational amenities. Last year, millennials became the largest component of the American workforce. For many companies, attracting and retaining millennial workers seems to require having a downtown office. “Probably for the first time in history, instead of people moving where jobs are,” says Tom Murphy, a senior fellow at the Urban Land Institute, “jobs are moving where the talent is.”
The most talked about move of this kind in recent years is GE’s decision to move from Fairfield, Conn., in the suburbs of New York City, to its new location in the center of Boston. A mix of $145 million in tax breaks from the city and the state of Massachusetts made the relocation cost-neutral, but that wasn’t the main reason for the switch. If it had been, GE would have moved to New York, where Gov. Andrew Cuomo had brokered a deal offering more in tax incentives.
At the time of the announcement, Jeffrey Immelt, the CEO of GE, explained the move in terms of the company’s changing identity. He pointed out that the global industrial conglomerate is getting into software, and its location in the Seaport District of downtown Boston puts GE employees in the same neighborhood as dozens of venture capital firms and tech startups. Immelt noted that GE should have no problem finding and hiring local talent, as the Boston metro area is home to 55 colleges and universities and Massachusetts spends more on research and development than any other region in the world.
But the company’s decision to move was also based on a desire to be in an environment with sidewalks, ample transit and other amenities that would appeal to younger employees. GE executives boasted about the industrial feel of the site, which includes two historic brick warehouses overlooking the Fort Point Channel.
The reasons why GE moved are the reasons a lot of companies are moving back downtown. “Municipalities used to offer the lowest tax rates and the biggest subsidies to attract companies. That’s no longer the case,” says Murphy, who was mayor of Pittsburgh for 12 years before joining the Urban Land Institute. “People want a sense of place with good public transit and a good mix of activities. Cities that are making those kinds of investments are probably going to be the winners.”
Last year, the urbanist advocacy group Smart Growth America studied nearly 500 companies that added jobs downtown between 2010 and 2015. About half moved in from the suburbs; others were moving from another downtown location, or expanding their existing downtown presence. What they had in common was a relocation of jobs to areas that were more bikeable, walkable and transit-accessible.
That’s what happened with Red Hat, a software company in North Carolina. In 2011, Red Hat had outgrown its headquarters in a research park in southwest Raleigh. When management surveyed workers about what they were looking for in a new location, “the pretty much unanimous feedback was that [they] wanted to be in a more urban environment,” says Simon George, a senior director at Red Hat. “That factored heavily into our decision-making.” Ultimately, the company took over a former Duke Energy building in downtown Raleigh, adding more than 250 jobs to the downtown core. “The expectations of employees have changed,” George says. “They want to be able to walk from home to work. They want to be able to walk to restaurants. They don’t want to be driving everywhere.”
All across the country, suburban office parks are less economically competitive than they once were, says Stephen Friedman, a development adviser and urban planner in the Chicago area. “The times have changed and the attitudes have changed,” he says. It isn’t just that millennials want to work downtown. It’s that so many of them want to live there.
In 2013, the Urban Land Institute found that 62 percent of millennials preferred a home close to shops, restaurants and offices. In another survey by the institute, millennials in the Boston metro area were more concerned with the ease of their commute and the proximity of public transit than the quality of schools or public safety. Nearly 80 percent said it was very important to be near public transit while only 30 percent said it was very important to have free or discounted parking.
As recently as a decade ago, “the sheer amount of space available in the suburbs might have been a positive attribute,” says Bethany Schneider, an analyst with the commercial real estate firm Newmark Grubb Knight Frank (NGKF). “Now, more companies aren’t looking for room to grow. If anything they’re looking to be more efficient.”
Schneider was part of a team at NGKF that last year studied suburban office parks near five major cities: Chicago, Denver, New York, San Francisco and Washington, D.C. They found that between 14 percent and 22 percent of the suburban office inventory was “obsolete.” It didn’t meet at least two of six common features that prospective tenants said they wanted, especially proximity to transit. Tenants in obsolete suburban office parks “are facing a losing battle to retain their best workers,” the study’s authors concluded, and “owners of such spaces are facing an even greater challenge — how to keep their investments attractive to tenants.”
In June, Friedman gave a presentation about the growth of downtown jobs to a group of Chicago area real estate professionals. He noted that the retail and office vacancy rates were lower in the city than the suburbs, and he named some of the big companies everyone knew were setting up shop in downtown Chicago. (That very week, McDonald’s was the latest to announce a new central Chicago headquarters.) Midway through his presentation, however, Friedman got to an important slide. At the top it said, “The Suburbs Are Hardly Dead!”
“The companies that need the young millennial labor force have moved some functions downtown,” Friedman says. “But it’s not like everything is lost in the suburbs.”
Indeed, the flight from suburban office sites can be overstated. When companies move downtown, they get press. When they change locations within the suburbs, they don’t draw the same attention. Right now in the Chicago area, about two-thirds of total regional employment is in the suburbs, where rent is about half of what it is in the city. Downtown vacancy rates are trending downward, but that’s true in the suburbs as well. The rate of employment growth is expected to be faster in the city, but the total number of added jobs will be higher in the suburbs.
Still, suburban communities worried about long-term trends are looking for ways to adapt and become more competitive with urban downtowns. The optimal solution, according to Friedman and his colleague Ranadip Bose, is to “sub-urbanize” — to provide enough urban-style amenities to be able to compete for city-minded millennials.
One place attempting such a reinvention is Research Triangle Park (RTP) in the Raleigh-Durham area. The campus is half the size of Manhattan, and boasts several global science and tech companies, notably IBM and Cisco Systems, but it’s also an artifact of 1950s community planning. The fact that tech companies like Red Hat are choosing downtown Raleigh over nearby research parks illustrates the problem RTP currently faces: It has no housing, no light rail, and no main street with cafes, restaurants and shops. The RTP’s layout inhibits the kind of informal socialization and networking between tech workers that is increasingly common in urban innovation districts.
That will soon change. With $50 million in public and private investment, the Research Triangle Foundation has plans to redevelop a 50-acre site, adding apartment buildings, a central marketplace and public gathering spaces, including an amphitheater, dog park and sculpture garden. Like many downtowns, the redrawn Research Triangle Park will have a bike rental program and a circulator bus to get around campus. The foundation’s CEO, Bob Geolas, is also hoping for a regional dedicated rail system, with the park as the central hub, so that RTP’s 40,000 workers don’t have to commute by car.
Geolas says that about eight years ago, the park’s tenants started to express anxiety that the campus was a liability in recruiting talent. “The suburban park model really isolates and separates out what the companies are doing from the general public,” Geolas says. “When you visit a traditional urban center, there’s an energy there. Downtowns have a sort of personality that does not exist in a suburban research park like ours. A big part of what we’re doing is building a personality that people can relate to and be inspired by.”
The foundation calls the redevelopment a “park center,” but it does envision many of the trappings of a traditional downtown: pedestrian walkways, transit, housing, coffee shops and lunch spots. The difference would be the natural ambience, with plots of grass and rows of trees woven throughout the campus. “What we really want,” Geolas says, “is the most urban park experience that you can imagine.”
Such an extensive overhaul might be out of reach for the typical suburban community, but villages outside Chicago are already contemplating small ways that they can become more urban. The village of Schaumburg, which lost the Motorola Solutions headquarters last year, is looking to update that site by breaking up so-called “superblocks” into smaller 600-foot-long blocks with more foot paths. The village is getting its first new apartment complex in more than 15 years, a 180-unit building catering to young professionals working in town. And the village is adding bike trails that connect Schaumburg to a nearby community college and forest preserve.
Of course, some places don’t see a need to change, and won’t. Last year, when Kraft Heinz opened a new headquarters in Chicago, it closed its offices in the village of Northfield. “We were disappointed to see them leave. We weren’t worried economically,” says Stacy Sigman, the village manager. “We have a great campus. Immediately we were inundated with calls to take over the space.” Technically, the office Kraft left behind was vacant for 15 days, but a medical supplies company, Medline Industries, had already secured the lease, adding 1,800 jobs — more than the number that had left.
Northfield has an array of advantages. It’s an inner-ring suburb with about 6,000 residents, less than 30 minutes’ driving time from downtown Chicago on a light traffic day. It has some of the best public schools in Illinois. Sigman says Northfield doesn’t have plans to adopt urban-like features. “It’s contrary to who we are,” she says. “We like the small quaintness. I think that’s what makes us special.”
Some places don’t have a choice. They have to change. Geolas, the Research Triangle CEO, would like to see suburban research parks evolve into something more attractive to millennial workers, and he finds a source for optimism in the history of downtowns. “I’m old enough to remember when [magazines] ran stories about how downtowns were dead,” he says. Eventually developers and city planners found a formula to reinvigorate urban business districts with density and a diversity of uses. Now the same process needs to happen in the suburbs, he says. “We have to reimagine what those places can be.”
GOVERNING.COM
BY J.B. WOGAN | AUGUST 2016
Abstract
Evaluations are a key feature of pay for success (PFS) projects, and rigorous evaluation designs are important for building the evidence base of effective programs by determining whether a project’s outcomes can be attributed to the program. Randomized controlled trials (RCTs) are considered the most rigorous evaluation design and give us the best approximation for what would have happened without the program. However, PFS stakeholders often don’t know about RCTs or consider them too expensive, difficult, or controversial. This brief outlines RCTs, their advantages, and solutions to overcoming perceived and real challenges to their use in the context of PFS.
The Urban Institute
by Justin Milner and Kelly Walsh
August 10, 2016
Abstract
Pay for success (PFS) projects offer governments opportunities to invest in outcomes and employ new capital to meet the needs of their communities. But PFS projects also carry risks. For investors, the risks relate to the project failing to meet its outcomes or the government reneging on its commitment to pay. Investors’ perceptions of risk matter. Projects with high or unclear risk may discourage investors and prevent the project from launching. This brief helps project partners understand the risks investors perceive when entering PFS contracts and familiarize themselves with measures that have been used or proposed to manage this risk.
Download the full report.
The Urban Institute
by Rebecca TeKolste, Matthew Eldridge, and Rayanne Hawkins
August 18, 2016
Detroit left a bitter aftertaste for bondholders.
Under the city’s plan to shed $7 billion in debt, Detroit reached settlements with its pensioners that left intact public safety monthly checks and cut 4.5% for general employees. Their cost-of-living increases were reduced or eliminated. They did see a big cut in the form of retiree health-care benefits, which were trimmed by nearly 90%, allowing the city to shed a $4 billion obligation.
Unlimited-tax general obligation bondholders, meanwhile, agreed to a 26% cut – with the money going to pensioners – and limited-tax GO holders took a 66% cut. Holders of $1.5 billion of certificates of participation saw a 14% cash recovery as well as a groundbreaking package of vacant land, asset leases, and development deals.
Former U.S. Bankruptcy Judge Steven Rhodes who oversaw Detroit’s historic Chapter 9 called the city’s plan of adjustment reasonable, fair and equitable, key benchmarks under federal bankruptcy law. The decision to treat its pensioners more favorably than other creditors was fair and justified in part because of state constitutional protections of the retirement obligation, Rhodes said.
The treatment Detroit’s bondholders relative to pensioners was typical, as pension funds have flexed political muscle in bankruptcy cases across the nation. As bankruptcy specialist David Dubrow of Arent Fox LLP put it in a published piece:
“While bondholders, pensioners and workers can all be impaired in a bankruptcy as a general matter, public policy and politics determine outcome more than any other factor given the limited legal precedents in Chapter 9.”
In California, the Vallejo, Stockton and San Bernardino bankruptcies all pitted the bond investors – whether they held pension bonds or other bonds – against the nation’s largest pension fund, the mammoth California Public Employees’ Retirement System.
While California’s pension funds received a 100% recovery in the trio of bankruptcies, bondholders did not fare as well. In California, bondholders received anywhere from a 40% to 60% recovery, though San Bernardino’s bankruptcy plan has yet to be approved.
In Detroit, the pension funds received an 82% recovery, according to a 2015 Moody’s Investors Service report, while bondholders received only 25% on a “weighted-average basis” that factored in the impact on LTGO, ULTGO, and COP holders.
Behind the protections built into Detroit’s exit plan for pensioners was the city’s so-called “grand bargain.” A philanthropic consortium collectively pledged $366 million to offset the city’s massive pension burden and avert any move to sell off the assets of the city-owned Detroit Art Institute museum.
The funds leveraged support from corporations and the state to bring the package to more than $800 million and in turn brought the city’s public unions to the table to agree to concessions. The funds are to be set aside over a 20-year period and handled by special entity that will direct them to pay benefits.
Under the plan, the state also agreed to provide $195 million to Detroit pensioners in exchange for pensioners dropping the right to sue the state to recover the unfunded pension debt that the city cannot pay. That debt could have been as high as $3 billion. The pension restructuring is central to the city’s recovery plan, as it was freed of the need to make pension payments for 10 years as well as the liability for other post-employment benefits, or OPEB.
“The most emphatic message of the Detroit and Stockton plans of adjustment is their intent to protect work force sustainability at the expense of bondholder repayment,” Fitch wrote in a special report on those bankruptcy outcomes.
“In each case, the bankruptcy judge agreed that this goal was more important than repaying investors. The issue then becomes one of public policy rather than legal constraint, and it appears likely that many governments would similarly favor retaining pensions over the good faith of bondholders.”
Detroit’s bankruptcy contributed to the burgeoning debate over the potential cracks in general obligation pledges and the use of statutory liens for GO bonds to strengthen bondholders’ positions in a municipal workout.
But the politics behind cutting a public employee’s benefits remain a strong deterrent for elected officials and courts. At the same time, there’s also been a growing discussion of the use of a bankruptcy threat to get labor unions to the table as a distressed municipality looks to cut.
“The standing of bondholders versus pensioners in a municipal bankruptcy can be ambiguous because pensioners may have additional legal and political protections that are superior to bondholders. A municipal government wrestling with politically difficult pension funding or reform may therefore have an incentive to accelerate bankruptcy primarily to reduce its debt,” Moody’s Investors Service said in the municipal bankruptcy report last year.
Steps taken by California in the wake of its trio of Chapter 9 bankruptcies over the past several years have given bondholders some reassurance when it comes to general obligation bonds issued by cities, but left investors wary about pension obligation bonds.
Pension liabilities – and pension obligation bonds issued to deal with that liability — were issues in the trio of California bankruptcies and in Detroit as well.
In Stockton, Franklin Templeton continued to fight the city for a better recovery even after the bankruptcy judge approved the city’s exit from bankruptcy. The company said in its court filings that the bankruptcy court that confirmed Stockton’s plan erred in approving a plan that was “discriminatory and punitive” to Franklin, paying it roughly 1% on $35 million of bonds while leaving pensions untouched and paying other creditors who had settled with the city earlier between 52% and 100%.
Stockton’s attorneys said in their own filing that Franklin’s total recovery rate on secured and unsecured claims is roughly 17.5%. The city countered that any further relief awarded to Franklin would fall squarely on the city’s residents in the form of “reduced services, infrastructure investment, and essential reserves.”
Franklin finally announced in December 2015 that it would not pursue further appeals in Stockton’s bankruptcy.
In San Bernardino, City Attorney Gary Saenz said in April of the agreement with pension obligation bondholders that the city was able to give the bondholders 40% of what is owed, rather than the more severe 1% originally proposed, because the agreement allowed them to stretch out payments 20 years.
The city has drafted a 20-year business plan that found it would be able to feasibly make those payments without the city ending up in bankruptcy again down the road, he said.
“One thing Judge Meredith Jury will look at is the feasibility of the confirmation plan,” he said. “We believe we found a model that is dependable.”
The pension obligation bond agreement continues a trend of bonds faring worse than pensions in Chapter 9 cases.
Under the settlement, COMMERZBANK Finance & Covered Bond S.A., formerly Erste Europäische Pfandbrief-Und Kommunalkreditbank AG, and municipal bond insurer Ambac Assurance Corporation, agreed to drop their opposition to the city’s bankruptcy plan.
The holders of $50 million in pension obligation bonds will receive payments equal to 40% of their debt on a present value basis, discounted using the existing coupon rate, according to city officials.
Though San Bernardino reached an agreement with bondholders earlier this year in its bankruptcy, its bankruptcy exit plan is slated to be voted on in September by creditors. The current hope is that the city could exit bankruptcy by October – if creditors approve the plan and the bankruptcy judge deems the plan good enough to prevent the city from returning to bankruptcy court down the road.
The Bond Buyer
By Yvette Shields and Keeley Webster
August 17, 2016
CUSIP Global Services reported that the 30% drop in July marks the end of five consecutive months of growth. The number of municipal bond CUSIP orders that were handled was 1,218. This was the second-lowest order count of the year.
According to CUSIP Global Services, this was likely due to states beginning a new fiscal year last month, rather than a softening in demand.
However, thanks to strong activity in the bond market in the first half of the year, overall municipal bond CUSIP requests are still up 1% on a year-by-year basis.
Most municipal requests were reported in Texas with 1,211 so far in 2016, followed by New York with 960, and California with 734.
Gerard Faulkner, director of operations for CUSIP Global Services said that recent issuance data suggested that capital markets activity was still solid, “despite a lot of uncertainty”.
“Based on July’s data, the second half of the year is off to a good start,” he said.
Also, the report showed that requests for international debt and equity dipped in July. Requests for international equity fell from 188 in June to 168 in July. Meanwhile, international debt requests dropped from 241 to 213. Year-on-year, equity requests were down 60% and debt requests were down 27%.
Richard Peterson, senior director, S&P Global Market Intelligence, said: “With ongoing economic and political instability, particularly in Europe, it makes sense this pre-capital markets activity would continue to show softness, in comparison to the US.”
“Given that governments have a ways to go before settling on solutions, we expect issuance to remain weak for the foreseeable future,” he added.
Public Finance International
By: James Richards
17 Aug 16
Fitch Ratings-New York-12 August 2016: Fitch Ratings has updated its rating criteria for solid waste revenue bonds. The updated report replaces the existing criteria published on Aug. 4, 2015.
No changes to the ratings of existing transactions are anticipated as a result of the application of the updated rating criteria.
Contact:
Kevin Dolan
Director
+1-212-908-0538
Fitch Ratings, Inc.
33 Whitehall Street
New York, NY 10004
Amy Laskey
Managing Director
+1-212-908-0568
Media Relations: Elizabeth Fogerty, New York, Tel: +1 (212) 908 0526, Email: [email protected].
Additional information is available at ‘www.fitchratings.com’.
ALL FITCH CREDIT RATINGS ARE SUBJECT TO CERTAIN LIMITATIONS AND DISCLAIMERS. PLEASE READ THESE LIMITATIONS AND DISCLAIMERS BY FOLLOWING THIS LINK: HTTP://FITCHRATINGS.COM/UNDERSTANDINGCREDITRATINGS. IN ADDITION, RATING DEFINITIONS AND THE TERMS OF USE OF SUCH RATINGS ARE AVAILABLE ON THE AGENCY’S PUBLIC WEBSITE ‘WWW.FITCHRATINGS.COM’. PUBLISHED RATINGS, CRITERIA AND METHODOLOGIES ARE AVAILABLE FROM THIS SITE AT ALL TIMES. FITCH’S CODE OF CONDUCT, CONFIDENTIALITY, CONFLICTS OF INTEREST, AFFILIATE FIREWALL, COMPLIANCE AND OTHER RELEVANT POLICIES AND PROCEDURES ARE ALSO AVAILABLE FROM THE ‘CODE OF CONDUCT’ SECTION OF THIS SITE. FITCH MAY HAVE PROVIDED ANOTHER PERMISSIBLE SERVICE TO THE RATED ENTITY OR ITS RELATED THIRD PARTIES. DETAILS OF THIS SERVICE FOR RATINGS FOR WHICH THE LEAD ANALYST IS BASED IN AN EU-REGISTERED ENTITY CAN BE FOUND ON THE ENTITY SUMMARY PAGE FOR THIS ISSUER ON THE FITCH WEBSITE.
As the world’s second-largest economy falters, pensions and tax revenues here are feeling the pinch.
Earlier this summer, New York state’s pension fund announced a mediocre year. Investment earnings were essentially flat, and as a result the fund lost $5 billion because its other receipts — contributions from government and from current employees — didn’t cover retiree payouts.
The New York pension system was the victim of a global event that began halfway across the world a year ago this month. In August 2015, the world’s second-largest economy officially began to stumble. China’s central bank stunned investors by devaluing the yuan, lending credence to what outsiders had long been suspecting: China’s years of astounding annual economic growth — at times cresting at double digits — was slowing down.
Toward the end of that month, China’s stock market endured its biggest one-day fall since 2007. The state media dubbed it “Black Monday” and the result shocked the world. Emerging market currencies slumped, commodity prices fell and Western financial markets reeled. At one point, General Electric’s stock was down by more than 20 percent. The markets seemed to recover just in time for a January report from China that the country’s growth rate for 2015 — 6.9 percent — was the weakest in a quarter-century. Although robust by U.S. standards — GDP growth in the United States last year was 2.4 percent — the bad news from Beijing once again sparked market volatility here and abroad.
In short, China has made it a difficult year for institutional investors, public pension plans prominent among them. But financial markets aren’t the only way China’s economy can impact states and localities.
For the last decade, with China a reliable engine for economic growth, other countries around the world have been feeding off it. China is the leading destination for a handful of states’ exports and accounts for more than $115 billion in goods shipped annually from the U.S. The country is a key consumer of U.S.-made airplanes, cars and medical equipment. Meanwhile, Chinese companies have stepped up their investment in U.S. cities and industries, building auto plants, investing in oil fields and buying real estate — a Beijing-based company now owns the Waldorf-Astoria hotel in New York. There is essentially no region in the U.S. without some connection to China, and at least some vulnerability to a downdraft.
U.S. economists and state development officials are familiar with the ways negative economic events in Europe, such as Britain’s recent vote to leave the European Union, can have an effect here at home. And for the near future, events in Western Europe and some other developed powers, such as Japan, will continue to have the greatest impact on states and localities. But if things in China worsen, the economic pain for governments in this country could be severe.
Even before China’s crisis rattled the U.S. stock market, state and local pension plans were struggling. Last year, annual investment returns were meager. Because of the 2015 market plunge in China, most pension plans in the United States will likely report even worse returns for 2016. The two-year hit, says a Moody’s Investors Service analysis, will effectively wipe out the funding improvements seen in 2013 and 2014.
Under Moody’s most optimistic scenario, according to which U.S. investment returns average 5 percent for this year, overall pension plan liabilities will increase by 10 percent. Under the credit rating agency’s most pessimistic outlook, where investment losses are 10 percent for the year, Moody’s sees liabilities growing by more than half. In that case, governments would be faced with demands to put significantly more general fund money into pension plans than was previously forecast.
Market volatility doesn’t just affect pension plans. A number of state governments find their tax base is significantly exposed when investment income — capital gains revenue — has a bad year. California, Connecticut and New York all tend to “get clobbered” when financial markets have a down year, says Donald Boyd, the Rockefeller Institute of Government’s fiscal studies director. These three states and Oregon (which banks heavily on personal income tax payments in general), have the highest reliance in the nation on capital gains revenue. “If you have a lot of rich people and you tax them relatively heavily,” Boyd says, “then you’re going to be most affected by this kind of scenario.”
While there’s unlikely to be anything like the 20 percent revenue drops seen during the U.S. financial crisis in 2008 and 2009, states are already starting to feel the revenue impact of the past year’s stock market reactions to China’s slowdown. Income tax collections make up about one-third of the average state’s total revenue. In April, the single biggest income tax collection month for states, the average state’s income tax revenue was down nearly 10 percent from the previous year, according to a Reuters analysis.
It’s a taste of what could happen if China falters further. California had to trim its overall income tax revenue expectations for the 2016 fiscal year by nearly $2 billion, thanks to an April shortage of about $1 billion in collections. Connecticut, Massachusetts, New Jersey and Pennsylvania also announced declines in actual or projected income tax receipts after April.
What made this issue doubly challenging was that the news came in around the time state lawmakers were in the midst of the tricky business of drawing up the next year’s budgets. “This throws a monkey wrench into it,” Boyd says, noting that it creates future problems as well. “When you’re dealing with a budget shortfall with only a few weeks to go in the fiscal year, there’s a good chance lawmakers aren’t going to find some kind of [permanent] solution. So that sets them up a year down the road for more trouble.”
Over the past decade, states and localities have jumped at chances to increase their business with fast-growing China. U.S. merchandise exports to China increased by 177 percent between 2005 and 2015. Chinese investment in U.S. companies and properties went up exponentially over the same time period, from $2.5 billion in total investment across 24 states to nearly $63 billion spread over all but three states.
Admittedly, the growth represents only a tiny slice of overall U.S international business. Exports to China account for less than 8 percent of overall outbound U.S. shipments. Chinese foreign direct investment totals less than 1 percent of all foreign investment here.
Some regions, however, have more established business ties. When it comes to exports, Washington state-based businesses are by far the most exposed to fluctuations in China. Last year, Washington businesses exported $19.4 billion in goods to the Asian nation — about one-fifth of all the state’s exports. Over the past year, Washington’s dealings with China have been ratcheting down. Last year saw a 5 percent drop in exports to China; data through May of this year shows exports to China down by about 25 percent. Robert Hamilton, Gov. Jay Inslee’s trade adviser, says trade activity is being driven down from weak economies “everywhere — not just China.” Indeed, overall U.S. exports fell 5 percent last year, the largest decrease since the recession.
Still, Washington state’s exposure creates some concerns. Trade directly and indirectly accounts for one out of every four jobs in the state. Last year, Moody’s flagged it for being an at-risk state thanks to a slower China. This year, Moody’s has been careful not to sound apocalyptic about Washington state’s situation. “They’re pretty well insulated,” says Moody’s Washington analyst Kenneth Kurtz. But China-watchers in the state remain nervous.
Other regions in the U.S. will see an impact if China’s demand for consumer products wanes significantly. Computer equipment, for example, is a top export to China. Companies based in San Jose, Calif.; Boise, Idaho; and Austin, Texas, are the nation’s top producers of those products, and will feel a pinch if Chinese shoppers stop buying. Detroit and other regions reliant on auto manufacturing could also see a dip in business if China’s high demand for U.S.-made cars slows.
Chinese investment in the United States has grown rapidly over the past decade, although it has been concentrated on a limited number of targets. The vast majority of the investments from China have been in mergers and acquisitions. These ownership changes tend to grab headlines — like when Chinese insurance giant Anbang bought the Waldorf from the Hilton hotel chain for nearly $2 bllion last year. In most cases, new Chinese ownership does not change a company’s economic footprint. Hilton, for example, remains the Waldorf’s operator.
One other area where Chinese investment has had an impact is in so-called greenfield purchases. Those are investments where the parent company builds its operations here from the ground up, such as Yuhuang Chemical’s $1.85 billion methanol plant in Louisiana or Tranlin Paper’s $2 billion paper plant in Virginia, both of which broke ground last year. In the San Francisco Bay Area, which has long been a favorite of Chinese companies, more than one-quarter of greenfield investment value in the region comes from China, according to the Brookings Institution’s Joseph Parilla. Other top areas in the country for greenfield purchases are Chicago, New York City, San Jose and Seattle.
Most greenfield investments are typically made with a long-term view, so a Chinese slowdown like the current one might not have much immediate effect on them. It’s possible that a slower economy at home could cause Chinese companies to direct more new investment toward stable economies like the United States and away from riskier markets in emerging countries. But it’s also possible that a weaker economy at home could force Chinese investors to pull back in all world markets as foreign development becomes a more expensive proposition than the country’s corporations want to make.
From time to time, there are fears about a local real estate market in the United States “being gobbled up” by the Chinese and other private global investors. “If they all pull back, then all of a sudden, you’ve got this glut of really high-end real estate built for folks who are not necessarily in your metro area,” Parilla says, adding that this is something to watch in New York City and San Francisco, and to a lesser extent Chicago and Seattle.
For now, China is a lesson in perspective. Long isolated from the rest of the world, it has taken advantage of its rapid growth and fast-growing connections to other countries to become a major force in global markets. As state and local governments in the United States have become more enmeshed with the Chinese economy, opening offices in China to attract more direct development, they have increased their exposure. Fears about the effects of a prolonged Chinese downturn played a big role in the psychological contagion that roiled U.S. financial markets last year.
So far, most of the negative fallout in this country has been confined to a limited number of regions and economic sectors. But if the Chinese economy remains sluggish for a long period, the effects will be felt much more broadly by American investors and state and local governments. That is why even governments that haven’t felt the effects so far may want to train a wary eye on the fiscal picture in Beijing.
GOVERNING.COM
BY LIZ FARMER | AUGUST 2016
What sort of bonds should a municipality offer to the market? A generation ago, simple par bonds were the answer. Today, callable premium bonds are extremely popular, though they also impose burdens on both issuers and to the market in general. While there is something wild about these bonds, fortunately there may be a way to tame them.
Callable premium bonds now dominate the new issue markets. Coupons are set as high as 5% against much lower market yields. The bonds sell at a premium because they pay more interest than the market requires for a par bond. But will the high interest payments stop on the call date (price-to-call), or continue to maturity (price-to-maturity)? Fortunately for premium bond buyers, the price-to-worst rule means that they typically pay only the price-to-call, often much lower than the price-to-maturity.
The call option takes on a different character when it applies to a premium bond instead of a par bond. In either case, there is the “time value” of a possible, but not guaranteed, decline in future rates. However, options on premium bonds also have “intrinsic value” built into them from the outset. Callable premium bonds become immediate candidates for excellent savings from an advance refunding, or at least they would be, if not for negative arbitrage on escrow securities. Although immediate refunding after issuance is impractical, premium callable bonds are likely to be advance refunded well ahead of their call date to lock in savings.
Callable premium bonds are popular. The professionals involved in issuing bonds enjoy two rounds of fees. The high coupon protects investors against the danger that the price could fall through the “de minimis” threshold for market discount tax treatment. A callable bond can be an attractive (and higher yielding) substitute for a noncallable bond that matures on the callable bond’s call date. Savvy investors also expect a ratings upgrade from the eventual backing of a Treasury escrow.
The Case Against Callable Premium Bonds
When an issuer sells a callable premium bond, it receives the price-to-call instead of the higher price-tomaturity. The difference between these prices constitutes “lost proceeds” – the issuer cannot spend this value on a project. It is instead stored as intrinsic value in the call option. The call option can be liquidated later with a refunding for “savings” even if interest rates never drop.
While it is certainly pleasant to find savings, illusory savings do not serve an issuer’s constituents. The callable premium bonds make it virtually certain that the issuer will pay issuance expenses twice.
Certainty in the long-term funding costs for long-term assets is important for some issuers. Par bonds provide that certainty, while callable premium bonds place only a loose cap on costs. The ultimate debt service is only known when the bonds are refunded.
Callable premium bonds may have helped to drive out individual investors, who now comprise only a tiny part of the market. The bonds make it harder for investors to evaluate the fairness of quotes from their brokers. It no longer suffices to compare similar bonds of similar maturities. Benchmark yields near the call date can be more relevant to fair pricing than those near the stated maturity date. And it does not help that redemption information is often buried in the back pages of documents or on the secondary screens of electronic systems.
If callable premium bonds are driving out individual investors, support for the tax exemption could erode.
There may be regulatory risks. Given their fiduciary responsibility, municipal advisors should take care that a structure that practically requires the issuer to double their issuance costs is truly in their clients’ best interest. Regulators might also question whether these bonds confuse investors or inflate the supply of outstanding tax-exempt bonds.
In summary, the problems with callable premium bonds include that they:
A Solution
One way to mitigate the side effects of callable premium bonds is for issuers to diminish the importance of the options. For traditional par bonds, call options had time value – they were used only if interest rates fell, or if the issuer needed to restructure – but they had no intrinsic value at the time of issuance. Though options were important to bond pricing, they did not cause wild adjustments to prices.
Issuers can continue to sell callable premium bonds to meet the demand for premium bonds (to reduce the chance of triggering the market discount rule), while also preserving the traditional structural benefits of the call option. Rather than bury the intrinsic value in an option, only to extract it through a later refunding, the issuer can take the intrinsic value as immediate proceeds.
The key is to change the par call prices to premium calls in a way that equates the price-to-call and the price-to-maturity. This is possible because the price-to-call includes the present value of any call premium. To find a “breakeven” call price, set the premium on each call date to the amortized premium (as if the bond runs to maturity). This new call price matches the price-to-maturity at the original yield, with the call date replacing the settlement date.
Now return to the issuance date. The price to the premium call matches the price-to-maturity. The price-toworst rule has no effect if all call prices are set to their breakeven levels (the chart shows how the call prices will decline toward par for longer call dates). Now the issuer is fully paid for its entire debt service schedule.
A premium bond with a par call has complex dynamics, like the motion of a hinged pendulum. A premium bond with a premium call can behave more simply, like a par bond with par call. Where premium bonds with par calls are intermediate-term bonds disguised as long-term bonds, premium bonds with premium calls are true long-term debt. In today’s low rate environment, issuers would be wise to secure true long-term funding.
Premium bonds with breakeven premium calls offer the following benefits to the issuer:
Of course, there are always potential downsides and unintended consequences to new methods. One of these is that the market may not welcome bonds with large call premiums. As a first step, issuers could set call prices that begin at a modest premium and then decline to par.
Industry groups and leading issuers should consider this proposal. With time, premium call prices could become an accepted way to make premium bonds behave more like par bonds and to bring some clarity to the market.
The Bond Buyer
By Winthrop T. Smith
August 10, 2016
Winthrop Smith is the president of Win Analytics LLC, an independent research and consulting firm.
The United States faces a growing backlog of infrastructure repair and expansion projects. Many of the assets that propelled rapid economic growth and household wealth formation following the end of World War II have come to the end of their useful lives. In order to remain economically productive in the 21st century, government at all levels must increase infrastructure investment. The American Society of Civil Engineers estimates that, across all sectors, the United States needs to invest more than $3 trillion in the coming years. In the absence of a sustained commitment to rebuilding and expanding critical facilities, the United States will face an infrastructure drag that reduces economic productivity and access to opportunity for millions of Americans.
Historically, state and local governments have carried out public infrastructure finance through the issuance of municipal bonds. In recent years, a less traditional actor has entered the picture: Wall Street.
Specifically, investment managers have opened up funds dedicated to investing private capital in U.S.
infrastructure projects through public-private partnerships, or P3s. Public-private partnerships are an alternative form of infrastructure procurement that may include equity financing and a long-term maintenance and operations contract for the private concessionaire.
Liquidity
Public-private partnership supporters make two fundamental assertions about infrastructure finance in the United States that deserve scrutiny. The first is that one of the reasons why governments have been unable to invest sufficiently across sectors is a lack of liquidity. The term liquidity has several meanings. In the context of infrastructure finance, liquidity simply refers to access to financial capital. When lamenting the current state of infrastructure disrepair and promoting P3s as the solution, financiers frequently talk about the vast amount of private equity capital ‘sitting on the sidelines’ waiting to be invested in infrastructure. The implication is that if only state and local governments would undertake more P3 projects, this money would flow into the system and solve the infrastructure backlog.
Yet there is a reason why P3s with an equity component have been slow to emerge in the United States: Equity capital is a substantially more expensive source of project financing than municipal bonds. The cost of funds for equity capital can exceed highly rated municipal debt by a factor of five. Currently, there is more than $3.7 trillion in outstanding municipal debt. While not all of this debt was issued to build infrastructure, the volume of debt indicates that nonfederal borrowers have no problem accessing project financing; the municipal bond market is robust.
The single most important factor constraining overall government investment in infrastructure is not access to credit but rather insufficient government revenues. The problem is fundamentally political: The public has a finite willingness to pay the taxes and fees necessary to service project debts.
The borrowing behavior of state and local governments over the past 15 years demonstrates that tax revenues constrain indebtedness not a lack of investor demand. Between 2000 and 2008, total outstanding municipal debt increased by more than $2 trillion, or 138 percent. This number is significant for two reasons. First, the growth in municipal debt outpaced overall economic growth as measured by gross domestic product, or GDP. This reveals the tendency of governments to leverage even modest upward trends in tax revenues to borrow more through the bond market.
Second, the economy experienced a brief recession in 2001, losing 0.6 percent in economic output before returning to growth. Because the downturn was relatively short-lived, state and local governments chose to borrow money through the bond market to cover operating and capital needs as opposed to eliminating projects and substantially reducing services or raising taxes. From 2003 to 2004, total municipal indebtedness increased by $921 billion. In other words, the shallowness of the downturn combined with the expectation that growth and tax revenues would soon rebound fueled borrowing.
By comparison, the Great Recession demonstrated that a steep decline in tax revenues combined with indications that the recovery would be slow produced a significantly different borrowing behavior. Again, the issue was a dramatic drop in tax revenue as opposed to a shortage of market liquidity. The Great Recession resulted in a GDP contraction that was more than seven times greater than the downturn in 2001.
According to research from the Pew Charitable Trusts, state tax revenues declined by 13 percent in 2009 compared with baseline collections prior to the start of the Great Recession. As a result, between 2008 and 2015, total municipal debt increased by only $198 billion, or 6 percent. State and local governments understood that they would not have the revenues necessary to support another major round of borrowing and therefore held off on significantly increasing their overall indebtedness.
Importantly, investor demand for municipal debt held strong through both cycles. In fact, the demand for low-risk public debt continues to be so overwhelming that real interest rates on securities from the U.S. Department of the Treasury are currently negative over a seven-year period and less than 1 percent over a 30-year period; investors are paying the federal government to hold their money. The municipal bond market—as well as the Treasury securities market—does not have a liquidity problem.
This is not a claim about the soundness of buying and selling municipal debt as an investment strategy. The salient point is that the governments that build infrastructure projects have no trouble accessing capital markets. The reason that some observers see equity capital as sitting on the sidelines is that governments do not need equity debt to build their projects. What they need is revenue.
Understanding finance terminology
The claims that P3 supporters makes about liquidity raise an important point about terminology. Specifically, what does it mean to say that private capital is sitting on the sidelines ready to invest? For starters, this statement implies that traditional project financing involves something other than private capital. In reality, every dollar used to purchase municipal debt tied to a project is private capital being put to use to build America’s infrastructure.
This is not to say that municipal debt and equity are the same. In the finance world, the term equity typically refers to ownership in a company. When it comes to infrastructure, the government project sponsor retains ownership of the completed facility. Instead, project equity refers to a legal claim on a stream of revenues. For example, in the case of a toll highway project, an equity investor would have the right to a share of the stream of toll revenues over and above what is needed to repay senior project debts. Large infrastructure projects almost always involve multiple sources of debt financing. These may include debt from the TIFIA loan program, private activity bonds, or traditional municipal bonds. Once these senior debt holders have been repaid, the equity investors receive their share of toll revenues.
Equity investments are different from municipal bonds in three ways. First, project equity is not listed on a public exchange. By comparison, a municipal bond is a type of tradable fixed-income security. Second, the return that equity investors receive over time is subject to federal taxation. And third, the rate of return on equity can be variable, depending on the structure of the P3. In the case of a toll highway where the concessionaire assumes revenue risk, the ultimate rate of return on equity will depend on travel demand and overall toll revenues. Thus, while municipal bonds and equity investments have different characteristics, the important point is that both are private dollars financing infrastructure projects.
Simply stated: There are no sidelines.
Public pensions
The second assertion that P3 supporters make is that public-private partnerships have the potential to advance two disparate policy goals: strengthening workers’ retirement and building needed infrastructure projects. In reality, the low-volume of P3 transactions with an equity component means that infrastructure deals will not provide meaningful relief to public pensions.
Public pension funds face two significant challenges. First, pension funds are obligated to provide benefits to future retirees, a requirement for which they lack adequate funding. Second, due to the unique tax status of pension funds, investing in municipal debt is simply unattractive.
Unlike individuals and private corporations, pension funds are tax-exempt investors, meaning they have no federal income tax liability. The interest income from municipal bonds is not subject to federal income taxation. As a result of this favorable treatment, municipal bonds offer a lower interest rate than taxable corporate debt. Yet because this tax treatment provides no benefit to pension funds, the low rate of return on municipal debt makes this an untenable asset class.
By comparison, the equity component of a P3 infrastructure project provides a substantially higher return and therefore presents a more attractive vehicle for large institutional investors. While the return on equity varies by project and phase of development, the Federal Highway Administration cites a rate that ranges from 8 percent to 14 percent annually. Simply put, this rate of return dwarfs what is available through municipal bonds. Currently, AAA-rated bonds offer only 2.4 percent annually over a 30-year period.
As for unfunded liabilities, the numbers are daunting. As just one example, the California Public Employees’ Retirement System, or CalPERS, is a state agency that manages a large-scale pension fund on behalf of participating state and local public employees. Currently, CalPERS pays an average monthly benefit of $2,627 to 611,000 retirees and manages the contributions of another 1.2 million active and inactive employees.
The total value of the CalPERS fund stands at $293 billion—making it the largest public pension fund in the United States. While impressive, CalPERS faces a significant shortfall. The agency’s most recent financial statement reveals a total unfunded liability—the difference between the value of the fund’s assets and the assets necessary to meet future benefits payments—of $93 billion. To put that in perspective, the shortfall is greater than the individual GDP of 15 states, including Mississippi, New Mexico, West Virginia, and New Hampshire.
CalPERS is not the only public pension facing a shortfall. For instance, the California State Teachers’ Retirement System, or CalSTRS, estimates its unfunded liability at $72.7 billion. And the Colorado Public Employees’ Retirement Association, or Colorado PERA, estimates its unfunded liability at $25.9 billion. The Pew Charitable Trusts estimates that total unfunded public pension liabilities exceed $1 trillion nationally.
Given the magnitude of the shortfall facing public pensions, infrastructure investments—if they are to attract the interest of pension funds—must not only offer an attractive rate of return but also a sufficient volume of transactions to make meaningful progress in addressing outstanding liabilities. Public-private partnerships pass the first test but fail the second. For starters, not all P3 deals involve private equity financing. Second, when equity is used as part of project financing, it tends to account for only a small share of the total because it is so expensive relative to other forms of financing—namely, municipal bond debt and low-cost loans from the federal government.
A review of projects financed through the Transportation Infrastructure Finance and Innovation Act, or TIFIA, loan program at the U.S. Department of Transportation demonstrates the limited role of equity. Congress established the TIFIA loan program in 1998. Since its inception, the program has helped finance only 24 public-private partnership projects involving an equity component. Excluding the Chicago Skyway and Indiana Toll Road projects, which were lease transactions of existing facilities as opposed to new construction or reconstruction, the average equity investment is $183 million as part of a project with a total cost of $1.28 billion.
Using these averages, it is possible to develop an estimate of how many major P3 projects a pension fund such as CalPERS would need to invest in to reduce its unfunded liability by just 5 percent. As with any model, this relies on a number of assumptions, including:
First, CalPERS would almost certainly try to reduce portfolio risk by taking a limited share of equity in any given project. For example, assume that CalPERS would be willing to take a 20 percent position. Based on the average equity investment of $183 million derived from the TIFIA project list, a 20 percent share would translate to an investment of approximately $36.6 million. Second, investors expect an annual return of between 8 percent and 14 percent on infrastructure projects. Third, P3 concession contracts vary greatly, with some lease agreements stretching as long as 99 years. Assuming a more traditional 30-year term and a 12 percent rate of return, CalPERS would receive a return of $131.7 million. After applying a discount rate of 7.5 percent—which is the long-run rate of return that CalPERS assumes when projecting fund performance and calculating unfunded liabilities—CalPERS would receive a stream of payments with a net present value of $51.8 million. The net present value number is important because the $93 billion unfunded liability CalPERS reports is the amount of additional fund capital in 2016 dollars needed to meet future obligations.
In order for CalPERS to reduce its unfunded liability by just 5 percent, or $4.85 billion, the fund would need to invest in 90 infrastructure projects that offered terms equivalent to those assumed in the hypothetical case. In other words, CalPERS would need an enormous volume of P3 projects in which to invest and then have to take a significant position in every one of them in order to reduce its liabilities by even a small amount. If CalSTRS and Colorado PERA and others attempted to reduce their unfunded liabilities by an equivalent amount, the number of P3 projects would need to grow substantially. In fact, in order to reduce total unfunded public pension liabilities by 5 percent, pension funds—assuming they were able to collectively take a 100 percent position equivalent to the $183 million average equity share on every project—would need 193 projects with a total cost of $246.7 billion. This seems exceedingly unlikely, as TIFIA has provided financing assistance to only 24 P3 projects with an equity component in the past 18 years. While the TIFIA list is by no means exhaustive of the infrastructure sector, it provides a useful measure of the overall pipeline. According to research by Squire Patton Boggs—a global law firm that provides legal and other services to the infrastructure sector—only five P3 projects closed in 2014. Of this total, four were surface transportation projects.
Public-private partnerships are best suited to very large, complex projects for which it is more likely to be cost-beneficial for the state to pay the premium associated with risk transference. Yet, the very nature of infrastructure investment is that most projects do not meet the size and complexity threshold. In order words, the number of P3 projects will remain relatively low not due to regulatory barriers but the fact that the vast majority of small and medium-size projects don’t lend themselves to a P3 procurement model.
Beyond financing
Underlying everything from the smallest repair project to the largest new build is the unglamorous world of procurement—the process by which government buys goods and services. Traditionally, state and local governments have procured transportation facilities such as highways and bridges through a process referred to as design-bid-build. Under this approach, the state separates the procurement process into three distinct phases:
The traditional design-bid-build process involves two independent phases of project development that are carried out by separate private firms. First, one firm completes the design and engineering work and then hands this product off to the state. Next, that state uses these specifications to develop a request for proposals for the construction phase. Finally, following construction, the state assumes complete responsibility for the operation and maintenance of the facility. This includes everything from snow removal to reconstruction of deteriorated segments. In this way, a design-bid-build procurement model allows the state to retain control over each stage in the process.
A public-private partnership is an alternative approach to infrastructure procurement for large-scale, complex projects. Under this approach, the private firm exercises greater control and decision-making authority since the procurement stages are bundled together into one contract. From the government’s perspective, one of the key benefits of using a P3 approach is the ability to transfer risk. The nature of P3 contracts allows the public sector to transfer some or all of the project development, design, construction, operational, and revenue risk to a private entity. This is not a small benefit. After all, large infrastructure projects frequently take longer and cost more to complete than initially estimated. This benefit does not come cheaply. In exchange for accepting delivery or revenue risk over time, the private entity will require additional compensation.
In order to determine if the additional cost of transferring risk and working through the complexities of a P3 transaction are economical, state and local governments must engage in value-for-money analyses. For those projects that pencil out, P3s are a valuable alternative procurement strategy.
Conclusion
Public-private partnerships have been fundamentally miscast as a solution to a growing government funding deficit. In reality, P3s are an alternative form of procurement that offers government a way to manage risk. This may be especially appealing if a state or local government is attempting to develop a complex facility for which it has little experience letting contracts and overseeing delivery. Moreover, a long-term concession that locks in a private entity to providing a specified level of service or repair may help insulate a critical infrastructure asset from the vagaries of state budgets and recession. Provided that governments have the skill to negotiate effectively with their private sector counterparts in order to extract maximum value, P3s have a place in the U.S. infrastructure landscape. This will still leave, however, the politically challenging task of building support for the taxes and fees necessary to repay project debts, regardless of their source.
Endnotes and citations are available in the PDF version.
The Center for American Progress
By Kevin DeGood | Wednesday, August 10, 2016
Kevin DeGood is the Director of Infrastructure Policy at the Center for American Progress.
A majority of the 10 U.S. states with the most tax-supported debt outstanding have only a limited capacity to withstand the effects of a moderate recession, S&P Global Ratings found when it assessed their 2016-2017 budgets. The results of our scenario analysis underscore that fiscal health across the U.S. state sector is subject to the powerful countervailing effects of pro-cyclical revenue trends and countercyclical expenditure pressures. We have previously asserted that from a credit perspective states fare better when they leverage periods of economic growth to restore fiscal alignment and build budgetary reserves. This simulation affirmed our view.
Throughout 2016, we have described state fiscal health as uneven. Several states have yet to fully recover from the recession that ended in 2009 and some remain ill-equipped to withstand unanticipated fiscal stress. Others—because their economic and revenue bases depend on oil extraction—are mired in more acute fiscal stress brought about by the dramatic fall in oil prices. Complicating matters is that since 2000, state tax revenues have, to varying degrees, grown increasingly responsive to changes in economic performance.
Overview
09-Aug-2016
In this week’s episode, Managing Director Gabe Petek provides an overview of our recent report examining how 10 large states would be impacted by a hypothetical recession, and Senior Director Jane Ridley discusses our recent rating action on Detroit Public Schools.
Aug. 12, 2016
The fate of the prototype for Puerto Rico’s debt-restructuring effort hinges on winning an investment-grade credit rating on new bonds investors have agreed to accept in exchange for providing relief to the island’s main electric utility.
While that may appear to be an arduous task for an agency already in technical default, it may not matter in the long run, according to two people involved with the negotiations who declined to be identified because the talks are private. After two years of negotiations, creditors have too much at stake to let the Puerto Rico Electric Power Authority’s $9 billion restructuring unravel, they said.
What’s giving investors comfort is the structure of the new securities, which will be repaid with dedicated revenue that the agency known as Prepa doesn’t have access to and flows straight to the bond trustee. The island’s electricity commission approved in June a 3.10 cent per kilowatt hour surcharge that will go toward repaying the bonds.
“You have to be able to trust that the revenue stream is protected and it can’t be taken away and manipulated,” said Daniel Solender, head of municipals in Jersey City, New Jersey, for Lord Abbett & Co., which manages $20 billion of state and local debt, including Prepa bonds. “If that type of structure can be set up, than a lot of things are possible.”
Restructuring Template
In what would be the largest restructuring in the $3.7 trillion municipal-bond market, creditors holding about 70 percent of Prepa debt agreed in December to accept 85 cents on the dollar for the securities.
Analysts have pointed to the agreement as a road map for future debt talks once the financial control board being set up for the island by the U.S. takes effect later this year.
A junk rating doesn’t necessarily prohibit Prepa from restructuring, said Matt Fabian, a partner at Concord, Massachusetts-based Municipal Market Analytics. The utility would need to amend its creditor agreement, he said.
“Creditors still want to exit and a non-investment grade rating means that the economics are a little bit worse for everyone, but in the absence of any other good ideas, this is all they have,” Fabian said.
Prices of the existing securities suggest investors remain wary. Bonds maturing in July 2040, the agency’s most-actively traded security in the past three months, changed hands Aug. 5 at an average price of 65 cents on the dollar, 20 cents below the recovery rate, data compiled by Bloomberg show.
It’s unlikely that Prepa will receive an investment-grade rating after the commonwealth defaulted in July and August on general-obligation debt that was guaranteed by its constitution, said Dick Larkin, director of credit analysis at Stoever Glass & Co., who spent nearly 26 years assigning municipal credit ratings at S&P Global Ratings and Fitch Ratings.
“I don’t believe any kind of a securitized deal coming out of Puerto Rico can get an investment grade when the sponsor itself is breaking constitutional law,” Larkin said.
S&P has already told Prepa that its restructuring, as of now, wouldn’t garner an investment grade, Caribbean Business reported, quoting Carlos Gallisa, a utility board member who represents residential customers. Prepa said in response that it hasn’t started the formal rating process yet.
Rating Process
“While the outcome of the rating process cannot be predicted at this stage, Prepa maintains that there is a path to obtaining an investment grade rating for the securitization bonds and intends to continue working diligently and collaboratively together with its creditors and other stakeholders to implement the deal agreed as part of the restructuring support agreement,” Lisa Donahue, Prepa’s chief restructuring officer, said in a statement. “Prepa intends to start engaging with Moody’s and also start the formal process with S&P in the near future.”
“We continue to have strong confidence that the securitization bonds are well-positioned to receive an investment-grade rating,” Stephen Spencer, managing director at Houlihan Lokey, adviser to a group of Prepa bondholders, said in a statement.
Getting investors to trust that it won’t default on the new bonds no matter what the rating is still a challenge. Hedge funds and insurance companies are already suing Puerto Rico and its agencies over a local debt-moratorium law and for redirecting certain revenue that the creditors say go against commonwealth or federal laws. That’s even after the federal legislation authorizing the island’s overall debt restructuring included a stay on litigation.
Upgrade Potential
Investors also face the risk that the electricity surcharge may not be enough with a declining population and if customers fail to pay bills on time, Fabian said. Overdue accounts totaled $1.8 billion as of May, the bulk of that from government entities, according to the utility’s website.
Prepa and its creditors have been negotiating since August 2014 on how to improve the utility’s finances after it raided reserve funds to pay for fuel. Creditors agreed to accept losses and wait longer to be repaid to enable the utility to rehabilitate a system that relies on oil to produce electricity. The goal is for Prepa’s operating costs to decrease over time so that it can repay its obligations. That’s a risk that investors appear to be willing to take whether the new debt is rated investment grade or not.
“This is a financing that’s not impossible, and could season itself into an investment-grade security,” Fabian said.
Bloomberg Business
by Michelle Kaske
August 9, 2016 — 2:00 AM PDT
WASHINGTON — The Upper Mohawk Valley Regional Water Finance Authority received a green bond assessment of GB1 for $8.78 million of water system revenue bonds on Wednesday from Moody’s Investors Service — the first GBA the rating agency has issued in the U.S.
The GBA, which ranges from GB1 for excellent to GB5 for poor, is designed to help investors determine if green bond proceeds are being used to achieve “positive environmental outcomes,” said Henry Shilling, Moody’s senior vice president who has played a key role in the development and use of the GBA.
Moody’s rolled out the final methodology for the GBA, which is not a rating, at the end of March. Since July, the rating agency has assigned four GBAs, the first three of which went to European entities.
The Upper Mohawk Valley Regional Water Finance Authority bonds are to be issued soon to help finance an increase in the water system’s resiliency and the furtherance of its mission to provide safe drinking water to users. The authority is an instrumentality of New York State that serves 130,000 residents through 38,900 service connections in the eastern portions of Oneida and Herkimer counties as well as the city of Utica.
And Moody’s expects to see more green bond issuances in the future.
In a report on the sector issued about two weeks ago, Moody’s said global green bond issuance during the second quarter reached a new quarterly high of $20.3 billion, raising total volume for the first half of the year to $37.2 billion, an 89% increase over the same period a year ago.
The U.S. accounted for about 22.8% of the second quarter issuance and 19.8% of first quarter issuance, Moody’s said. U.S. Issuers in the second quarter were from Massachusetts, New York, California, Maryland, Indiana, Cleveland, Ohio, New Jersey, Rhode Island, and St. Paul, Minn.
“With strong issuance already observable in the first two weeks of the third quarter, the global green market is poised to reach $75 billion in total volume for the year and set a new record for the fifth consecutive year,” Moody’s said in the report.
“The green bond market is gaining traction,” Shilling told The Bond Buyer.
Up until this year, green bonds were rated by Moody’s based on their creditworthiness, Shilling said. But institutional investors that buy them, which include banks, insurance companies and pension funds, wanted the rating agency to begin assessing whether they were actually being used to improve the environment, he said.
Investors want to know, for example, whether bonds issued to finance a project that will reduce a carbon footprint and deter climate change or to improve water quality were really accomplishing those goals.
The GBA is part of a broader strategy at Moody’s to address environmental, social and governance risk more systematically and more consistently, Shilling said.
It is based in part on the disclosure practices of the issuer and borrower and how transparent they are. The GBA is determined according to five key factors: organization; use of proceeds; disclosure of the use of proceeds; management of proceeds; and ongoing reporting and disclosure on environmental projects financed or refinanced with the bonds.
In its rationale for giving the Upper Mohawk Valley Regional Water Finance Authority its GBA1 rating, Moody’s said the authority is effectively organized and properly staffed with qualified and experienced personnel.
The bonds, which are explicitly designated as green bonds in the draft official statement, are to be issued under the authority’s capital improvement plan to improve the water system’s infrastructure through increased capacity and dependability, Moody’s said.
About $4.05 million of the proceeds will be allocated to raw water transmission upgrades that will improve the authority’s ability to draw water from the Hinckley Reservoir during major droughts that lead to below-normal water levels in the reservoir.
Another $650,000 is to be used to design two new water storage facilities in Marcy as well as improvements to a water treatment plan in Prospect and upgrades to pumps and regulating stations.
The final $4.13 million will be used to refinance callable bonds previously issued in 1999 and 2000 for improvements.
The authority has disclosed information on these projects in its annual comprehensive financial reports and on its website in capital projects committee reports.
“The MVWA has committed to track the net proceeds of the 2016 bonds and will confirm that such proceeds were used to finance the projects,” Moody’s said in its release. “The MVWA is committed to providing disclosures that demonstrate the environmental benefits resulting from the planned expenditures of the 2016 bonds.”
The projects are expected to be completed within 12 months after they become available, the rating agency said.
“The first-year initial disclosure will indicate in detail how the proceeds were expended, the contractors performing the work and receiving payments, and the actual work that was completed,” Moody’s said in the release.
“Annual reporting will also include updates on four key metrics that at the same time link up to base line disclosures that permit comparative analysis,” the rating agency added. “These include reservoir water levels versus transmission capacity, conveyance of purified potable water during the year, trihalomethane levels and the total amount of hydroelectric power produced by the turbines within the water treatment facility.”
The Bond Buyer
By Lynn Hume
August 10, 2016
Municipal-bond investors in Illinois, Pennsylvania, New Jersey, and Connecticut have good reason to be worried.
The states are among those that S&P Global Ratings has deemed to have “only a limited capacity” to withstand the effect of a moderate recession, according to a report published by the credit-ratings company.
The report, titled “Fiscal Resilience Among U.S. States Varies As Economic Expansion Surpasses Seven-Year Mark,” found that a majority of the 10 states with the most tax-supported debt outstanding have a limited ability to handle the effects of an economic downturn, judging by stress tests S&P conducted on their 2016-2017 budgets. States are better off by leveraging periods of economic growth to build reserves, S&P concluded.
“The results of our scenario analysis underscore that fiscal health across the U.S. state sector is subject to the powerful countervailing effects of pro-cyclical revenue trends and countercyclical expenditure pressures,” said credit analyst Gabriel Petek.
Of the 10, S&P found that Illinois, Pennsylvania, New Jersey, and Connecticut are the most vulnerable to significant fiscal stress. Washington, Florida and New York are best-positioned should the economy turn south, the report said. California, Massachusetts, and Wisconsin rounded out the list of those states evaluated.
Bloomberg Business
by Molly Smith
August 9, 2016 — 6:35 AM PDT
Investors are flocking to securities that shield the risks of hurricanes, pandemics and hackers; reinsurers are suffering
Catastrophe bonds were invented in the early 1990s to help insurance companies mitigate the risk of disasters such as hurricanes and earthquakes. Today, like the very storms they protect against, catastrophe bonds are upending the insurance business.
The oddball securities have exploded in popularity, driven by pension plans, sovereign-wealth funds and wealthy families seeking better returns. Investment banks and insurers’ own securities-brokerage operations churn out billions of dollars a year in catastrophe bonds.
There are “cat bonds” that pay off if too many people die in a pandemic. Others cover the opposite problem of people living beyond their expected lifetimes. An American International Group Inc. unit sold cat bonds this spring to insure itself against a potential rash of foreclosures. A Credit Suisse Group AG bond sale in May insured the Swiss bank against the risk of rogue traders, cyber hacking and accounting fraud.
Traditionally, insurers raise capital and use it to back policies that are priced by the companies’ actuaries. To unload some of their risk, insurers pay premiums to companies known as reinsurers, a low-profile corner of the industry that serves as insurance for insurers.
Catastrophe bonds have disrupted this way of doing business. The bonds are sold by insurers or the entity itself seeking insurance, like a local government or transit agency. An independent risk-modeling firm calculates the odds of a particular disaster occurring. Investors are paid relatively high interest rates but lose their principal if disaster hits.
As a result, the price of reinsurance is falling, as are profits. These bonds have also injected a new source of volatility into the otherwise staid insurance world, since money flows are driven by broader forces in the bond market.
In all, there are $72 billion of cat bonds and similar investments outstanding. The total is equivalent to 12% of the $565 billion in capital in the reinsurance business. The volume of cat bonds and related investments is widely expected to double in the next several years, a sign that the transfer of risk from the insurance industry to capital markets has opened up access to a seemingly limitless source of funding.
That means the fixed-income market “is acting like one giant insurance company,” says John Seo, a biophysics Ph.D. and former insurance-risk trader who co-founded Fermat Capital Management LLC in 2001 to invest in cat bonds and other securities.
The surge is partly an unintended consequence of economic-stimulus efforts by central banks. Low interest rates are pushing investors such as pension funds to seek out higher returns.
Ordinary bonds pay buyers interest to cover the risk of default by the issuer. With cat bonds, the payments compensate buyers for taking on the risk of extreme events, typically for several years.
United Services Automobile Association sponsored $250 million of cat bonds in May to help cover potential losses from U.S. storms, wildfires, meteorite strikes and a solar flare. Companies usually sell the bonds through a specially formed entity.
If any of those disasters occurs in a four-year period and causes losses at USAA of between $910 million and $1.2 billion, buyers of the deal’s riskiest slice will lose some or all of their money, according to a person familiar with the deal. An independent risk-modeling firm calculates the probability of a $1.2 billion loss at 7.6%.
In return, those investors will earn 11.5% a year, plus interest on their principal held in escrow, which is invested in Treasurys. Investors buying the least risky slice, which kicks in only if claims exceed $1.9 billion, will collect annual interest of 3.25%.
Premiums for reinsurance covering catastrophic property damage, reinsurers’ largest business line, is down by half since 2011, according to Bryon Ehrhart, a senior executive at insurance broker Aon PLC, in part because of this new flood of money. A multiyear streak of no severe U.S. hurricanes is compounding the pressure.
Citizens Property Insurance Corp., run by the state of Florida, used a mix of cat bonds and conventional reinsurance to buy $3.9 billion in coverage last year, up 20% from 2014. Citizens also paid less: about $282 million in 2015, compared with $304 million a year earlier.
Such savings are a boon for Florida residents such as Greg Truax of Tampa. When he opened this year’s policy-renewal package from Homeowners Choice Property & Casualty Insurance Co., he saw that his premium had fallen 5.7% from a year earlier, saving him $233.
Dulce Suarez-Resnick, an agent at NCF Insurance Associates in Miami, says lower rates have been a “lifesaver” for clients rebuilding their finances following the financial crisis and recession.
Sawgrass Mutual Insurance Co. has cut the annual premium on Ms. Suarez-Resnick’s own house by $484, or 15%, since 2013. “Thank God the rates started to go down to make it more affordable,” she says.
Warren Buffett, whose Berkshire Hathaway Inc. owns some of the biggest reinsurers, had a different reaction. Mr. Buffett used to brag about the scale and profitability of the business.
At last year’s Berkshire annual meeting, Mr. Buffett complained to shareholders that reinsurance has become “a fashionable asset class.” Faced with lower prices and poor returns, Berkshire is doing fewer deals.
Mr. Ehrhart, the Aon executive, says he used to call the profit squeeze “the battle of six and 16.” Reinsurers historically aimed for returns of 16% a year. The pension funds snapping up cat bonds are happy with just 6%.
By last year, though, the overall return of reinsurers tracked by Fitch Ratings had fallen to 9.9%.
Over the past decade, yields on cat bonds have outpaced junk-rated bonds by half a percentage point and high-quality securities by more than three points.
Catastrophe bonds were born after Hurricane Andrew cut across southern Florida in 1992 and left roughly $25 billion in damage in today’s dollars. At the time, Andrew was the costliest hurricane ever.
German insurance executive Eberhard Müller had a brainstorm while riding the London subway in 1993. He wondered if some of the financial risk from hurricanes and earthquakes could be shifted to bond investors.
Mr. Müller and a colleague at Hannover Re, Dirk Lohmann, were working on ways to build up the reinsurer’s capital base so that the German company could take advantage of rising rates. Some of their bosses worried about opening up the lucrative business to Wall Street and asked: “Are we opening Pandora’s box?”
Mr. Lohmann replied: “If we don’t do this, somebody else will.”
With help from the bank now known as Citigroup Inc., Hannover pitched to investors a bond called “Kover,” a mashup of the German word “katastrophe” and “coverage.” Mr. Lohmann toted an extensive presentation and pitchbook. Details such as mathematical formulas demanded by lawyers were spelled out in two thick binders that the deal’s team called “the Bible.”
Mr. Müller, who retired from Hannover in December and now runs his own consulting firm, expected investors to sign up for the cat-bond deal immediately. It took months, and the $100 million deal was downsized to $85 million.
Mr. Lohmann called it “the roadshow from hell.” He now leads Secquaero Advisors Ltd., which advises asset manager Schroders PLC on cat bonds.
Sales of cat bonds proceeded haltingly until the financial crisis. The bonds as a class had a return of 2.65% in 2008, according to Lane Financial LLC. The U.S. stock market slid nearly 40%, and U.S. corporate bonds posted negative returns.
The crisis also ushered in the ultralow interest rates that sent big investors scrambling for higher yields.
When executives with Florida’s Citizens Property Insurance began marketing a $400 million cat bond in 2014, they realized during their 11-day roadshow they could blast past that target.
“We kind of joked around: ‘How big do you think it will get?’ ” recalls Jennifer Montero, Citizens’ finance chief. “We thought it would be cool if we could do $1 billion.” Orders totaled a whopping $1.74 billion. Citizens’ board of governors decided $1.5 billion was large enough to meet Florida’s needs.
Cat bonds aren’t the only option for investors. Some favor “sidecars” and “collateralized reinsurance,” arrangements that allow reinsurers to directly share some of the risk on their books with investors. Also popular are smaller “cat bonds lite,” or deals with less documentation.
Demand has been so high that some executives, analysts and investors worry that returns are starting to suffer from the flood of issuance. Cat bonds returned 4.2% in 2015, according to Lane Financial. That is less than half the 8.8% annualized return by the Swiss Re Cat Bond Global Total Return Index since 2006.
Another risk is several major hurricanes hitting just as interest rates rise. The resulting losses could deplete reinsurers’ capital and drive many cat-bond buyers out of the market at the same time.
“You have a double whammy,” says Thomas Leonardi, a senior adviser at investment bank Evercore Partners Inc. and former Connecticut insurance commissioner. “How will the market react?”
Still, he believes cat bonds are here to stay. Brokers say hundreds of pension funds around the world own cat bonds or want to buy them. Pension funds typically allocate $50 million to $200 million to such investments, or as much as 2% of their total assets.
At an insurance conference in June, Rod Fox, chief executive of strategic reinsurance and capital adviser TigerRisk Partners LLC, pointed to a slide of a waterfall. “How do you stop that waterfall?” he said. “It will continue to come.”
Some companies are starting to obtain insurance by issuing notes directly to bond investors. Last year, Amtrak sponsored $275 million of cat bonds that will pay out if specified storm surges, winds or earthquakes hit the Northeast during a three-year period.
Phil Balderston, Amtrak’s director of risk management, said at a recent conference that it was hard for the passenger railroad to get enough traditional insurance coverage.
Amtrak’s cat bonds were oversubscribed because investors had ample Florida hurricane risk in their portfolios and wanted to diversify their exposure.
Some reinsurers have responded by creating their own direct investment opportunities. Axis Capital Holdings Ltd. is using money from such investors to help insure corn, soybeans, wheat and cocoa against bad weather, says Albert Benchimol, the specialty insurer and reinsurer’s chief executive.
“The halcyon days of easy underwriting profits and steady investment returns are in the rearview mirror,” he adds.
THE WALL STREET JOURNAL
By LESLIE SCISM and ANUPREETA DAS
Updated Aug. 8, 2016 4:46 p.m. ET
Write to Leslie Scism at [email protected] and Anupreeta Das at [email protected]
About the Report
The municipal bond credit report is a quarterly report on the trends and statistics of U.S. municipal bond market, both taxable and tax-exempt. Issuance volumes, outstanding, credit spreads, highlights and commentary are included.
Summary
According to Thomson Reuters, long-term public municipal issuance volume totaled $119.0 billion in the second quarter of 2016, an increase of 24.5 percent from the prior quarter ($95.5 billion) and an increase of 7.3 percent year-over-year (y-o-y) ($110.9 billion). Including private placements ($3.0 billion), long-term municipal issuance for 2Q’16 was $108.7 billion. Year to date ending June 30, municipal issuance totaled $214.5 billion, well above the ten-year average of $190.6 billion although nearly unchanged from last year’s year to date issuance of $214.5 billion.
Tax-exempt issuance totaled $104.9 billion in 2Q’16, an increase of 19.0 percent and 4.8 percent, respectively, q-o-q and y-o-y. Taxable issuance totaled $6.8 billion in 2Q’16, an increase of 3.8 percent q-o-q but a 14.4percent decline y o y. AMT issuance was $7.3 billion, an eightfold increase q-o-q and a 153.7 percent decline y-o-y.
By use of proceeds, general purpose led issuance totals in 2Q’16 ($28.7 billion), followed by primary & secondary education ($21.0 billion) and higher education ($11.4 billion).
Refunding volumes as a percentage of issuance fell slightly from the prior quarter, with 49.7 percent of issuance attributable to refundings compared to 52.6 percent in 1Q’16, but was unchanged from 2Q’15.
August 11, 2016
Companies and government agencies are calling bonds at the fastest pace in four years
Bond issuers are heeding the call of tumbling interest rates.
Companies and government agencies are “calling” bonds at the fastest pace in four years, taking advantage of provisions that let them redeem securities under certain circumstances and save money by reissuing at lower rates.
Redemptions hand investors their money back at a time when many portfolio managers are struggling to find attractively priced securities to purchase. Some investors now are paying up for so-called noncallable bonds that don’t give the issuer a redemption option.
The trends are particularly acute in the markets for bonds sold by government-sponsored enterprises such as the Federal Home Loan Banks, Fannie Mae and Freddie Mac, companies that provide financing to the mortgage market. Investors have had almost $248 billion in callable GSE debt redeemed this year through July, according to Performance Trust Capital Partners LLC, a fixed-income trading firm. GSE calls in the second quarter hit $125 billion, the most since 2012.
“We’ve seen lots and lots of callable bonds,” said Andrew Pace, a vice president at the firm. “It’s interesting to see how different returns can be with that call feature.”
The FHLB sold debt in both formats in July 2015, offering coupons of 2% on callable bonds and 1.875% on noncallable ones. The callable debt was redeemed in July of this year, giving investors an annual return about 2%. The noncallable debt returned 4.3% during that year, according to Performance Trust data, reflecting the price increase as investors snapped up noncallable debt.
In July of this year, the FHLB issued new callable bonds, offering a coupon of 1.32%. Hypothetically, that means it stands to save about $6.8 million in interest costs for every $1 billion in debt. That assumes one bond was issued to replace the other, which isn’t necessarily the case.
Calls are growing more popular throughout the bond market. Mr. Pace said 59% of GSE debt sold in the last quarter of 2015 has already been called. Global corporate issuers have called more than $300 billion, including roughly $90 billion in U.S. corporate bonds, according to Performance Trust.
The large amount of calls comes as the yield on the 10-year Treasury note has fallen more than half a percentage point since the end of last year. It touched the lowest on record last month.
Still, some investors are using calls as an opportunity to bulletproof their portfolios in case rates rise. Craig Brothers, who manages about $3 billion of mostly municipal bonds at Bel Air Investment Advisors in Los Angeles, said that many of his holdings that are eligible to be called have already been redeemed.
“The calls are helping us,” Mr. Brothers said. “Getting the money back is essentially allowing us to take that money and redeploy it” in investments that are less sensitive to rising interest rates.
THE WALL STREET JOURNAL
By BEN EISEN
Aug. 8, 2016 11:55 a.m. ET
Write to Ben Eisen at [email protected]
Plunging global interest rates have made borrowing cheap, but many are struggling with sluggish revenue growth and higher expenses
Wall Street is urging governments to invest in big-ticket infrastructure projects. Voters and public officials have a different message: not so fast.
Plunging global interest rates have made borrowing cheaper than ever. But instead of spending on aging roads, bridges and buildings, many state and local governments are scaling back.
New government-bond issues have dropped to levels not seen in the past 20 years. Municipal borrowers issued about $140 billion in bonds for new projects last year. Adjusted for inflation, that is 53% lower than in 2006 and 21% lower than in 1996. So far this year, municipalities have borrowed $95.1 billion, about $10 billion more than at this time last year.
Seven years after the recession ended, voters and government officials remain scarred by the deep budget cuts they endured at the height of the financial crisis and the sluggish revenue growth that has constrained spending since then.
“The collapse in interest rates corresponded with the recession and with a political trend toward antitax sentiment,” said Dan Seymour, an analyst with Moody’s Investors Service. ”Even as state and local governments are looking at lower bond yields, they are facing a public that is reluctant to pay more taxes.”
As a share of the economy, state and local governments are investing less in capital projects than they have since the early 1980s, according to Commerce Department data.

Last week, Hawaii became the latest state to pare new highway construction after legislators turned down a gas-tax increase.
In May, California transportation officials announced a 28% cut to construction plans between now and 2021. New public-sector borrowing in the state last year dropped almost 40% from 2009.
Florida officials went five years without approving any new borrowing by the state’s main construction program for public schools and universities despite a long list of projects. When the legislature and governor finally signed off on new borrowing again in March, they limited the new debt to $275 million, down from $1.4 billion in fiscal 2007.
“Our governor is a debt hawk,” said Ben Watkins, Florida’s director of bond finance.
Governments have reported significant drops in borrowing costs while their ratings have remained unchanged. Barclays PLC’s municipal-bond index, which is a gauge of municipal-debt yields, this summer reached a 20-year low of 1.6%, compared with about 4.2% in summer 2006.
Wall Street executives are calling for investments in infrastructure. J.P. Morgan Chase & Co. CEO James Dimon cited a “need for good, long-term infrastructure plans” in a letter to shareholders this year, echoing economists’ sentiments.
Asset managers that invest in municipal bonds too would like to see increased issuance, because the additional supply could force governments to pay more to entice purchasers, driving up yields.
State and local governments are carrying about the same amount of debt as they were when they emerged from the recession, in part because tax revenue has been slow to rebound.
S&P Global Ratings analyst John Sugden said that in many places, the hesitation “reflects good budget management” by governments whose revenue projections leave no room for additional debt payments or upkeep costs for newly constructed projects.
On the other hand, he said, forgoing timely repairs to existing structures could drive up costs in the long run.
A McKinsey Global Institute study released in June found the U.S. should boost infrastructure spending by 0.7% of its gross domestic product between now and 2030 to meet transportation, water, power and telecommunications infrastructure needs. Doing so this year would mean roughly $129 billion in new spending.
Many struggling legislatures and city halls are instead focusing on underfunded employee pensions and rising Medicaid costs. Some cash-strapped areas, such as Puerto Rico and the city of Chicago, face high annual debt payments.
Federal grants to state and local governments for capital investment are expected to total less than $68 billion in 2016, according to data from the Office of Management and Budget. They hovered around $80 billion in the early part of the last decade and surpassed $90 billion in the aftermath of the recession. Estimates are in 2009 dollars.
State tax revenue, meanwhile, isn’t expected to bounce back soon. The National Association of State Budget Officers estimates state spending will rise 2.5% in fiscal 2017, down from 5.5% in 2016 and 4.2% in 2015.
“There aren’t a lot of additional dollars to go around to spend on infrastructure, transportation and other areas of the budget,” said Brian Sigritz, director of state fiscal studies for the association.
Many states require a voter referendum before taking out new loans. That means political considerations often matter more than interest rates when governments consider a new round of borrowing.
Voters in Wisconsin school districts have rejected 40% of ballot questions seeking to issue debt over the past 10 years, according to the Department of Public Instruction.
The 1,300-student Dodgeville School District, about 45 miles outside Madison, scrapped plans to build a $34 million high school in 2014 after voters roundly rejected a $48 million borrowing referendum. This April, the district gained approval for a roughly $20 million proposal to expand the existing high school.
Among the improvements the district decided to forgo was a second gym. “We need that, but it was perceived to be a want, rather than a need,” said District Administrator Jeff Jacobson.
THE WALL STREET JOURNAL
By DAVID HARRISON and HEATHER GILLERS
Aug. 7, 2016 5:30 a.m. ET
Write to David Harrison at [email protected] and Heather Gillers at [email protected]
Public entities have recently been looking for new ways to harness right of way (ROW) for broadband public-private partnership (P3) projects. Last year, the city of Santa Cruz made history by entering into a roughly $50 million P3 with local Internet service provider Cruzio to deliver 1-gigabit broadband access to every property in the city’s jurisdiction. Construction began this month. San Francisco is now considering pursuit of a similar P3. On the other side of the country, the Pennsylvania Turnpike Commission (“PTC”) recently released requests for proposals for legal and financial services for a broadband network P3 along the Turnpike right of way. The State of Kentucky entered into a 30-year P3 in 2015 with a private consortium with the goal to build a middle-mile broadband network to promote economic development, education and research capabilities, public safety, healthcare delivery and connectivity for libraries and communities.
The Santa Cruz and PTC P3 projects offer a study in contrasts. These two projects are using the P3 delivery model to meet different goals. Santa Cruz is using a P3 to expand broadband service within the municipality where the public will benefit from improved internet service and the private partner will benefit from increased business. The city plans to fund the project through a municipal bond backed by the future revenues from the service. Santa Cruz will own the network and Cruzio will operate it, paying the city rent.
While some of the details are unclear, it appears that the PTC is pursuing a shared resource model for its broadband P3. The PTC will make ROW available for a broadband fiber optic backbone with a WIFI overlay in exchange for dark or lit capacity (conduit alone or conduit plus service, respectively). The public benefit from this model is the increased service and capacity of the network for agency needs, and the private benefit is the ability to build and run a major backbone fiber optic system while avoiding right of way rental fees. In essence, the shared resource model allows a public entity to leverage private investment within its ROW to receive broadband capacity in return.
The economic beauty of the shared resource model lies in the fact that the incremental cost to the broadband provider of delivering backbone capacity to the public agency is a fraction of the value of that capacity to the agency and a fraction of the rental value for the right of way. For this low incremental cost, the broadband provider delivers value equal to or greater than the fair market rent that the public agency would otherwise charge. A true win-win.
As public entities continue to pursue broadband P3 projects, they must carefully assess and allocate the respective roles and responsibilities of the public and private partners. In addition to the design, construction, finance, and operations/maintenance of the broadband infrastructure, public entities must also consider how the telecommunications service will be provided and how it will be marketed. Unsurprisingly, how these roles and responsibilities ought to be allocated will depend on the government’s objective. Project success depends on tailoring the delivery model to these objectives and financial constraints.
For this reason, the Santa Cruz P3 is going to allocate roles and responsibilities differently from the project the PTC is pursuing. The PTC is not seeking to provide last-mile internet service as a utility to a broad citizenry, as Santa Cruz is. Instead, entering into a broadband network P3 will provide the PTC and the Pennsylvania Department of Transportation improved network connectivity through lit capacity for these agencies’ own needs along the Turnpike’s 550 miles of right of way.
Under the utility model, the public agency usually owns and maintains the fiber network and the private entity usually designs, constructs, administers, and markets the project and its resulting Internet service. Financing may be done by either or both parties. This model can scale and fund the project in one of two ways—first, as a ubiquitous system with a corresponding basic “utility” charge to all residents to finance the project with a corresponding option for each resident to enter into an individual contract with the Internet service provider, or second, on a pay-as-you-go basis that would be less expensive initially but would not provide ubiquitous service. San Francisco is grappling with these choices in its own quest to provided 1-gigabit services throughout the city and county.
This allocation of roles does not necessarily make sense for a broadband P3 project like the PTC’s. The public agency does not need to own, operate or maintain the backbone system in order to attain its objectives. It merely needs the rights to its allocated capacity from the larger system. The broadband provider needs to finance, build, operate/maintain and market the rest of the system in order to generate revenues and profit from its capacity.
The Institute for Local Self-Reliance recently published a report addressing many of these issues, ultimately concluding that successful broadband P3s are structured in a way that provides meaningful benefits and control for both the public and the private entities involved. Public entities interested in pursuing broadband P3s must weigh the unique risks and rewards associated with such an arrangement and carefully allocate control to deliver a project that will succeed. As has been clear from the Santa Cruz and PTC cases, how broadband P3s are structured may vary greatly in order to tailor the P3 delivery model to different objectives and financial circumstances.
Nossaman LLP
by Fredric W. Kessler and Shant Boyajian
August 1, 2016
Green Bonds have led a tremendous growth in environmental finance over the past five years, but that growth has been heavily-weighted towards investment grade credits with their accompanying risk/return. The predominance of investment-grade credits partially results from the all-or-nothing approach of Green Bonds – the bond is either 100% green or 0% green. The 100% green requirement shuts out many issuers seeking to finance environmentally-sustainable projects because a company needs to be sufficiently large and well-capitalized to be able to issue bonds of a sufficiently large principal amount solely for environmental purposes. Most types of bonds require a minimum principal amount to ensure secondary market liquidity, roughly speaking the equivalent of $200 million. This especially shuts out smaller and more highly leveraged companies.
To diversify Green Bonds, it may be possible for investors to rely on a promise from issuers to use a specified portion of the proceeds of a bond for environmental purposes. Currently, an issuer seeking to finance $100 million in environmental capital expenditure would be unable to obtain a “green” credential. But if that issuer were to raise $100 million for conventional purposes and $100 million for environmental purposes in the same issuance, the issuer should be able to label its bond as 50% green. Rather than all green or all non-green, the bond is “Green Striped.”
To read more about “Green Striping”, click here.
If you found this interesting, you might also enjoy:
Green Bonds Need a ‘Big Tent’ Approach
What Is The Future of High-Yield Green Bonds?
Latham & Watkins LLP
by Aaron Franklin
USA August 1 2016
This article is made available by Latham & Watkins for educational purposes only as well as to give you general information and a general understanding of the law, not to provide specific legal advice. Your receipt of this communication alone creates no attorney client relationship between you and Latham & Watkins. Any content of this article should not be used as a substitute for competent legal advice from a licensed professional attorney in your jurisdiction.
WASHINGTON – The par amount of municipal trades reached the highest level in nearly three years during the second quarter of 2016, showing a rebound from significant declines in the second half of last year, according to Municipal Securities Rulemaking Board statistics posted Wednesday.
The total par amount traded in the second quarter was $818.2 billion, an increase of 10.4% from the $741.4 billion in trading the year before and the highest volume since the MSRB recorded a total par amount of $825.4 in the third quarter of 2013. The increase follows total recorded trading by par amount of $634.7 billion in the first quarter of the year.
Michael Decker, managing director and co-head of munis with the Securities Industry and Financial Markets Association, said the biggest factor that affects trading volume is issuance volume because bonds tend to trade more actively after they are issued.
“The second quarter of 2016 was a strong quarter for issuance,” he said. “That was probably a significant driving factor in why trading volume ticked up.”
He added that even with the increase, trading volume is still down significantly from before or during the financial crisis as yields remain low.
“It is hard to get investors excited about bonds at the current level of yields,” Decker said.
Matt Fabian, a partner with Municipal Market Analytics, said the upward trend in trading volume shows that the market has largely found its footing again.
“There was less worry about [Federal Reserve Board] action and I think that the market was more comfortable with the prospect of yields staying lower for longer,” Fabian said about the MSRB 2016 data.
The corresponding decrease in total number of trades during this year’s second quarter, 2.34 million compared to 2.56 million a year before, shows that there’s more follow through in the immediate secondary market, where bonds are less fragmented than they generally become over time as they move more to retail investors, Fabian added.
The decrease in total trades also shows the continuation of the trend toward institutional investment in the muni market and the industry’s transition away from individual bondholders each having their own accounts and personally directing how their money is spent, he said.
“It’s been a steady move in the industry toward managed money either through separately managed accounts or mutual funds,” Fabian said.
The MSRB data also shows that customer buying activity increased to $6.44 billion in the second quarter of 2016 compared to $5.96 billion in the second quarter of 2015. The average daily number of trades of customer purchases decreased to 14,484 in the second quarter of 2016 compared to 17,009 the year before.
The most actively traded muni by par amount in the second quarter this year was a 2007 tobacco settlement asset-backed bond issued by the Golden State Tobacco Securitization Corp. The MSRB data shows a par amount of $4.7 billion of the bonds with 68 trades during the quarter.
The most actively traded bond by number of trades was a hospital revenue refunding bond from the West Virginia Hospital Finance Authority that had 1,464 trades with a par amount of $123.6 million. The refunding bonds were issued this year.
Variable rate demand obligation rate resets continued a steady decline in this year’s second quarter with only 120,725 recorded. That compares to 135,504 in 2015’s second quarter, about a 12% decrease.
The Bond Buyer
By Jack Casey
August 3, 2016
A volatile stock market over the past year has taken a toll on public pension assets.
Public pension plans are reporting dismal investment returns this year, a development that will likely mean governments will have to pony up more money in the coming years.
So far, no major pension plan has reported a preliminary annual investment return of more than 1.5 percent. That’s thanks to a volatile stock market that’s seen wild swings spurred mainly by political and economic events abroad. Some smaller plans, such as the New Mexico Educational Retirement Board, have reported earnings as high as 2.6 percent. Still for many, this year marked their worst earnings year since the Great Recession.
The slim earnings for fiscal 2016, which ended June 30 for most plans, is well below the average earnings target of about 7.5 percent. It also marks the second year in a row that plans have missed the assumed rate of return: Most reported an investment gain between 2 percent and 4 percent in fiscal 2015.
Plans rely heavily on investment earnings — roughly 80 cents on every dollar paid out to retirees is from investments. When plans don’t meet their earnings target in any given year, it negatively impacts their assets because annual payments from current employees and governments aren’t enough to cover the annual payouts to retirees.
The nation’s largest pension plan, for example, reported a preliminary investment return of 0.6 percent for fiscal 2016. The meager return means that the California Public Employees’ Retirement System (CalPERS) ended the year with $295 billion — about $7 billion less than a year ago.
Meanwhile, pension liabilities aren’t improving and, in some cases, are actually increasing. Public pension plans nationally were nearly 74 percent funded in 2015 with more than $1 trillion in unfunded liabilities. “Clearly this is going to generate some fresh unfunded liabilities,” said Tom Aaron, a senior analyst at Moody’s Investors Service.
Even an investment return of 5 percent for the year would increase plans’ overall liabilities by 10 percent, according to a Moody’s analysis of 56 major public pension plans. “This comes at a time,” Aaron added, “when state and local governments are already dealing with heightened contribution requirements to amortize past unfunded liabilities.”
With two bad years in a row, any pension funding gains made in 2013 and 2014 — when many pensions earned double-digit returns — have essentially been wiped out.
Other plans across the country are reporting similar preliminary results to CalPERS. The California State Teachers’ Retirement System reported a 1.4 percent return, resulting in a decline of $3 billion in assets. New York State’s pension fund, which closed its fiscal year on March 31, reported a 0.2 percent investment return. Its total assets declined by about $5 billion. San Diego County’s $10.2 billion pension fund claimed a 0.5 percent return. And the Oregon Investment Council reports the state’s public employees’ plan has logged a 1.24 percent return for the year.
The main culprit for the poor performance was investment losses in domestic and global equities. Since August of last year, the stock market has swung wildly — twice thanks to bad economic news from China, and more recently due to uncertainty around Britain’s decision to leave the European Union.
Another issue is that pension plans are relying less on more stable but low-yield investments like bonds. Instead, they rely more on potentially higher-yield investments in public and private equities. It hasn’t paid off: The median annual return for public pensions over 20 years is expected to hit about 7.5 percent for the 2016 fiscal year — the lowest point in more than 15 years — according to a recent estimate from the Wilshire Trust Universe Comparison Service.
June and July, however, have been marked by stock market gains. By the time CalPERS released its investment return data in July, assets had crept back up to about $302 billion — roughly where they were a year ago.
Either way, governments will likely have to budget more in the coming years to cover expected shortfalls. The New York state controller recently warned New York City it might have to pony up at least $100 million in additional pension payments starting in 2018 if the city’s fund continues to post low earnings. In Oregon, the state’s pension actuary projected it would have to pay $885 million more in total pension costs next year thanks in part to low earnings but also because it lowered the plan’s assumed rate of return to 7.5 percent.
Many other plans are also taking steps to gradually lower their assumed rate of return, said Cathie Eitelberg, a senior vice president at The Segal Group. While that has the effect of increasing the cost for governments and employees, it reduces the risk the pension plan will miss its investment target. “They’re all very focused on risk management going forward and how they can better manage volatility,” said Eitelberg.
GOVERNING.COM
BY LIZ FARMER | AUGUST 3, 2016
WASHINGTON Issuance of private activity bonds subject to state volume caps rose for the second consecutive year, according to an annual survey conducted by the Council of Development Finance Agencies.
States and the District of Columbia reported cap-subject PAB issuance of $12.95 billion in 2015, which was $1.34 billion or 11.54% more than the $11.61 billion issued in 2014. The gain marked the upward trend of PAB issuance to a five-year high after the market declined for the previous three years.
“This may be a trend that will continue, and a beginning of a revival of the private activity bond market,” CDFA wrote in its report, released Friday. “Increased tax-exempt bond issuance may be a sign that businesses are investing in more projects, or at least larger projects, than have been initiated in recent years. Certainly a variety of indicators suggest that the economy has been improving, and private activity bond issuance may be another sign of recovery.”
Public entities issue private activity bonds and loan the proceeds to nonprofit organizations or companies to finance projects that serve a public purpose. Most PABs are subject to state volume caps that are determined annually by the Internal Revenue Service based on state population estimates from the U.S. Census Bureau.
In 2015, state volume caps for PAB issuance were the greater of $100 per capita or $301.52 million, according to the IRS. It was a slight rise for low-population states from the 2014 state volume caps, which were the greater of $100 per capita or $296.83 million.
Bonds subject to volume caps include exempt-facility bonds, multifamily housing bonds, mortgage revenue bonds, industrial development bonds, student loan bonds and agricultural bonds. PABs not subject to the state volume caps, including 501(c)(3) bonds and veterans’ mortgage revenue bonds, were not included in the CDFA report.
Under IRS guidelines, states may carry forward unused cap for up to three years before it must be abandoned.
In 2015, the 50 states and the D.C. received $34.88 billion of new volume cap allocation and carried forward $54.48 billion from 2012 to 2014. As a result, they could issue a total of $90.04 billion of cap-subject PABs in 2015, about $2.04 billion less than the prior year.
States abandoned $10.46 billion in unused volume cap allocation in 2015, which was $1.53 billion, or nearly 13% less than the $11.99 billion abandoned the previous year.
The total new cap of $34.88 billion in 2015 represented an increase of $346.52 million, or 1%, from the previous year. However, the new cap plus the carry-forward amounts, which equal total PAB capacity, decreased in 2015 to $90.04 billion, about $2.04 billion or 2.21% from the previous year.
According to the report, issuance of exempt facility bonds, multifamily housing bonds and mortgage revenue bonds rose in 2015, while issuance of industrial development bonds (IDBs) and student loan bonds were down.
The states that reported the most cap-subject PAB issuance in 2015 were: California with $3.13 billion; New York with $1.78 billion; Massachusetts with $982.1 million; Minnesota with $775.3 million; and Texas with $740.2 million.
CDFA compiles its annual survey based on voluntary data reported by state and D.C. authorities or offices that allocate PABs. Four states – Colorado, North Carolina, Tennessee, Virginia and D.C. did not report any data for 2015. CDFA said it would continue to seek data from them.
Housing Bonds
Issuance of multifamily housing bonds was $6.61 billion in 2015, an increase of $130.35 million or 2.01% from the $6.48 billion issued in 2014. Issuance of tax-exempt single-family mortgage revenue bonds (MRBs) showed the largest percentage increase among PAB categories in 2015, according to CFDA. Issuance of MRBs was $4.57 billion in 2015, an increase of $1.73 billion or 60.74% from $2.84 billion in 2014.
Barbara Thompson, executive director of the National Council of State Housing Agencies (NCSHA), said the increase in housing bonds could mark the start of a turnaround after the bond market “froze” following the financial and housing crisis from 2007 through 2009.
She attributed the increase in part to the 4% low income housing tax credit program, which incentivizes private involvement in providing affordable housing.
“It’s reassuring that it has confirmed what we’ve been hearing from our agency members,” Thompson said. “A lot of discussion took place during our meetings about how we’ve been seeing an uptick in usage of private activity bond cap.”
More housing bonds have been used by state and local governments in recent years, she added.
Multifamily housing bonds are used to finance rental housing for low-to-moderate income families. MRBs are used to finance below-market interest rate mortgages for first-time qualifying homebuyers.
Garth Rieman, director of Housing Advocacy and Strategic Initiatives for NCSHA, said that multifamily housing bonds have also seen an uptick in issuance because of the recent increased demand for rentals over home ownership.
“This is causing an increase in rent but incomes are not as much, which increases the need for affordable housing,” Rieman said. “As the need grows and demand grows, people turn to multifamily housing bonds. I think all these trends will continue.”
Officials with the National Association of Local Housing Finance Agencies declined to comment on the survey.
Student Loan Bonds/IDBs
Unlike mortgage revenue and multifamily housing bonds, state-issued student loan bond issuance dropped in 2015 to $688.06 million from $754.26 million 2014. This was a decrease of $66.20 million or 8.78%.
Only eight states reported issuance of student loan PABs during the year: Arizona, Connecticut, Iowa, Massachusetts, Minnesota, New Jersey, Texas and Vermont. Massachusetts, with $200 million, issued the greatest dollar amount of student loan bonds in 2015.
Debra Chromy, president of the Education Finance Council, said that because there have been no Federal Family Education Loan Program (FFELP) loans originated since 2010, there has been a steady decrease in the overall value of state-issued student loan bonds. However, supplemental student loan bond issues have risen, exceeding $500 million last year, she said.
“In 2014 we saw some of the last big FFELP restructuring bond deals, resulting in a decrease in the dollar volume of bond deals from 2014 to 2015,” Chromy said. “Concerns by rating agencies of the impact of FFELP loans in forbearance and with income contingent repayment plans basically put a stop to any FFELP bond deals for the second half of 2015.”
Issuance of IDBs also fell in 2015: states issued $244.25 million last year compared to $269.50 million in 2014, a drop of $25.25 million or 9.37%. This marked the second straight year of decline of IDBs, which are used to provide financing to small manufacturers.
A total of 14 states reported IDB issuances in 2015, eight less than in 2014. Wisconsin, at $43.0 million, had the largest IDB issuance, followed by California at $35.9 million and Massachusetts at $27.6 million.
In its report, CDFA officials said anecdotal reports at the start of 2015 suggested a rebound in IDB issuance, but the end-of-year figures proved otherwise.
Bolstering Issuance
CDFA, which represents IDB issuers and borrowers, suggested methods to increase PAB issuance going forward, including standardizing issuing documents or establishing a PAB bank program, which it said could reduce issuance costs for borrowers. The group also called for better marketing of bond programs to increase accessibility to borrowers as well as new programs to increase facilitate PAB issuance while collateral values remain low and credit enhancement is difficult to attain.
CDFA urged Congress to bolster specific categories of PABs, including suggesting basic modifications that it said could “significantly improve” the use of these bonds and provide cost-effective capital to fund public purpose projects.
Leveraging additional funds would allow authorities to establish their own credit enhancement program, the group added.
The group was instrumental in getting Rep. Randy Hultgren, RIll., to propose a reform package for IDBs. The Modernizing American Manufacturing Bonds Act (H.R, 2890), which Hultgren introduced in June 2015, would increase the IDB issuance limit to $30 million from $10 million and would allow small-to-mid-sized manufacturers access to low-cost capital to grow and create jobs.
CDFA said one its goals is to work toward getting this legislation passed this year.
“To the extent that state and municipal authorities are interested in being proactive about private activity bond issuance, such options should be pursued,” CDFA officials wrote in their report.
The Bond Buyer
By Evan Fallor
August 5, 2016
DALLAS Maryland’s proposed Purple Line P3 transit project could be in jeopardy after a federal judge ordered a delay until state and federal transportation agencies revise their ridership estimates for the $5.6 billion project.
Judge Richard Leon of the U.S. District Court for the District of Columbia voided the state and federal approvals of the environmental impact statements for the rail project, halting it until a supplemental statement can be prepared and accepted.
Leon’s decision will be appealed, said Maryland Transportation Secretary Pete Rahn.
“We are deeply disappointed that this puts the Purple Line in jeopardy,” Rahn said. “We will work closely with the attorney general to seek a quick decision from the court of appeals.”
Maryland Attorney General Brian Frosh said in a court filing in late June that the six-month delay sought by the plaintiffs “would be profoundly disruptive and could jeopardize” the Purple Line project. The delay “could have cascading consequences on the project schedule and financing arrangements,” Frosh said in a supplemental memorandum filed June 29.
Linda S. DeVuono, an attorney for the Maryland Transit Administration, said during a hearing that the proposed delay could halt the project entirely.
“I do know a sixmonth stop of work would allow investors to pull out,” she said.
Leon’s ruling is the result of a lawsuit filed in 2014 by Friends of the Capital Crescent Trail seeking to stop the Purple Line on environmental grounds.
The plaintiffs asked in June for a six-month delay to allow a review of their contentions that ridership on the system would be lowered by the recent maintenance woes and safety surge project of the Washington Metropolitan Area Rapid Transit’s Metrorail system.
Leon cited the threat to ridership of Metrorail’s extensive safety and maintenance efforts that require frequent shutdowns and delays as the main cause for ordering further reviews of the Purple Line.
The Maryland Transit Administration and the Federal Transit Administration were “arbitrary and capricious” in not evaluating the longterm ridership projections for the project’s environmental impact statement after the WMATA woes became apparent, he said.
“Defendants wholly failed to evaluate the significance of the documented safety issues and decline in WMATA ridership, skirting the issue entirely on the basis that the Purple Line is not part of WMATA,” Leon said. “Nor can I turn a blind eye to the recent extraordinary events involving seemingly endless Metrorail breakdowns and safety issues.”
Ridership on the Purple Line had been projected to average 58,000 trips per day in the first few years of operation, rising to 70,000 riders per day by 2040, but Leon said those estimates now look too rosy.
“At a minimum, WMATA and FTA’s cavalier attitude toward these recent developments raises troubling concerns about their competence of stewards of nearly a billion dollars of the federal taxpayers’ funds,” he said.
Maryland officials had scheduled a signing ceremony on Monday to celebrate a Full Funding Grant Agreement with the FTA for a $900 million construction grant for the Purple Line but that will be delayed.
The construction financing also includes $313 million of private activity bonds issued in June by the Maryland Economic Development Corp. and an $873 million federal low-interest loan under the Transportation Infrastructure Finance and Innovation Act. Both received a BBB-plus from Fitch Ratings and S&P Global Ratings.
Maryland signed a contract in April with Purple Line Transit Partners, an international consortium of Fluor Enterprises, Meridiam Infrastructure Purple Line, and Star America Fund, to finance, build, and operate the Purple Line and operate it for 30 years with annual availability payments.
The 16.2-mile rail line across the Maryland suburbs of Washington would connect New Carrollton in Prince George’s County with Bethesda in Montgomery County.
The Bond Buyer
By Jim Watts
August 4, 2016
Municipal money market funds are hemorrhaging cash in advance of rules aimed at reducing the risk of runs on the pools.
Assets have plunged $64 billion since the beginning of the year to the lowest levels since 1999 as investors pulled money from tax-exempt funds in 25 of the last 30 weeks and shifted into ones that buy only government debt. These government-only funds are exempt from Securities and Exchange Commission rules effective in October that require floating net-asset values and impose liquidity fees and redemption suspensions under certain conditions.
The new regulations are adding more pain to funds that have been plagued by seven years of the Federal Reserve’s zero interest-rate policy.
“They’re in danger of going extinct, especially if you don’t get a rate hike anytime in the next couple of years,” said Peter Crane, president of Westborough, Massachusetts-based Crane Data LLC. “Municipal money market funds lobbied hard to get an exemption from the SEC’s rules, but the SEC threw them under the bus.”
Ryan White, a spokesman for the SEC, declined to comment.
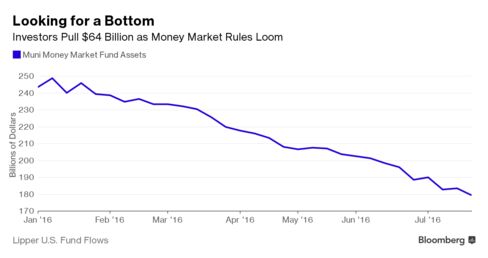
In 2014, the SEC adopted new money-market rules after a four-year debate between the fund industry and regulators. The rules were aimed at preventing a repeat of the run on one money fund during the 2008 credit crisis. The $62.5 billion taxable Reserve Primary fund “broke the buck” because of losses on Lehman Brothers Holdings Inc. debt it held. The fund’s move to reprice shares below $1 sowed panic among investors, who pulled $310 billion from money funds in a single week, helping freeze credit markets.
Under SEC rules taking effect Oct. 14, municipal-money funds whose investors are institutions, including municipalities such as Los Angeles, must abandon their $1 per-share value and allow their prices to float. Retail tax-exempt funds can keep a stable $1 per-share fixed price.
In addition, both institutional and retail funds may impose liquidity fees and suspend redemptions if weekly liquid assets fall below 30 percent of total assets. If weekly liquidity falls below 10 percent, money market funds must impose a 1 percent liquidity fee, unless the board decides it’s not in the fund’s best interest.
The changes don’t apply to Treasury and government-only funds.
Liquidity Situation
The rules shocked muni money fund managers. The historical average for seven-day liquidity has been between 70 percent and 80 percent for decades, said Mary Jo Ochson, who oversees $14.7 billion in tax-exempt money funds at Pittsburgh-based Federated Investors Inc. The funds, which invest in highly rated short-term debt, remained liquid during the financial crisis, she said.
“You don’t have a liquidity situation in these funds, they’re extremely high quality,” Ochson said. In the financial crisis “they did exactly what a cash vehicle should do, but are being hit very hard.”
The SEC said tax-exempt money market funds have greater credit and liquidity risks than government funds.
Municipal money market funds managed $179.4 billion as of July 27, a 26 percent decline since the beginning of the year, according to Lipper U.S. Fund Flows data. In 2008 they had more than $500 billion.
Colleen Meehan, who manages about $6 billion of muni money market funds at Dreyfus Corp., said investors are balking at the prospect of liquidity fees and redemption gates. In June, UBS Asset Management said it would transfer money in its tax-exempt sweep funds to a government money fund.
Rate Environment
“It’s a lot easier for people to just move out of these other products into government-only funds until they address what their concerns are” from both a compliance and systems standpoint, Meehan said.
The Fed’s zero-interest rate policy hasn’t helped.
Between Oct. 21, 2015, and March 2, 2016, the yield on short-term municipal bonds was 0.01 percent. The average yield over the past seven years is 0.15 percent.
“Tax exemptions don’t help you if there’s no income to tax,” said Crane.
In March, yields shot to 0.40 percentage points as investors sold shares to pay income tax bills, and new money didn’t flow back. It currently stands at 0.44 percentage points, the highest in more than seven years and 90 percent of 1-month Libor, the taxable-rate.
As a result, it costs more for states, cities, hospitals and other non-profits to borrow in the short-term market.
While fund outflows in the first quarter could be attributed to the rate environment, the money investors pulled since March has been a result of coming money market changes, said Ochson.
“We’re cheap as can be now,” she said. “Rates are attractive, liquidity is high, the funds couldn’t look any better if you tried, however you have money market regulations that have certain features that clients don’t like.”
Tax-exempt money funds won’t go the way of the dodo, an extinct flightless bird native to the island of Mauritius, but the industry will be much smaller, both Ochson and Meehan said. It will take time for investors to get more comfortable with floating net asset values and realize the probability that the funds having weekly liquid assets fall below 30 percent is very small.
“We’re going to be attractive to similar taxable products,” said Meehan. “And maybe someday we’ll be in a normal rate environment when it will really make sense.”
Bloomberg Business
by Martin Z Braun
August 3, 2016 — 2:00 AM PDT Updated on August 3, 2016 — 7:18 AM PDT
State and local issuers are resorting to betting on the future direction of interest rates to lure municipal-bond investors balking at tax-exempt yields not far from record lows.
When Aurora, Colorado, sold $437 million of water debt last month, its longest bond came with four different interest coupons — and four different yields, one of which exceeded the market level on similar securities that day. That means the city will pay four different interest rates on the debt issued for 30 years.
“What we’re hearing from our investment bankers is that with rates so low, some investors are starting to balk,” said Mike Shannon, who oversees Aurora’s debt and investments. “We were willing to meet the needs of the investors to get these bonds sold, but if you look out at the long end, it gets pretty pricey.”
Though it may be the best time in a generation to refinance, it doesn’t come without costs. In some cases, despite a perceived shortage of munis, market rates are so low investors don’t want bonds, forcing issuers to increase yields that can add millions of dollars in debt service. In a recent report, Samuel A. Ramirez & Co. advised investors they could earn more with split coupons, where lower coupons yield more than higher coupons.
‘‘It’s like a hidden yield,” said Joy Howard, a financial adviser in St. Louis. “It’s great for the investor, but terrible for the issuer.”
The flat yield curve gives investors less incentive to buy bigger coupons because they don’t get enough compensation for extra risk. Since the first of the year, the slope — or spread between yields of short and long maturities — has flattened from 214 basis points to as little as 164 basis points, or half a percentage point, the lowest since early 2008. In early 2014, it was nearly four percentage points.
With interest rates about as low as they can go, investors realize they may wind up holding longer bonds to maturity after rates increase. Bill Gross, who built Pacific Investment Management Co. into the world’s largest manager of bond funds and is now at Janus Capital Group Inc., warned this week that any reversal of the rally could be painful.
“You’re not getting paid to go out long,” said Peter Block, managing director of credit strategy with Ramirez. “Why buy a 30-year bond when you can get paid nearly as much for a 12-year bond?”
The higher price for bonds with larger coupons is driving out individual investors, making it harder to sell some securities, Matt Posner, principal with the Court Street Group, a New York research firm, said in a report last month. New York’s Metropolitan Transportation Authority split coupons in July.
“We’re seeing municipal-bond yields lower then they’ve ever been before, so most issuers are locking in to take advantage,” Posner said in an interview. “If they need to split some coupons and spend more, they’re willing to do that.”
Patrick McCoy, the authority’s finance director, said the agency adjusts coupons in response to market conditions to get the lowest cost.
“We are seeing investors articulate frustration with the lower absolute yields,” said McCoy.
In February, the Los Angles Unified School District split its 2040 maturity into two coupons, with one paying 4 percent and the other 5 percent, when it borrowed about $1.2 billion. The bond with the 4 percent coupon yielded 3.25 percent, more than a third of percentage point more than the higher-coupon security.
Splitting the coupons “was an effective technique that the district took advantage of to maximize” demand, district spokesman Gayle Pollard-Terry said in an e-mail. That let the district cut costs that would have come with only a single coupon. The actual yield that will be paid will depend on how long bonds are outstanding and whether they’re refinanced.
“A bond with a higher coupon is more likely to be called than a bond with a lower coupon,” the district said. “The reverse is true for a lower-coupon bond.”
Aurora will monitor rates as its bonds mature and refinance the more expensive ones first, said Shannon. The cost of some of its bonds will rise after the 10-year call date, while the cost of others will fall. He said the unusual structure with four coupons, including one that steps up over time, was dictated by banks led by Morgan Stanley in handling the debt sale, who he said told him four coupons were necessary to sell the bonds. Morgan Stanley declined to comment through spokesman Mark Lake.
One coupon increases in steps from 2 percent in early years to 5 percent by the end of its 30-year term. One investor was willing to buy big chunks of the bonds in two maturities if the coupons were lowered. The 2.95 percent yield on the 3 percent bond maturating in 2046 was more than half a percent more than the yield on the 5 percent coupon.
“We had to increase the rates to bring in the investor,” said Shannon. “But we think we will be able to take advantage of this structure and pay some of it off early. The question is whether the bond is going to stay out 10 years, 20 years or 30 years?”
Bloomberg Business
by Darrell Preston
August 4, 2016 — 2:00 AM PDT Updated on August 4, 2016 — 7:31 AM PDT
Lawyer Joel Liberson is leading the charge in Miami’s lawsuit against Bank of America and Wells Fargo, blaming them for the city’s economic troubles
Joel Liberson’s mortgage lawsuits against Bank of America Corp. and Wells Fargo & Co. follow a now-familiar template: accuse big banks of targeting minority borrowers with unfair loans that fed a housing crisis.
What is unusual is his client. Mr. Liberson, a 52-year-old lawyer who has devoted much of his career to defending apartment dwellers from eviction, is suing on behalf of the city of Miami. In the lawsuits, Miami blames the banks for widespread declines in property values and tax revenue, and increased expenses for police, fire and other services, due to the burdens of mass foreclosures.
The banks, which already shelled out tens of billions of dollars for mortgage-related settlements with federal and state governments since the financial crisis, have challenged whether the city has the right to sue. The Supreme Court in June agreed to take up the question and is likely to hear oral arguments in the fall and will decide by July 2017.
The court’s decision potentially could reshape the breadth and use of the Fair Housing Act, a landmark civil-rights statute that forbids discrimination in real-estate lending, rental property and other areas of the housing industry.
The banks said Miami is stretching the bounds of a law meant to integrate neighborhoods, not fill tax coffers. They also dispute that Miami has proved its economic woes are a direct result of the banks’ actions.
In a legal filing, Wells Fargo said its lending practices “did not cause the City’s financial difficulties any more than they caused the City to thrive in the years leading up to the financial crisis.” Bank of America expressed a similar sentiment in its filings.
The banks believe a Supreme Court decision siding with Miami will leave them vulnerable to a torrent of mortgage litigation from anyone who said they were harmed by the housing bubble. Lobbyists warn that banks might curtail lending in urban neighborhoods because of the legal risk.
The city and its attorney disagree. The Supreme Court has traditionally been lenient in interpreting the Fair Housing Act, according to academics who study the issue. Last year, for example, it ruled such lawsuits can be brought without proof of intentional bias.
In Mr. Liberson’s view, a ruling in the banks’ favor would limit an important weapon borrowers have wielded in housing lawsuits for decades, leaving them more vulnerable to questionable loans.
“What happens to a city when houses go vacant?” Mr. Liberson said. “Everybody suffers.”
Mr. Liberson has spent the past several years encouraging cash-strapped cities to sue the banks under the Fair Housing Act. He has enlisted help from bigger plaintiffs’ firms and big-name legal talent, including Erwin Chemerinsky, dean of the law school at the University of California, Irvine, and author of a popular textbook on constitutional law. But Mr. Liberson often works alone, hunched over a smudged Lenovo ThinkPad laptop at coffee shops and public libraries, manning the firm he named Trial & Appellate Resources.
Mr. Liberson, who lives in New York, is overseeing similar lawsuits on behalf of Los Angeles, Oakland, Calif., and Miami Gardens, Fla.
A ruling in Miami’s favor could recharge those suits, which are pending. It could do the same for similar lawsuits by Atlanta-area counties and Cook County in Illinois, both spearheaded by a small firm in Georgia. Some municipal officials believe their cities could be in line for tens of millions of dollars or more, with a cut for Mr. Liberson, if they eventually win. A ruling against Mr. Liberson could cripple those claims.
“If the Supreme Court finds standing for the city, then you’ll see a lot more of these lawsuits,” said George Rutherglen, a professor at the University of Virginia School of Law. “And if not, then the court is retrenching on a very broad approach to litigation under the Fair Housing Act.”
The legal process has taken longer than Mr. Liberson expected, but he said the strategy has worked before. Wells Fargo in 2012 resolved charges of race-based housing discrimination brought by the city of Baltimore. That agreement was wrapped into a larger settlement by the Justice Department.
It was while that case was pending that Mr. Liberson started approaching other cities to see if they were interested in doing the same. The sooner you file, the sooner you can get your money, he told them, with reassurances that the banks tended to settle such lawsuits and resolve them quickly.
Francis Suarez, a Miami city commissioner, remembers when Mr. Liberson came to him around early 2013 with an offer to work on a contingency basis. “It was kind of a no-brainer,” Mr. Suarez said. “We have the opportunity to vindicate the city for its residents, and we don’t have to front the money.”
Mr. Liberson declined to say how the cases were being financed.
Miami also is suing Citigroup Inc. and J.P. Morgan Chase & Co., although those cases aren’t before the Supreme Court. Citigroup and J.P. Morgan have denied Miami’s accusations.
Mr. Suarez, a real-estate lawyer who is running for mayor, said that if the lawsuits are successful, he would like to use the money to pay for police, fire, park and library services, and affordable housing, among others.
Even if Miami wins in the Supreme Court, a payout isn’t guaranteed. The banks have previously argued they didn’t make racially discriminatory loans, and that the statute of limitations for filing such claims has expired. Those arguments likely would come up again in district court.
And banks are fighting back more against housing-crisis cases. Bank of America recently won an appeal to overturn Justice Department accusations and a jury finding of mortgage-securities fraud.
THE WALL STREET JOURNAL
By CHRISTINA REXRODE
Aug. 2, 2016 5:25 p.m. ET
Write to Christina Rexrode at [email protected]
July 2016 — GASB Project Manager Jialan Su talks about the certain asset retirement obligations project, what the Board heard during due process, and what’s coming up.
NEW YORK/CHICAGO — Record low interest rates so far have failed to spur a wave of new borrowing in the $3.7 trillion U.S. municipal debt market, with one exception: its weakest borrowers are seizing the opportunity to prop up their finances at costs they can afford.
As of July 19 total municipal debt issuance this year fell 1.6 percent to $227 billion from the same period last year. However, new borrowing rather than refinancing of existing debt is up 12.5 percent at $88.8 billion, with lower-rated debt rising the most, according to Thomson Reuters data.
An analysis of the data shows the total amount of municipal junk bonds rated by S&P Global Ratings at BB-plus or below issued this year rose 170 percent to $1.2 billion over the same period in 2015. (Graphic: http://tmsnrt.rs/29Zs6oO)
Many higher-rated issuers are using the rock-bottom rates to refinance old debt, but have been slow in boosting borrowing for new projects because of a lengthy approval process and many communities’ reluctance to take on new burdens.
Those that struggle financially face similar problems, but some simply need to borrow to keep going and many are able to issue revenue bonds, which do not require voter approval.
Some cash-strapped areas, including Illinois and low-rated Chicago, can also issue bonds for new spending without taxpayer approval at the ballot box.
Some struggling cities, states or individual projects “have to borrow to keep going,” said Matt Posner, principal of public finance research firm Court Street Group.
With muni bond rates at record lows, junk and low investment-grade rated issuers are trying to exploit what could be a rare window of opportunity before any market reversal makes borrowing costs prohibitive again.
“Issuers with lower ratings are taking advantage of the very tight spreads and nearly insatiable demand for any paper that has any hint of additional yield,” said James Dearborn, head of muni investing at Columbia Threadneedle.
One example is California’s Loma Linda University Medical Center, which planned to double its outstanding debt to pay for renovations to meet state seismic safety requirements.
In September 2015, Fitch Ratings cut the center’s rating to junk at BB-plus, and by April it sold $948 million of debt. The biggest tranche maturing in 2056, carried a 5.25 percent coupon and sold at a premium to yield 4.70 percent. Today those bonds trade much higher, driving the yield down to 3.24 percent.
Similarly, in February, Chicago’s Board of Education sold bonds rated B-plus for capital improvements and refinancing. The 7 percent, 28-year bonds were sold at a big discount but have since risen above par value.
More borrowing is under consideration, district CEO Forrest Claypool said.
Public-private projects – including an upgrade of New York’s LaGuardia Airport – have also contributed to the uptick, Posner said. Many such projects contain a municipal bond portion rated in the triple-B range, the lowest-investment category, which also grew as rated by Moody’s Investors Service, the data show.
Lower-rated borrowers are also refinancing old debt faster than investment-grade issuers.
The value of junk-rated refunding bonds grew 248 percent to $1.9 billion, Thomson Reuters data show, while the total slipped 9 percent to $138 billion.
More deals are in the works. In the junk category, Detroit will issue about $615.5 million of refunding bonds in the next couple of weeks to save an estimated $37 million in its first general obligation offering since exiting the largest ever U.S. municipal bankruptcy in December 2014.
Chicago, downgraded to “junk” last year by Moody’s, plans to sell up to $1.25 billion of general obligation bonds this quarter. Illinois, the lowest rated U.S. state, could refund up to $2 billion of bonds.
By REUTERS
JULY 26, 2016, 1:24 A.M. E.D.T.
(Reporting by Hilary Russ in New York and Karen Pierog in Chicago; Additional reporting by Robin Respaut in San Francisco; Editing by Daniel Bases and Tomasz Janowski)
Fitch Ratings-New York-25 July 2016: Increased rating activity is possible for stand-alone U.S. ports over the next 12 months, according to Fitch Ratings in its latest U.S. Ports Peer Review.
During the past 12 months, Fitch revised Outlooks on three ports among the 16 it rated publicly during the period. Ratings adjustments may follow during the next review cycle as Fitch considers resolution for these credits with either a Positive or Negative Rating Outlook. That said, Fitch maintains Stable Outlooks on roughly 75% of its port sector and does not envision movement of any great magnitude in the coming months. Credit risk is still relatively low among U.S. ports thanks in part to their cash flow resiliency amid volume fluctuations during economic downturns. As such, ratings for most ports continue to fall in the ‘A’ rating category.
Since its last U.S. Ports Peer Review, Fitch revised the Rating Outlook for the Alabama State Port Authority to Negative from Stable; the North Carolina State Ports Authority to Positive from Stable; and the Port of Palm Beach to Positive from Stable. Fitch also maintained the Positive Outlook on the Hillsborough County Port District.
Ports with the highest Fitch ratings are typically those with a strong underlying market or franchise driving demand, overall stability of cash flow through contractual agreements, or tariff policy and healthy financial metrics. Conversely, Fitch’s weakest rated ports include those serving weaker markets with competition for cargo, less contractual protection for revenues or thinner financial metrics.
Fitch’s latest ‘Peer Review of U.S. Ports’ is available at ‘www.fitchratings.com’
Contact:
Emma Griffith
Director
+1-212-908-9124
Fitch Ratings, Inc., 33 Whitehall Street, New York, NY, 10004
Seth Lehman
Senior Director
+1-212-908-0755
Stacey Mawson
Director
+1-212-908-0678
Media Relations: Sandro Scenga, New York, Tel: +1 212-908-0278, Email: [email protected].
Additional information is available at ‘www.fitchratings.com’.
New York, July 25, 2016 — The ability of US state and local governments to absorb adverse market performance by their pension funds has been constrained by rising costs associated with past unfunded liabilities, Moody’s Investors Service says. At the same time, high return seeking by public pension funds increases risk of investment losses in any given year.
Over the long term, most public pension portfolios are designed to attain annual returns over 7% to offset rising employee retirement costs. To achieve these targets, state and local government pension funds must invest in potentially volatile assets. For example, public pension funds generally allocate close to 50% of assets to public equities, although allocations can vary substantially by plan.
“US public pension assets declined in six separate years from 2000-2015, and even governments with comparatively well-funded pensions can face budget risk if returns do not match expectations” Thomas Aaron, a Moody’s Vice President — Senior Analyst says in “State and Local Governments — US: Even Comparatively Well-Funded Public Pensions Carry Risk of Volatile Investments.”
Moody’s says this was illustrated when the largest US public pension fund, the California Public Employees’ Retirement System (CalPERS, Aa2 stable), experienced investment losses in four separate fiscal years from 2000 to 2015, with a 24% loss in 2009 representing its most dramatic single-year drop.
“Exposure to pension investment volatility is a credit risk because governments must be able to withstand the downside when short-term asset risk materializes, while still delivering public services and repaying debt. Government budgets are already under increasing strain because of the unfunded liabilities that have materialized over roughly the last 15 years,” Aaron says.
While governments can shift pension asset allocations to lower investment risk, this translates to higher government pension contribution requirements, because discount rates are linked to assumed asset performance. It also translates to higher reported liabilities under GASB rules. CalPERS notably opted to begin de-risking its pension portfolio last year, but at a very gradual rate in order to avoid cost spikes.
The report is available to Moody’s subscribers at
https://www.moodys.com/researchdocumentcontentpage.aspx?docid=PBM_1028742.
************************************************************************
NOTE TO JOURNALISTS ONLY: For more information, please call one of our global press information hotlines: New York +1-212-553-0376, London +44-20-7772-5456, Tokyo +813-5408-4110, Hong Kong +852-3758-1350, Sydney +61-2-9270-8141, Mexico City 001-888-779-5833, São Paulo 0800-891-2518, or Buenos Aires 0800-666-3506. You can also email us at [email protected] or visit our web site at www.moodys.com.
This publication does not announce a credit rating action. For any credit ratings referenced in this publication, please see the ratings tab on the issuer/entity page on www.moodys.com for the most updated credit rating action information and rating history.
Thomas Aaron
Vice President – Senior Analyst
Public Finance Group
Moody’s Investors Service, Inc.
100 N Riverside Plaza
Suite 2220
Chicago, IL 60606
U.S.A.
JOURNALISTS: 212-553-0376
SUBSCRIBERS: 212-553-1653
Timothy Blake
MD – Public Finance
Structured Finance Group
JOURNALISTS: 212-553-0376
SUBSCRIBERS: 212-553-1653
Releasing Office:
Moody’s Investors Service, Inc.
250 Greenwich Street
New York, NY 10007
U.S.A.
JOURNALISTS: 212-553-0376
SUBSCRIBERS: 212-553-1653
The municipal-bond market’s one-year winning streak is taking a breather.
State and local-government debt has lost 0.25 percent in July, headed for the first monthly decline since June 2015, Bank of America Merrill Lynch data show. The drop marks a pullback after the securities rallied in June by the most in 17 months as investors rushed into the safest assets amid concern about the impacts of the U.K.’s vote to exit the European Union.
“It’s just a give back from Brexit,” said Adam Buchanan, senior vice president of sales and trading at Ziegler, a broker-dealer in Chicago. “The reason the month is down is because Brexit drove the market artificially high for a short period of time.”
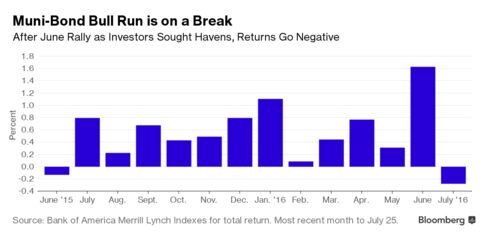
The bull run in tax-exempt securities had sent prices to record highs as investors plowed money into municipal mutual funds, with the Federal Reserve holding off on raising interest rates since the quarter-point increase in December. While state and local debt returns are still up 4.2 percent this year, on track for the third straight annual gain, some investors are locking in profits, speculating future returns may be muted.
Municipal yields, which move in the opposite direction as price, climbed to the highest in more than a month this week. By the start of this week, benchmark 10-year yields were 1.48 percent, the highest since June 23, according to data compiled by Bloomberg. The yield for the Bond Buyer 20 Index last week edged up to 2.87 percent after slipping to as little as 2.8 percent earlier this month, the lowest since at least 1961.
A retreat is normal after this “stellar” run, said Phil Fischer, the head of municipal research at Bank of America Merrill Lynch.
“This is not Armageddon,” Fischer said. “It’s not a bad idea for people to pause and take a look at their portfolios.”
With borrowing costs low, state and local governments have increased sales of debt before the Fed boosts rates again. The increase in the supply of new securities has been a drag on the market during the second half of July, said Dan Solender, head of municipals at in Jersey City, New Jersey for Lord Abbett & Co., which manages $20 billion of the debt.
U.S. policy makers left rates unchanged during Wednesday’s Fed meeting while noting that the risks to the economy have subsided. Investors project a 26 percent chance that policy makers will hike rates at the next meeting in September, according to pricing interest-rate futures markets.
There are about $12 billion of bond sales scheduled over the next 30 days, the most in three weeks, according to data compiled by Bloomberg. The actual amount might be higher as some deals are made public only days ahead of time.
Still, there’s been plenty of cash flooding into the market. Investors have added money to municipal-bond mutual funds for 42 straight weeks, according to Lipper US Fund Flows data. Inflows reached $1 billion in the week ended July 20, following $1.22 billion the previous week.
“Our demand is so strong, and we still have some good relative value versus other markets,” said Solender. “For now, that’s definitely still drawing interest to our market.”
Bloomberg Business
by Elizabeth Campbell
July 27, 2016 — 2:00 AM PDT Updated on July 27, 2016 — 11:41 AM PDT
The nation’s mayors and governors are hoping the next president will do what even record-low interest rates haven’t: jumpstart investment in America’s roads, water works and mass-transit systems.
On the sidelines of the Democratic National Convention in Philadelphia, where Hillary Clinton Thursday night accepted the party’s nomination, state and local government officials said they need more federal support to finance work on infrastructure. Even with borrowing costs in the municipal-bond market holding near the lowest ever, governments squeezed by the recession have been leery of running up debt or persuading voters to support tax increases necessary to pay it back.
“We need to sell the American people on the value of investing in infrastructure,” Terry O’Sullivan, general president of the Laborers’ International Union of North America, said. He spoke at a meeting sponsored by Bloomberg Politics and Building America’s Future, a coalition of elected officials that’s co-chaired by Michael Bloomberg, founder and majority owner of Bloomberg LP, the parent company of Bloomberg News.
U.S. spending is projected to fall about $1.4 trillion short of the $3.3 trillion needed through 2025 for airports, highways and other infrastructure, according to the American Society of Civil Engineers. While President Barack Obama spurred spending on public works by helping cover the interest on about $188 billion of state and local debt, the program lapsed in 2010. Democrats have been unable to revive it because of Republican opposition in Congress.
Both presidential candidates have said the country needs to do more. Clinton pledged to spend $275 billion over five years and set up a national infrastructure bank to help fund large-scale projects, a proposal Obama advanced only to see it stall for lack of Republican support. Donald Trump, the Republican nominee, in his July 21 acceptance speech said “our roads and bridges are falling apart,” though he’s offered few details for how he’d fix them.
New York Mayor Bill de Blasio, a Democrat, said “there’s a chance to get at least a core few things on the first run of the agenda” that would boost federal involvement in local public works. He said both parties find “tremendous commonality” over the issue.
The slide in interest rates has prodded state and local governments to increase their borrowing, though the pace of bond sales remains below the peak reached in 2010 and most are being issued to refinance higher-cost debt. There have been about $97.5 billion of municipal bonds issued this year for new projects, up from $87 billion in the same period a year earlier, according to Bank of America Merrill Lynch.
The municipal bond market has the capacity to finance far more, said Sean McCarthy, co-founder of Build America Mutual, which insures local-government debt, during a panel discussion in Philadelphia. Investors have added money to municipal-bond mutual funds for nearly a full straight year, according to Lipper US Fund Flows data, with $783 million coming in during the week ended July 27.
“Capital is waiting to be put to work on those new projects,” said McCarthy.
Some of the needed investment has been delayed because of the economic and political pressure to cut spending, which governments nationwide have faced since the onset of the recession. While the economy began growing again in June 2009, states and cities continued to be dogged by budget shortfalls for years because of the toll it took on their tax revenue. When governors released spending plans this year, 15 proposed cutting taxes while 13 sought to increase them, according to the National Association of State Budget Officers.
“There is a distrust that the government’s not going to do a good job spending money, particularly with roads and bridges,” said Rhode Island Governor Gina Raimondo, a Democrat who successfully pushed through a $1.1 billion infrastructure plan after taking office last year. “They see what they think of as waste– projects taking too long, projects being done inefficiently.”
Bloomberg Business
by Romy Varghese
July 29, 2016 — 2:00 AM PDT Updated on July 29, 2016 — 8:14 AM PDT
PHILADELPHIA — After the presidential election, the United States may see a “golden moment” to push for increased federal and state spending to fix America’s crumbling infrastructure, according to Democratic mayors speaking a policy meeting at Philadelphia on Tuesday.
The briefing, sponsored by the National League of Cities and Build America Mutual, was held at City Hall in the shadow of the Democratic National Convention.
Former Pennsylvania Gov. and Philadelphia Mayor Ed Rendell, New York City Mayor Bill DeBlasio, Atlanta Mayor Kasim Reed, Tampa Mayor Bob Buckhorn, and Pittsburgh Mayor Bill Peduto all talked about the importance of renewed and increased infrastructure spending and the benefits it holds for both the economy and for the American people.
Also on a panel discussion were Franklin Templeton’s Sheila Amoroso and New York City Transportation Commissioner Polly Trottenberg. The group also heard from NLC President Melodee Colbert Kean, NLC CEO Clarence Anthony and BAM CEO Sean McCarthy.
McCarthy laid out the scope of the problem, saying that the American Society of Civil Engineers recently estimated that there is a $1.4 trillion gap between the nation’s infrastructure funding needs over the next 10 years and the current resources being made available to pay for them.
But he was optimistic that this will change.
“Don’t let the scale of the numbers that we are talking about scare you,” he said, “This is a problem that can be solved.”
Rendell said that “we need to start spending money soon,” recommending a plan of $2 trillion over 10 years, which includes state, federal and private funds. “We can do this,” he said, adding that the best method for financing infrastructure was through the sale of municipal bonds.
Rendell also touted Build America Bonds, saying the BABs program created by the federal government as part of the fiscal stimulus package during the Great Recession was “very successful.”
De Blasio stressed the urgency of moving forward in 2017, during the first year of a new presidential administration and a new Congress.
“I think we have an extraordinary opportunity ahead of us,” he said. “I can say there’s a combination of factors that could come into play that might be a ‘golden moment’ for a new level of infrastructure development. There are outcomes that could open the door for a reconsideration of a federal role in infrastructure.”
De Blasio said there’s a chance to get at least a core few things on the federal agenda that might be acted upon during this “golden moment.”
Mayors of both parties are banding together to push the message to state and federal officials that the nation must greatly increase its infrastructure spending or it won’t be able to compete economically, de Blasio added.
“What we need we need right now is will and ability,” Reed said. “You need the political will to decide that we really aren’t going to wait on the federal conversation, we are going to do both at the same time. And I think that you need the ability because we’re going to need a partnership between the public and private sector.”
Reed said the federal government has “an amazing role to play, but we need to be more focused, from our own standpoint, on these public-private partnerships.”
Buckhorn said “infrastructure matters” and that the United States will be economically weaker if it doesn’t invest in fixing and maintaining its roads and bridges, sewers, tunnels, ports and airports. He said infrastructure means employment, citing the Port of Tampa, which directly or indirectly supports 80,000 jobs.
Peduto said the changing nature of technology was an important component in infrastructure planning. Advances such as the rise of driverless cars, will change infrastructure needs of cities in the future.
Amoroso said that “infrastructure financing in the United States is vitally important.”
She said that “two thirds of the infrastructure in the United States is built using municipal bonds and it is a market that is heavily retail driven, that is unlike any another market where they’re primarily institutional investors.”
She also stressed importance of Congress preserving the tax-exemption for municipal bonds for these investors. She described the tax-exemption as a circle of life, which “encourages individuals to invest in their communities where they earn a return that helps keep financings costs low. So it’s a win-win situation for the state and local governments.”
The Bond Buyer
By Chip Barnett
July 27, 2016
After two months of increased year-over-year volume, long-term municipal bond issuance plunged 27% in July.
Total monthly volume shrank to $26.07 billion in 880 transactions from $35.62 billion in 1,091 transactions in July of last year, according to data from Thomson Reuters. It was the lowest total for the month of July since 2011, when it was $24.91 billion.
Refundings, which have been strong for the majority of the year due to persistent low interest rates, declined 27.7% to $9.39 billion in 324 deals from $12.99 billion in 395 deals.
“Issuance was down almost across the board, and I think it would be incorrect to extrapolate a trend using just one month’s data,” said Vikram Rai, CFA and head of municipal strategy at Citi. “It is true that typically issuance in July can be down anywhere from 5% to 15% versus the monthly average for the year, though this is not always true.
“This time around I think issuers, like most of us, were distracted by the extreme market volatility following the Brexit event and were leery of coming to market when yields were whip-sawing,” Rai said, referring to the financial market’s reaction to Great Britain’s June 23 vote to leave the European Union.
New-money deals fell 17.4% in July to $12.38 billion in 504 deals from $14.98 billion in 586 deals during the same period last year.
“There was the timing of the fourth of July that had some impact but the main issue is that issuers continue to be not aggressive with the market despite low yields, as they did not want to take on additional debt,” said Dan Heckman, senior fixed income strategist at U.S. Bank Wealth Management. “The reality is that we are still reminiscent of the finical crisis, and for tax payers and municipalities, it still continues to be difficult environment. There is also lack of infrastructure spending, and it continues to be difficult in general for new issues to gain a lot of traction.”
Heckman also cited summer doldrums and a slowdown ahead of a presidential election as reasons for the reduced muni volume.
“I think going forward we will see more and more refundings and I am hopefully that by the end of 2016, beginning of 2017, you will see issuers getting more aggressive in terms of taking on new debt,” he said. “We thought this month would be light, but it took us by surprise just how light it was.”
Combined new-money and refunding issuance dropped by 43.8% in to $4.29 billion from $7.64 billion.
Issuance of revenue bonds decreased 23.1% to $16.87 billion, while general obligation bond sales dropped 32.7% to $9.20 billion.
Negotiated deals were lower by 30.1% to $19.04 billion, while competitive sales increased by 6.2% to $6.81 billion.
Taxable bond volume was 52.3% lower at $1.51 billion, while tax-exempt issuance declined by 23.8% to $24.02 billion.
Minimum tax bonds issuance slipped to $544 million from $948 million.
Private placements sank to $227 million from $1.96 billion.
Zero coupon bonds increased to $118 million from $26 million.
“The spike in zero coupon issuance is surprising and it seems like issuers are tapping into the demand for longer duration bonds,” said Rai.
Bond insurance declined 22.4% for the month, as the volume of deals wrapped with insurance dipped to $1.33 billion in 100 deals from $1.71 billion in 118 deals.
Variable-rate short put bonds dropped 54.7% to $455 million from $1.00 billion. Variable-rate long or no put bonds rose to $417 million from $298 million.
Bank qualified bonds decreased 5.6% to $1.63 billion from $1.72 billion.
Among sectors, only health care and public facilities posted year-over-year gains, despite fewer deals this month. Public facilities gained 32.7% to $933 million in 38 transactions from $700 million in 39 transactions and health care improved 54.8% to $3.69 billion in 33 deals from $2.38 billion in 52 deals.
All of the other sectors had a decrease of at least 18.6%, except for housing which slipped 2.5%.
As for the different types of entities that issue bonds, only three saw positive year over year changes. State governments improved 63.6% to $1.48 billion from $908 million, counties and parishes gained 93.6% to $2.54 billion from $1.31 and direct issuers inched up to $130 million from $105 million.
All other entities saw a decline by at least 10%, with the largest decline coming from cities and towns, which dropped 57.6% to $3.88 billion from $9.15 billion.
California is the top issuer among states for the year to date, followed by Texas, New York, Florida and Pennsylvania.
The Golden State so far this year has issued $34.61 billion, with the Lone Star State right at its heels with $32.41 billion. The Empire State follows with $26.44 billion. The Sunshine State is in third with $11.29 billion and the Keystone State rounds out the top five with $10.35 billion.
“We do not expect issuance to pick-up materially; this is true for new money issuance and refunding issuance. But, we do expect at least refundings to remain robust for the remainder of the year,” Rai said. “Our estimate for gross issuance for 2016 remains unchanged at $413 billion, split almost evenly between new money and refundings. Net issuance is likely to be $45 billion.”
The Bond Buyer
By Aaron Weitzman
July 29, 2016
Does a sullied past haunt a bond issuer’s future?
In April, something remarkable happened in the otherwise sleepy world of public money. Orange County, Calif., long considered a problem child in local public finance, announced a plan to return to the municipal bond market.
At the start of the 1990s, the county made some big bets on an early form of financial derivatives — not unlike those at the heart of the 2008 financial market crisis — and it lost. It suffered major financial damage and eventually declared bankruptcy. But now the county is looking to borrow once again, and investors are primed to snatch up its new bonds at eye-poppingly high prices.
Financially speaking, Orange County is back in a big way.
The Orange County story illustrates one of the great debates in finance. Municipal bond investors are willing to look past the county’s sordid past and focus instead on its financial future, namely its strong balance sheet, solid credit rating and growing tax base. This suggests that investors only care about future cash flows. But don’t forget that the county waited 20 years to test the market. Somebody clearly believed it needed a long time to shake its problem-child reputation.
So is the financial past prologue, or not? Some recent evidence suggests that in the municipal bond market — unlike most other capital markets — past perceptions have big financial consequences.
True believers say financial markets are fair because they’re forward-looking. If investors focus too much on the past, they’ll miss moneymaking opportunities. For instance, if a city lands a big economic development project or renegotiates its pension obligations, then any new bonds it issues should be met with higher demand and sell at higher prices. An investor who fixates on that city’s past bond prices will miss out on a surefire investment. So in theory, at least, past prices shouldn’t matter.
How does this theory play out in the municipal bond market? In a recent paper I examined how the interest rates on a local government’s past bond issues affect the interest rates on its future bond issues. I analyzed data on more than 35,000 “full faith and credit” bonds over the past decade. The results were striking. I found that all else being equal, for every 1 percent increase in a government’s past interest rates, the interest rate on its new bonds will be about 10 basis points (or .10 percent) higher. Put differently, past investor perceptions alone account for about 10 percent of current investor perceptions. Behavioral economists call this particular type of bias “anchoring” on past information.
There’s bad news and good news here. The bad news is that anchoring is expensive for issuers. On a 25-year, $100 million bond, for example, 10 additional basis points can mean about $4 million in additional interest payments. Consider also that municipal bond interest rates have generally declined over the past decade. This means that many local governments’ borrowing costs have been tethered to higher interest rates in the recent past.
This bias is also disconcerting because it’s hard to explain. A cynic might argue that anchoring happens because bond investors are lazy. Instead of carefully evaluating a government’s financial future, they just crib off of past prices. Of course, it’s not that simple. More than 50,000 governments have municipal bonds outstanding, and most of those sell new bonds every few years at most. At the moment there are no federal rules about the timing and content of local governments’ financial reports. In that environment it can be difficult to find recent financial information and even more difficult to find fresh prices on a government’s bonds. Municipal bond investors aren’t lazy. When information is hard to find, they’re just humans subject to bias.
The good news is that finance professionals can take steps to correct that bias. This is yet another reason for local governments to invest in a robust, comprehensive program of public disclosure. As Orange County shows us, it’s important for investors to know where a jurisdiction is, not where it was.
GOVERNING.COM
BY JUSTIN MARLOWE | AUGUST 2016
Innovative local government leaders throughout the country are taking advantage of state and federal incentives to transform former landfills and contaminated industrial properties and waste sites into energy-producing wind and solar projects. Two examples of municipalities giving such contaminated properties new life are discussed in this article – redeveloping once polluted properties into solar installations in New Bedford, Massachusetts and revitalizing a former Bethlehem Steel plant into renewable energy projects in Lackawanna, New York.
Turning Environmental Liabilities into Environmental Assets
Brownfields are a challenge for municipalities. In many cases, these properties have been idle and under-utilized for decades due to the environmental stigma that has hindered their redevelopment for productive use. At first glance, these sites may not appear to be suitable candidates for siting commercial and utility-scale renewable energy facilities. But many of these properties have development potential that finally can be realized, thanks to a favorable regulatory and financial environment.
Many state and federal programs, such as the Environmental Protection Agency’s “Re-Powering America’s Land Initiative,” are spurring redevelopment through streamlined regulatory approvals, expedited permitting, reduced land acquisition costs, and financing and tax incentives. In fact, according to EPA, as of 2014, more than 135 renewable energy projects have been installed on 128 contaminated properties with a total capacity of more than 773 megawatts (MW).
The location of these properties in urban and industrial neighborhoods also plays a vital role in their redevelopment. Brownfields, including former industrial sites and municipal and hazardous waste landfills, are frequently located close to crucial infrastructure, such as electric transmission lines and substations, roads and water supply. Often, they comprise large land areas suitable for renewable energy development, and they already may be zoned and permitted to accommodate such redevelopment.
In addition to financial incentives, EPA offers liability protection to those who meet requirements under federal statutes like the Comprehensive Environmental Response, Compensation and Liability Act and the Resource Conservation and Recovery Act. Many states offer similar programs. Protections of this nature can help overcome environmental stigma that may attach to contaminated properties and prevent their redevelopment for productive use.
New Bedford’s Whale of a Transformation
In the past several years, New Bedford, Massachusetts, once America’s whaling capital, has tapped both state and federal incentives to reinvent itself as a major generator of solar power. New Bedford is just one of several Massachusetts communities developing renewable energy projects on contaminated lands in partnership with local utilities, private investors, and solar energy companies. The state’s Solar Renewable Energy Credit program has certainly helped, requiring utilities to buy electricity from solar installations, and providing specific incentives for renewable energy on landfills and brownfields.
The coastal southeastern Massachusetts city now has more than 16 MW of solar capacity installed or under construction, and is ranked second only to Honolulu, Hawaii for the most solar installed per capita. The city obtains 50 percent of its energy from solar, and is on track to buy two-thirds of all its energy from solar projects.
Several of the solar installations are on once-polluted properties, including a 500 kilowatt facility on a two-acre revitalized brownfield site at New Bedford High School. The city’s latest effort – a 1.8 MW installation on a 10-acre former toxic waste site – opened last fall and is expected to save the city $2.7 million in energy costs over its 20-year projected lifetime. The city still has one remaining project under construction – a 3.7 MW system in the New Bedford Business Park.
Since taking office in 2012, Mayor Jon Mitchell has spearheaded the city’s green strategy. The city’s solar projects are aimed not only at cutting local government’s utility bills and saving taxpayer dollars, but are part of a comprehensive environmental program to both clean up contaminated properties and reduce fossil fuel consumption. When complete, the combined solar energy projects will save the city government millions of dollars over the next 20 years through the availability of less expensive means of energy.
Former Bethlehem Steel Plant Gets New Life
Last fall in Lackawanna, New York, the City Council approved the installation of 13,000 solar panels on a portion of a former Bethlehem Steel plant site. When the steel mill shut down in the 1980s, the badly polluted 1,600-acre property sat dormant for two decades, before returning to productive use under the New York Department of Environmental Conservation’s Brownfield Cleanup Program. Now, the facility, which is operated by Apex Energy, will be one of the largest solar photovoltaic (PV) installations in New York State upon completion.
And, it will be the neighbor of one of the largest urban wind energy projects in the world – a 30-acre site also reclaimed from the sprawling, contaminated steel mill site. The two-phase Steel Winds project operated by Sun Energy and Apex Energy boasts 14 wind turbines with a capacity of 35 MW – enough clean electricity to power about 9,000 homes. The project has added hundreds of thousands of dollars in annual tax revenue to surrounding communities and school districts.
Risk Factors Must be Addressed
While brownfields may provide property owners and renewable energy developers with significant opportunities, such investments also carry risks. Therefore, project risk assessments and mitigation strategies must be addressed.
As with many other real estate opportunities, success depends on location, location, location. It is essential to identify the right brownfields property. Site studies are needed to determine the required level and cost of remediation to satisfy the environmental regulators, as well as the appropriate conditions for redevelopment, such as proximity to infrastructure, and the amount of available acreage on which to place the energy generation facilities. For example, solar projects often require more than 20 acres to be financially viable.
Another risk factor is liability. Risks must be addressed and managed. EPA and state environmental authorities have developed incentive programs with a variety of discretionary enforcement policies and property-specific documents to encourage site cleanups and facilitate contaminated property transactions and revitalization. Also, it may be more prudent to choose a property where remediation has been completed and the owner has received a “no further action letter” from the state regulatory agency. Further, the liability risk can be managed or mitigated, for example, through indemnity clauses in purchase and sale agreements or leases that allocate liability to the owner or responsible parties, as well as through environmental insurance policies to cover future unknown risks.
Before proceeding with a renewable energy project, it is important to determine whether a site is or may be subject to institutional or engineering controls that require approvals from appropriate regulatory agencies. And, a renewable energy project likely will need financing. Many traditional banks and equity providers may be reluctant to finance a project on a brownfield property. It is critical to identify financing partners who both understand the liability protections available to project lenders, and who are willing to support such projects.
If undertaken with the right combination of due diligence, creativity, incentives, and liability protections, the redevelopment of a brownfield into a renewable energy facility can provide a significant win-win proposition for many local communities.
Clean Technica
By Jeffrey M. Karp, Jerome C. Muys Jr., and Van P. Hilderbrand Jr.
July 21st, 2016
Jeffrey M. Karp, Jerome C. Muys Jr. and Van P. Hilderbrand Jr. are environmental law attorneys with Sullivan & Worcester. Email: [email protected]; [email protected]; [email protected].
DALLAS – Road, rail, and transit projects in 32 states and two U.S. territories will receive $500 million from the eighth round of a stimulus-era competitive federal grant program.
The 44 projects to be funded by the Transportation Investment Generating Economic Recovery (TIGER) grants were selected from 585 applications totaling more than $9.3 billion, Transportation Secretary Anthony Foxx told reporters in a conference call on Friday.
The highly competitive TIGER grants support projects that are often difficult to fund through conventional transportation programs, including road and bridge projects that span several jurisdictions, Foxx said.
“For the eighth year running, TIGER will inject critical infrastructure dollars into communities across the country,” he said. “This unique program rewards innovative thinking and collaborative solutions to difficult and sometimes dangerous transportation problems.”
The fiscal 2016 grants include $193 million for road projects, $97 million for transit, $87 million for passenger and freight rail, and $54 million for ports and maritime improvements, Foxx said.
“A great TIGER program doesn’t just improve transportation,” he said. “It expands economic opportunity and transforms a community.”
The $500 million of TIGER grants will support $1.73 billion of transportation infrastructure improvements because each $1.00 of a TIGER grant can leverage up to $3.50 in other public and private investments, Foxx said.
The first seven rounds of the TIGER program provided $5.1 billion of grants to 421 projects in all 50 states, the District of Columbia, and Puerto Rico. The latest round includes projects in Guam and the U.S. Virgin Islands.
More than 7,300 applications seeking a total of $143 billion have been submitted since the TIGER program began in 2009, the Transportation Department said.
TIGER is not included in the Fixing America’s Surface Transportation (FAST) Act that became law in early December. The grants must be renewed each year by Congress despite efforts by Democrats to make it a multiyear program.
The Senate has passed a 2017 transportation appropriations bill that would provide $525 million for TIGER next year, but a measure adopted by the House Appropriations Committee in May approved a cut in TIGER to $450 million.
President Obama’s proposed $73 billion transportation budget that never gained traction with lawmakers would have increased TIGER funding to $1.25 billion in fiscal 2017.
The largest grant this year is $25 million to the Chicago Transit Authority to upgrade an existing “L” train station and restore a segment of a historic track structure.
Flint, Mich., will receive a $20 million TIGER grant to rebuild city streets that will be torn up as the city moves ahead with a program to replace lead water pipes.
Pittsburgh will use its $19 million TIGER grant to put a cap over a below-grade portion of Interstate 579 to connect a residential district with the downtown area. The project includes a new bus stop, improvements to streets, and sidewalk upgrades.
Other grants include $10 million to Brownsville, Texas, for rehabilitation of a bus maintenance facility and the purchase of eight hybrid-fueled buses, $17.7 million for a highway freight interchange in Scott County, Minn., and $6.2 million for a river port in Little Rock, Ark.
The Bond Buyer
By Jim Watts
July 29, 2016
Economic data since March remain consistent with S&P Global Ratings’ forecast for continued slow growth. The United Kingdom’s vote in late June to leave the European Union added to an already uncertain global economic setting and is likely to weigh indirectly on U.S. GDP. Consequently, we have lowered our real GDP growth forecast for 2016 to 2.0% from 2.3%. The effects are likely to dissipate over time and result in only a modest revision to our forecast for 2017 growth to 2.4% from 2.5%. Fortunately for state and local governments, the key drivers of U.S. economic growth—consumer spending and the housing sector—are largely a function of domestic demand. Nevertheless, the uptick in uncertainty stemming from Brexit and slow GDP growth in the first quarter has led us to raise our risk of recession estimate over the next 12 months to 20%-to-25% from 15%-to-20%.
For most state and local governments, the new fiscal year began on July 1, in the wake of financial market shockwaves unleashed by the Brexit vote. Although equity markets initially tumbled in the immediate aftermath of the U.K. vote, they subsequently rebounded. Still, the tendency for markets to experience bouts of volatility has become a theme for 2016. This has cast a modest pall over the revenue outlook for state governments in particular, which tend to be more reliant on personal income taxes than their local government counterparts. Most states still project that tax revenues will increase in fiscal 2017, but at a slower pace than in 2015 and 2016. We also perceive that state revenue forecasts are subject to greater risk as a consequence of the increased financial market volatility. In addition, market volatility that struck in late June is likely to undermine investment returns for state and local government pension systems with a July 1 fiscal year. The California Public Employees’ Retirement System (CalPERS), for instance, reported that its investments earned just 0.6% for fiscal 2016, far short of its 7.5% assumed rate of return. We expect the trend toward weaker investment returns seen in fiscal 2015 and 2016 will translate to upward pressure on pension contributions for state and local governments, further squeezing their fiscal positions.
Overview
27-Jul-2016
Many developers seek to incorporate noncompete clauses in their P3 agreements to ensure their project investments will deliver an expected rate of return. However, one think tank cautions public agencies to consider what unforeseen changes could occur over the life of a project that may cause these provisions to turn what was a beneficial project into a public liability.
Noncompete clauses are designed to discourage the government from developing projects or policies that could compete for or in other ways reduce revenues the developer expects to earn from the project, the Center for American Progress explains in a July 27 report. Examples include provisions that penalize an agency for building a free road that could lure drivers away from a toll road the developer is building or passage of a law that suddenly imposes a statewide cap on the amount of fees that a toll road operator can impose.
Many developers see noncompete provisions as a way of decreasing their financial risk, regardless of the economic or political changes their public partners may initiate or endure. These agreements lock in financial stability for the private partner but this guarantee may come at the expense of the public partner’s bottom line.
The center cites Chicago’s decision in 2008 to lease many of its parking meters to a private company for 75 years in exchange for a one-time payment of $1.15 billion. Under the deal, the city retained some say over which and how many parking spaces it leased to the company but this flexibility came at a price. The city government agreed to pay a fee for making any policy or regulatory changes that might reduce the company’s parking fee revenues, such as adding public parking spaces close to the leased spaces, reducing parking fines below an agreed-upon level, reducing the number of spaces the company controls or relocating a company-leased parking space from a high- to low-demand area. Under the terms of this agreement, Chicago has thus far paid the firm $31 million for making these types of changes — at a period during which its population, and therefore, its tax base was on the decline.
“This suggests that the city would have been better off simply borrowing the sum it received through the deal. Issuing municipal debt would have provided needed capital at a fixed price without locking the public into an agreement that provides a low-risk, near monopoly position for a private concessionaire,” the center explains.
Because many P3 agreements stretch for decades, “government negotiators are forced to try to foresee all future possible scenarios — an essentially impossible task,” the report warns. The strict nature of many of these agreements lock governments into terms and conditions that can ultimately can work against rather than for the public good.
For this reason, policymakers should avoid noncompete clauses whenever possible. If noncompete clauses are deemed necessary, the state must ensure that the concessionaire accepts a lower rate of return that reflects the reduced revenue risk the provision provides,” the center advises.
NCPPP
August 1, 2016
Puerto Rico extended contracts worth $3.2 million with outside restructuring firms as the commonwealth defaulted on nearly $1 billion of principal and interest on July 1 and federal lawmakers passed legislation to oversee the island’s finances.
The commonwealth continued agreements with Cleary Gottlieb Steen & Hamilton LLP and Millstein & Co. on July 1, according to a review of contracts provided by the island’s Office of the Comptroller. That same day, Puerto Rico missed payments to general-obligation bondholders, the biggest default ever in the $3.7 trillion municipal-bond market.
Cleary Gottlieb, a New York-based law firm, will earn $2 million through June 30, 2017, for its advice as Puerto Rico seeks ways to reduce its $70 billion debt load. The commonwealth’s Fiscal Agency and Financial Advisory Authority is set to pay Millco Advisors LP, an affiliate of Washington-based Millstein & Co., $1.2 million for financial expertise, including $450,000 for possible expenses in any potential lawsuit or investigation regarding the firm’s restructuring work with the commonwealth. The one-month contract ends July 31. Millstein has a separate $3 million agreement with Puerto Rico that runs through December and would compensate the firm if a restructuring deal is finalized.
Shannon Lynch, a spokeswoman for Cleary Gottlieb, and Jenni Main, Millstein’s chief financial officer, declined to comment.
The two firms have been advising Puerto Rico since February 2014 on how the commonwealth can reduce it obligations and negotiating on its behalf with creditors. President Barack Obama enacted on June 30 a law that creates a federal control board to oversee a restructuring of Puerto Rico debt and to monitor the island’s budgets. The next day, the commonwealth defaulted on nearly $1 billion due to bondholders, including $780 million on general-obligation bonds.
Cleary Gottlieb contracts totaled $24.9 million and Millstein agreements were $16.4 million through June 30, 2016, according to the Office of the Comptroller.
Bloomberg Business
by Michelle Kaske
July 28, 2016 — 2:02 PM PDT
The $250 billion municipal hospital-bond market is proving immune to Donald Trump’s plan to eliminate Obamacare.
Sutter Health is among nonprofits tapping demand for the tax-free debt, with the California chain planning to sell $850 million in new securities this week. Health-care bonds are beating the overall $3.7 trillion municipal market for a third straight year as the federal law expanding medical coverage to Americans improves business. Despite the Republican presidential nominee’s goal, the rally has been undaunted as investors hunt for yield while rates hold near record lows.
“There’s lots of demand with all of the money pouring in,” said Mike Quinn, a managing director at Chicago-based investment bank Ziegler, which underwrites bonds for hospitals. “This is a really great environment for health-care borrowers to issue tax-exempt money.”
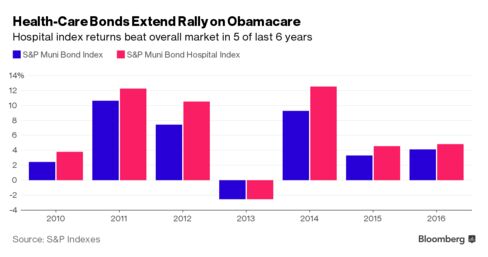
Borrowing costs have tumbled this year with money flooding into the securities amid turmoil in financial markets overseas, pushing the Bond Buyer’s 20-year index to as little as 2.8 percent this month, the lowest since the data began in 1961. Debt issued for hospitals has returned 4.8 percent this year, outpacing the 4.1 percent gain for the market overall, according to Standard & Poor’s indexes.
Much of the financial gains from President Barack Obama’s overhaul have already emerged, with about 20 million people gaining coverage through private insurance plans or state Medicaid programs since the passage of the law in 2010. Hospitals are now facing the prospect of reduced reimbursements as the government aims to shift from a model where it pays for services to one where it rewards outcomes.
Republicans have repeatedly failed to repeal the law in Congress, and court challenges to its key provisions were turned away by the U.S. Supreme Court. While Trump has pledged to ask Congress to scrap it as soon as he takes office, doing so outright would be difficult politically given how many Americans are now covered by it, Morgan Stanley analysts said in a July 12 report.
For S&P Global Ratings and Moody’s Investors Service, U.S. hospitals will manage the risks without undermining their credit ratings. Both companies have stable outlooks on the sector, meaning downgrades and updates will be roughly equal.
“We’re about to enter a period with more uncertainty, but the organizations have very strong balance sheets and operations,” said Kevin Holloran, an analyst at S&P. “The health-care system in America has proven over time to be very resilient and successful.”
After sitting on capital plans as implementation of Obamacare started, hospitals ramped up borrowing last year to retire more costly debt, with sales this year already exceeding those in 2014 and 2013.
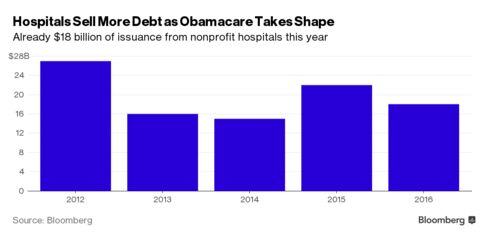
Sutter, which is issuing securities Tuesday through the California Health Facilities Financing Authority, is using the proceeds to refinance higher-cost debt and to help fund two new hospitals in San Francisco. Based in Sacramento, it runs 28 acute-care facilities, two recovery hospitals, four medical foundations and 15 home health-care locations.
“We have a consistent operating performance and excellent long-term stewardship of our balance sheet,” said Svend Ryge, Sutter’s treasurer.
Moody’s ranks the debt Aa3, the fourth-highest grade, citing its stable cash flow and its strong presence in California.
The breadth of the company’s business in California is a draw, said Todd Sisson, a debt analyst in Charlotte, North Carolina, for Wells Capital Management, which owns Sutter bonds among its $40.5 billion in municipals. While the company may buy some of the new securities, it’s limiting holdings of health-care debt because of the price run up and cuts providers face after reimbursement changes begin next year, he said.
“We’ve got considerable headwinds,” Sisson said. “The sector’s outperforming at the same time we’re seeing the risk increase.”
Sutter will see Medicare payments actually increase annually through 2019, bond documents show. Still, “estimates of future impact would not be reliable” from later calculations of reimbursements, according to the statement.
The industry has “immunity” to uncertainty, said S&P’s Holloran. “People still get sick, go to the doctor, get surgeries.”
Bloomberg Business
by Molly Smith and Romy Varghese
July 25, 2016 — 2:00 AM PDT Updated on July 25, 2016 — 6:46 AM PDT
America’s challenges will get worse without the support and commitment of the next administration to city issues
For over a year, the nation – and the world – has been wrapped up in the contest for the highest office in the land. We’ve seen 17 Republican presidential hopefuls whittled down to a businessman billionaire. We’ve seen a political revolution stopped short by a former Secretary of State and First Lady. We’ve seen mean tweets and rowdy stump speeches, #NeverTrump and a Speaker’s endorsement, and a lot about those damn emails.
It’s been a wild ride for sure. But let’s be frank: it’s time to get serious. At the National League of Cities (NLC), our goal is to empower local leaders to do what they do best: create environments that support families and businesses, and strengthen local economies. Cities and towns need a strong partner in the next administration. The candidates must engage in dialogue reflective of how government actually works. We need less talking points, and more policy, or the problems being ignored in 2016 will look easy by the year 2020. Here’s what’s at stake if we don’t:
1. Infrastructure Will Continue to Decline, Hurting American Competitiveness
The future of American infrastructure looks grim. The American Society of Civil Engineers (ASCE) gave the U.S. a D+ for overall infrastructure in 2013. From energy to hazardous waste, the U.S. is just points away from a failing grade in numerous categories. One in nine bridges is structurally deficient; 45 percent of American households have no access to public transportation; an estimated 240,000 water main breaks happen each year – just to name a few challenges.
Today, 80 percent of Americans live in cities, a number which is projected to increase in the next decade. Surging population growth will put stress on already strained infrastructure, causing more damage and hastening decay, even by 2020. While municipal governments are responsible to their constituents, they are not empowered to raise the revenue necessary to invest in long-term solutions. Cities need a strong partner in the next administration to keep infrastructure from falling into further disrepair.
2. Affordable Housing Will Be Increasingly Hard to Find
The market for affordable housing in the U.S. is rapidly shrinking. According to the Joint Center for Housing Studies, the number of new renters will outpace the number of new homeowners significantly over the next 15 years, raising rental property values and reducing the amount of overall affordable housing. This comes at a time when funding cuts have limited federal and local government investments in the construction of new affordable housing.
Meanwhile, as metro-areas continue to grow, moderate to low-income homes will be forced to find new housing accommodations or contribute more of their salary to rent. In 2013, over half of families with low to moderate-incomes spent over 30 percent of their income on rent, leaving less money for essentials like groceries and healthcare, not to mention savings accounts, retirement funds or other wealth-building systems. The next administration must work with cities to ensure safe, affordable and accessible housing remains a core element of the American Dream.
3. Natural Disasters Will Become More Challenging to Manage
Climate change affects cities differently across the U.S., but as average temperatures and sea levels rise, environmental and natural challenges will become more frequent and more devastating. Recently, Hurricane Sandy left between $10 and $15 billion in damages to infrastructure and private property. Cities located in the Gulf and along the Atlantic face threats to basic amenities like clean water and energy, a sector the U.S. Department of Energy reported will be particularly vulnerable to future storm damage.
In a different part of the country, the National Climate Change Assessment found that changes in rainfall and high temperatures will affect the lives and economies of 56 million people in the South and Southwest. Drought has decimated water supplies and changing weather patterns will make it difficult to predict precipitation, increasing competition for resources amongst cities. To prevent further loss, cities need significant investment in climate-resilient architecture and construction.
4. Local Economies Will Lack Skilled Workers to Drive Economic Growth
There are two different storylines playing out in cities: economic conditions are improving for some, but stagnating or worsening for others. While addressing rising inequality may require multiple policy solutions, what we do know is the changing nature of the economy, from advances in technology to shifts in the global market, underscore the need for proactive and effective workforce development.
According to city leaders, new businesses and business expansions are the most widespread positive drivers of local economic health. However, labor force challenges threaten to stymie this business growth and the economic benefits that would follow. City leaders report that the misalignment between available workforce skills and the skills employers’ need is the most widespread concern facing local economies. This concern will only grow if we fail to tackle the challenge.
5. The Opioid Epidemic Will Devastate More Families
Drug overdose is the leading cause of accidental death in the U.S., with 47,055 lethal drug overdoses in 2014. Opioid addiction is driving this epidemic, with 18,893 overdose deaths related to prescription pain relievers, and 10,574 overdose deaths related to heroin in 2014 (CDC 2015 Report). From 1999 to 2008, overdose death rates, sales, and substance use disorder treatment admissions related to prescription pain relievers increased in parallel. The overdose death rate in 2008 was nearly four times the 1999 rate; sales of prescription pain relievers in 2010 were four times those in 1999; and the substance use disorder treatment admission rate in 2009 was six times the 1999 rate.
By 2020, if we don’t stem the tide, these troubling trends will continue. In the U.S., we have reduced the number of smokers, the number of teen pregnancies, and the number of new HIV/AIDS infections over time. The lessons from these public health challenges can be applied to the present opioid drug epidemic. To make real progress in the fight against opioid addiction, all levels of government must work together in partnership.
6. More Lives Will Be Lost to Gun Violence
The U.S. has the highest homicide-by-firearm rate of any developed country. In 2015 alone there were 52,606 gun-related incidents resulting in 13,344 deaths. While Congress fails to address this epidemic, communities suffer the violent consequences. In 2020, we can expect wide-spread gun violence to be a persistent tragedy of life in America if don’t take action.
To reduce gun violence, legislation that regulates the possession of firearms is essential. NLC supports universal background checks on purchasers of guns, banning the sale of firearms to those on the terror watch list, and a 30-day waiting period for the purchase and transfer of all firearms. Within the past four years, we have witnessed tragedies in Newtown, CT, Aurora, CO, and Orlando, FL. There is no evidence that continued inaction from the federal government will end the violence. If the status quo is maintained, we will see continued loss of life in our communities.
The challenges cities face in the next four years are immense, but not insurmountable—and they can’t be solved by one level of government. In the next president, we need not only a leader, but a listener and collaborator. Whether Trump or Clinton, the future of our nation depends on what happens in cities.
Show your support and sign onto our Cities Lead campaign.
National League of Cities
by Carolyn Coleman
About the Author: Carolyn Coleman is NLC Senior Executive and Director of Federal Advocacy. Follow her on twitter at @CColeman_Cities.
We ought to be doing what many other countries are doing: making far more use of public-private partnerships for infrastructure.
Public-private partnerships may seem like the latest innovative way to finance crucial public needs, but P3s have been around for a while — quite a long while. In a recent Governing Guide to Financial Literacy, Justin Marlowe describes a Revolutionary War public-private partnership as a key factor in George Washington’s defeat of the British. After a grim winter spent at Valley Forge, where soldiers starved and died of disease, the Continental Congress authorized a reorganization of the army’s supply system and gave private contractors wide latitude in managing the logistics.
As successful as this arrangement was early in our history, we make far less use of such partnerships today than many other developed countries do. A study by the U.S. House Transportation and Infrastructure Committee found that while more than $61 billion was spent on highway P3s in this country from 1989 to 2013, that amount represented just 1.5 percent of the costs of all highway projects completed during that period.
Why such a small percentage? Well, it isn’t for lack of need. A 2015 Governing Institute survey found that half of state and local public officials believe lack of infrastructure investment is their most significant financial problem. Traditionally, governments have tapped tax-exempt bond markets to provide low-cost capital. But access to this market can be restricted for a variety of reasons, including limited bonding capacity or poor credit ratings, so P3s have the potential to bring in private-sector money to jump-start projects that might not happen otherwise. In countries that make strong use of them, P3s typically constitute about 5 to 10 percent of overall investment in infrastructure.
To be sure, there are hurdles to creating public-private partnerships. For starters, they require authorizing legislation. While most of the early P3s centered on transportation (California was first to pass legislation in 1989, followed by Florida and Missouri the next year) projects today can cover virtually every type of public infrastructure. P3 legislation varies state to state, and the National Conference of State Legislatures provides a detailed table of the specific types of authorized projects (including highways, toll bridges, buildings, and water and sewer systems) for each jurisdiction. As of this January, 33 states, Puerto Rico and the District of Columbia had enacted some form of legislation enabling P3s.
Given the gap between existing infrastructure needs and available funds, it’s not surprising that a number of recent papers and reports offer analyses and recommendations to help catalyze the use of P3s. This May, the Bipartisan Policy Center issued “Bridging the Gap Together: a New Model to Modernize U.S. Infrastructure,” which outlines the core principles of a new American model for investing in infrastructure centered on P3s. Those principles include public benefits identified and clearly stated; investment decisions based on a full life-cycle evaluation; project benefits, cost and risks completely accounted for and made publicly transparent; sharing by public- and private-sector partners of risks, costs and benefits; and comparing the costs of action against the costs of not investing.
In a recent paper, the West Coast Infrastructure Exchange points out that financing is just one of an entire set of project costs. The report segments these costs across the entire lifecycle of a project and describes how, through incentives, a focus on performance can integrate design, construction and maintenance responsibilities and counterbalance the higher cost of private capital to reduce overall project budgets.
That paper highlights British Columbia, with a relatively long history of using this performance-based P3 model, as a best-practice example: Since 2002, the province has completed 45 projects totaling $17 billion (with over $7 billion from the private sector). All of the projects were delivered on or before their due dates, and none had cost increases stemming from design or construction mistakes.
To be sure, developing a public-private partnership that’s likely to succeed requires considerable public-sector expertise. But there is a growing body of resources available to government officials. Organizations such as the National Governors Association and the American Association of State Highway and Transportation Officials, for example, offer interactive courses and peer-to-peer workshops on infrastructure financing. The U.S. Department of Transportation offers technical assistance and resources for states. And three states — Florida, Texas and Virginia — have established dedicated agencies to help promote and evaluate P3 opportunities. Virginia has long been considered a leader in this approach, and its website is worthy of review.
Clearly there’s a case for more use of P3s and other innovative approaches to meeting our growing infrastructure needs. The American Society of Civil Engineers’ last infrastructure report card, issued in 2013, gave a grade of D-plus to the overall condition of the nation’s infrastructure, citing conditions that are well known not only to public officials but also to the public: a backlog of overdue maintenance and a pressing need for modernization. ASCE’s next report card is due out this year. Will our grade be better? If not, that will certainly drive home the point that doing nothing has a cost.
GOVERNING.COM
BY BOB GRAVES | JULY 26, 2016
NEW YORK/SAN FRANCISCO — The 1923 middle school building in Oregon’s Corbett School District is so old that horses and trailers were used to dig the basement. It floods every winter, the building has no sprinkler system, and there is asbestos and lead paint in some spots.
Yet this May, voters struck down, for the fourth time, a plan to sell bonds that would pay for a new building, passing up an opportunity to finance the new school at a cost that may never be so low again.
Corbett is not alone. The amount of debt sold so far this year in the $3.7 trillion market for U.S. municipal and state debt is less than in 2015 despite record-low borrowing rates.
The yield on top-rated municipal 30-year bonds hit a bottom of 1.93 percent on July 6. That is far below the 3.27 percent of a year earlier and even below the comparable Treasury yield thanks to an income tax exemption granted to U.S. investors on the interest earned on most muni bonds.
There are several reasons why municipalities are slow in exploiting what could be a rare window of opportunity created by historically low global rates and investors’ intense hunt for higher returns.
For one, municipal borrowers have to clear hurdles including those at the ballot box, which makes it hard for them to respond quickly to changing market conditions.
Some communities are also still aching from recession-era budget cuts and remain reluctant to take on new debt service costs, however low they may be. Some are hemmed in by sluggish economies, big pension liabilities – which crowd out new projects – or both.
“Apart from the very large states and cities that typically are the leaders … (others) are still not sure that they have the backing of the voting population or the economic resources to expand their spending,” said VanEck Global portfolio manager James Colby, who buys municipal debt for the firm’s muni exchange traded funds.
For example, voters in Travis County, Texas, narrowly rejected a $287 million bond that would finance a replacement for an old, overcrowded courthouse in Austin, in part because of concerns that the chosen location might be too expensive.
New Jersey halted many state-funded road and bridge projects this month after lawmakers failed to extend the program that funds them because of a continuing battle over how to hike gasoline taxes to pay for new transportation spending.
Dysfunctional politics and fiscal strain also derailed last year’s budget in Illinois, which was a full year late, and in Pennsylvania, where a nine-month budget impasse left public schools struggling to stay open.
LESS DEBT
As a result, municipalities and states issued $227 billion in debt between January 1 and July 19, down 1.6 percent compared with the same period of 2015, according to Thomson Reuters data. The lion’s share of tax-exempt debt has been issued to refinance older bonds at lower rates, rather than fund new projects. (Graphic: http://tmsnrt.rs/29MmnHb)
Yet besides big issuers, in economically robust states, such as California and New York, it is America’s most troubled borrowers that have increased new borrowing.
Some are selling bonds now because buyers who previously shunned them are piling in looking for extra yield. Other communities must borrow to cover running costs or finish essential projects.
With negative yields in Germany and Japan and a global hunt for fixed income assets because of market volatility, some foreign investors are also buying U.S. municipal bonds, even though they do not get any tax benefits.
“We’re the best name in town right now in a very low-yield environment,” Blair Ridley, municipal bond portfolio manager at Deutsche Asset Management, said during a recent webinar.
Municipal bond funds recorded consecutive net inflows for the last 42 weeks, according to Lipper data, with inflows this year so far reaching $36 billion, compared with $13.8 billion for the whole of 2015.
Yet prospective issuers still face voter resistance.
“It’s a result of the credit crisis, an aversion to debt, and trying to right size the balance sheet,” said Peter Hayes, head of municipal bonds at BlackRock.
In Corbett, since the $11.9 million bond proposal was voted down, officials in the 1,100 student school district 20 miles east of Portland are now considering a costlier private loan that does not need voter approval.
“I keep telling people the interest rates are so low,” Superintendent Randy Trani said. “But it’s not happening.”
Some voters did not want to demolish a historical building. Many are also over the age of 50 and are averse to more costs, Trani said.
“They have no connection to the school at all. It’s hard to get them to vote to pay more taxes.”
By REUTERS
JULY 26, 2016, 6:18 A.M. E.D.T.
(Reporting by Hilary Russ in New York, Robin Respaut in San Francisco and Karen Pierog in Chicago; Additional reporting by Rory Carroll in San Francisco; Editing by Daniel Bases and Tomasz Janowski)
It isn’t unprecedented for the feds to spur local pension reform. Kennedy and Reagan both did.
The pensions of states and local governments are, collectively, trillions of dollars in the hole. This debt is crippling budgets and will dump an enormous burden on future generations. Yet state and local politicians have proven that they cannot, or will not, solve the problem. The federal government ought to step in. But how?
Instead of bailing out these pensions, Congress should pass a law allowing states and local governments to reduce promised benefits—something that is now illegal under some states’ statutes or constitutions. Congress should stipulate that pension plans must be in very bad shape to qualify for relief, and the politicians in charge of them would have to voluntarily seek it. Most important, pensions should be required to uphold their original intent: to keep retirees who can no longer support themselves out of poverty.
Even with those restrictions, significant savings could be made. Many pensions allow retirement at age 55; states and local governments could mandate that benefits cannot be drawn until age 65. Payments could be capped at 150% of the median income in the local jurisdiction. Automatic cost-of-living increases that now exceed expected inflation could instead be tied to increases in the median income.
Troubled plans should qualify for relief only if their funding ratio falls below 50% and has failed to improve over the past five years. These are the plans that are in fiscal quicksand and cannot be saved without significant changes.
Local governments must also be required to terminate their defined-benefit plans. These should be replaced with defined-contribution plans, like 401(k)s or 403(b)s, or active employees could be enrolled in Social Security. Responsible officials are already taking this step: The board of the Tennessee Valley Authority voted in May to switch to a 401(k)-type plan and lower the cap on cost-of-living adjustments.
Once these steps are taken, the local government should be required to fully fund the remaining pension liability with a tax increase. That should be the deal: To receive the relief of reducing promised benefits, they must agree to solve the pension problem once and for all.
What would this look like in practice? Let’s say that a retired firefighter in a troubled pension plan is set to receive $70,000 annually. If that is below 150% of the median income in his local jurisdiction, under federal relief his annual benefits would never be subject to the cap, since they would rise as the local median income increases.
What about a retired cop who became a city councilman and later a county supervisor—an extreme, but not unheard of, case? The cop would not be able to collect three pensions and would have his benefit reduced to meet the cap. Both the firefighter and the politician would have to wait until turning 65 to receive benefits.
No one wants to see his benefits reduced. Yet keep in mind that a retiree who receives a $75,000 pension for 30 years, with 3% compounded cost-of-living adjustments, gets total payments of more than $3.4 million. This has become common in cities like Chicago.
I am not the first person to suggest federal intervention. Rep. Devin Nunes (R., Calif.) proposed withholding federal aid to government entities that don’t accurately report pension funding. That would be a step forward but would not solve the problem of underfunding.
Diana Furchtgott-Roth of the Manhattan Institute has proposed a law that would allow local governments to seek relief from pension debt in bankruptcy court. But this leaves too much discretion to judges and could lead to wildly different outcomes. Plus, such open-ended relief would be fiercely fought by public-employee unions every step of the way.
Federal intervention is not unprecedented. The Windfall Elimination Provision of the Social Security Act, an amendment that was passed in 1983, allows the federal government to reduce Social Security payments when recipients also receive pensions from public employment. This has curbed double-dipping and protected the Treasury.
Nor should a new plan for federal relief be seen as a purely partisan issue. In 1961 President John F. Kennedy established the Committee on Corporate Pension funds. This eventually led to the Employee Retirement Income Security Act of 1974, which outlawed abuses and forced private firms to put required money into their pension plans each year.
The plan outlined here would create a consistent and concrete path toward making pensions manageable for taxpayers. At the same time, it would protect retirement income for those unable to support themselves. The next president and Congress should take action to allow local governments to address this monumental problem—which gets worse by the day.
THE WALL STREET JOURNAL
By ED BACHRACH
July 17, 2016 7:22 p.m. ET
Mr. Bachrach is the founder and chairman of the Center for Pension Integrity.
The municipal-bond market’s rally is facing election year headwinds from Donald Trump.
The real estate developer and reality television star, who accepted the Republican presidential nomination Thursday night, has proposed slashing the top individual income-tax bracket from 39.6 percent to 25 percent, the lowest since 1931. That would sharply reduce the incentive to own tax-exempt bonds, whose yields have slipped to record lows as investors pour money into the safest assets and central banks hold down interest rates.
“He has a pretty aggressive tax reduction plan,” said Mikhail Foux, head of municipal strategy at Barclays Plc in New York. “Taxes going down is always bad for munis compared to Treasuries.”
U.S. presidential elections can have outsized significance for the $3.7 trillion municipal market — a haven of buy-and-hold investors looking for tax-free income — because they often result in changes to tax policy. Typically, Republicans cut taxes on the highest earners, while Democrats raise them.
The benefit of owning state and local-government bonds over other fixed-income securities declines when levies are reduced and increases when they rise. Yields — which move in the opposite direction as price — fell relative to U.S. Treasuries after Bill Clinton’s victories in 1992 and 1996, and again after President Barack Obama’s re-election in 2012, according to Barclays. They increased after Republican George W. Bush’s victory in 2000, which led to tax cuts.
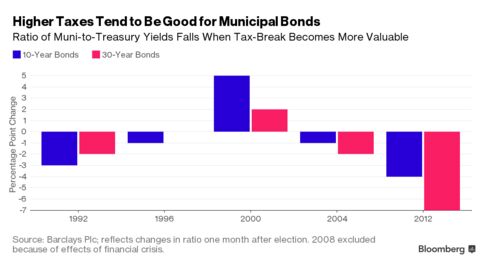
Top-rated 10-year municipal bonds yield 1.47 percent, or about 93 percent of what Treasuries with comparable maturities offer. For an investor in the top income-tax bracket, the tax equivalent yield is 2.6 percent, or about 1 percentage point more than Treasuries with the same maturity. At a top bracket rate of 25 percent, the tax-equivalent yield is 1.96, or about 0.5 percentage point more than Treasuries.
Municipal bonds have gained every year but one since President Barack Obama took office in 2009, according to Bank of America Merrill Lynch indexes, as the Federal Reserve held interest-rates near zero and taxes were raised on the highest earners.
Trump’s plan is estimated to cut federal revenue by $9.5 trillion and swell the debt by $11.2 trillion over the next decade, according to the Tax Policy Center, a joint venture of the Urban Institute and Brookings Institution. The proposal may be scaled back: he’s expected to release a revised plan that calls for reducing the top rate to between 28 percent and 33 percent, closer to what House Speaker Paul Ryan has endorsed, according to the Washington Post.
The demand for municipal bonds could also be eroded by Hillary Clinton’s proposals, though not by nearly as much. While her plans include higher taxes on incomes over $5 million, she has also endorsed establishing a minimum 30 percent levy on filers earning more than $1 million and capping the value of tax exemptions, which could reduce the tax-breaks given to owners of the debt.
Municipal yields could increase by more than 1 percentage point under Trump’s original plan and 0.35 percentage point under Clinton’s, assuming prices are driven by investors in the highest tax bracket, according to Morgan Stanley’s chief municipal strategist Michael Zezas.
But demand from lower-income investors could offset some of that: About 45 percent of returns that reported tax-exempt interest had adjusted gross incomes less than $200,000, according to the Internal Revenue Service. And enacting major tax overhauls are difficult, regardless of who controls Congress.
“It’s extremely difficult to get the consensus required for what might be called fundamental tax reform,” said Phil Fischer, the head of municipal research at Bank of America Merrill Lynch. “Nobody knows what that is any more.”
Barclays’ strategists predict that if Trump wins, the GOP would likely control Congress but wouldn’t have a super-majority in the Senate. After an initial period of volatility and a flight to safer assets, 10-year Treasury rates could rise as much as 0.5 percentage point because of fiscal stimulus generated by individual and corporate tax cuts. With municipal rates forecast to increase even more, that may lead investors to pull money from mutual funds that invest in state and local debt.
“We can expect outflows when rates increase significantly,” Foux said. “That’s historically what we see.”
Bloomberg Business
by Martin Z Braun
July 22, 2016 — 2:00 AM PDT Updated on July 22, 2016 — 7:09 AM PDT
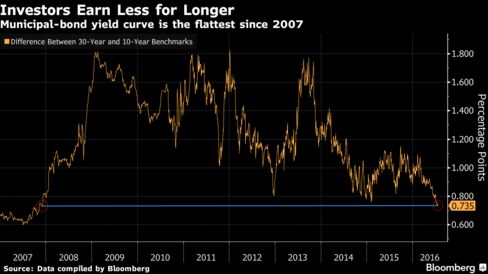
The gap between short- and long-term yields in the $3.7 trillion municipal-bond market is the narrowest in more than eight years. Benchmark 30-year munis yielded 0.735 percentage points more than 10-year securities on Wednesday, the smallest difference since November 2007. This means that investors are earning less for the risk of holding securities with longer maturities.
Bloomberg Business
by Elizabeth Campbell
July 21, 2016 — 7:57 AM PDT
MainStay Investments is increasing the percentage of cash held in its municipal bond mutual funds as a hedge against the risk of investor redemptions if the outperforming tax-exempt market turns.
It’s $2.7 billion high yield muni fund has raised its cash level to as much as twice its normal range for liquidity, said David Dowden, a managing director who helps oversee about $19 billion of local debt at Princeton, New Jersey-based MacKay Municipal Managers, the fund’s sub-adviser. The fund had about 9.6 percent of its portfolio in cash-equivalents as of April 30, the most in two years.
“When everyone suddenly gets all on the same side of the trade, that makes for a very dangerous situation,” Dowden said during an interview last week. “That’s what we saw in June of ’13.”
U.S. state and local-governments have taken in cash for 41 straight weeks, according to Lipper U.S. Fund Flows data, as anxiety that the Federal Reserve would raise rates receded and investors sought out the higher tax-adjusted yields and lower volatility than they can find elsewhere. During that period, munis have posted a total return of 5.8 percent, compared with a broader bond market gain of 4.2 percent, according to Bank of America Merrill Lynch index data.
The $45 billion inflow since October has helped replace the cash lost during the “Taper Tantrum” of June 2013. Investors pulled $65 billion from muni funds between June 2013 and January 2014 after then-Fed Chair Ben Bernanke jarred bond investors with plans to scale back asset purchases. The broad sell-off in the bond market highlighted a liquidity squeeze in the muni market, which was hit harder than Treasuries. Between June and the end of August 2013, yields on 30-year AAA rated municipal bonds rose almost 1.5 percentage point.
The level of liquidity risk is lower than in 2013. Banks are more willing to step in and buy and investors are less prone to yank money because munis are producing income, said Dowden. The U.K. vote to leave the European Union has lowered the likelihood that the Fed will raise interest rates before the U.S. elections in November. Muni prices rose following “Brexit” as investors clamored to safety.
As the yield curve flattened, Mainstay has focused its buying on bonds maturing from 12 to 25 years rather than long-term debt maturing in 25 to 30 years, which are more sensitive to changes in yields. Mainstay’s High Yield Municipal Bond Fund has returned 7 percent this year, beating 77 percent of its peers, according to data compiled by Bloomberg.
“The reality is that incremental yield can be burned away very quickly in a price move,” Dowden said.
The market pulled back last week as investors balked at yields that reached record lows and data on manufacturing and retail sales bolstered optimism in the economy. Yields on top-rated 30-year municipal bonds rose to 2.17 percent from 2.09 percent, the biggest weekly increase since February, according to data compiled by Bloomberg.
Some high yield managers are boosting their cash position for a different reason: they can’t find securities that offer value in a market that has run-up more than 12 percent in the last year.
“There’s so much cash in and everyone’s buying because they have to buy,” said Matt Dalton, chief executive officer of Rye Brook, New York-based Belle Haven Investments, which oversees $5 billion of municipal bonds. Belle Haven is the sub-adviser for Transamerica’s High Yield Muni Fund, which had had 13 percent of its assets in cash as of April 30.
“We’re content with having more cash than we’d like to because of the dearth of opportunities,” Dalton said.
Bloomberg Business
by Martin Z Braun
July 19, 2016 — 2:00 AM PDT Updated on July 19, 2016 — 7:16 AM PDT
At the advent of the financial crisis nearly a decade ago, former Citigroup Inc. banker Robert Novembre, who managed the firm’s desks handling auction-rate securities, saw firsthand the disruption caused when banks withdrew support.
Dozens of banks stopped being buyers of last resort for auction-rate securities and variable-rate demand debt, leaving investors with bonds they couldn’t sell and borrowers with little control of the interest rates on their debt. The $200 billion auction-rate securities market shriveled and Citigroup was among the banks that reached settlements with state and federal regulators to resolve claims they misled investors. The variable-rate market limped on in a smaller state.
Now Novembre, 47, plans to apply the lessons to a new alternative trading system for variable-rate debt. Within weeks, his Clarity BidRate Alternative Trading System, a division of Arbor Research & Trading LLC, expects to launch its first variable-rate demand deal as part of an enterprise designed to cut costs for state and local governments by getting bids from investors rather than relying on banks to remarket the debt.
“It’s a very antiquated market that functions in the shadows,” Novembre said. “But there’s a conflict of interest in pricing because the banks are protecting their own balance sheets. Banks aren’t pushing down the rates any more because they don’t want to own the bonds.”
The need for more competition has been shown of late as yields have come off historic lows of about 0.01 percent and soared to about 0.40 percent since the Federal Reserve raised its benchmark rate in December for the first time in almost a decade.
During the height of the market freeze, the weekly re-set rate on the index climbed as high as 7.96 percent.
Despite interest rates that are still low historically, the variable-rate demand market has been shrinking since the collapse of first auction-rate securities and then variable-rate demand obligations after sub-prime contagion brought down insurers and buyers of last resort in the muni market. Many banks and investors were stuck with debt they couldn’t sell, while some issuers were forced into costly interest rate penalties and expensive restructuring. The variable-rate market stood at $222 billion and the auction-rate market was $27 billion in March 2014, according to the Municipal Securities Rulemaking Board.
Now with rates potentially poised to rise, Moody’s Investors Service and others have predicted that borrowers may renew interest in the variable-rate structure to cut borrowing costs. New U.S. Securities and Exchange Commission rules requiring tax-exempt money-market funds to use floating net asset calculations also are encouraging more use of variable-rate debt.
The Securities Industry and Financial Markets Association, which represents banks and broker-dealers, supports the system of remarketing agents that “has served the market well for decades,” said Michael Decker, managing director and co-head of the municipal finance division, in an e-mail. He declined to comment specifically on Novembre’s company. That said, the association does “welcome market innovations that contribute to efficiency,” Decker said.
Novembre, who worked for 18 years for Citi and oversaw about $170 billion of auction-rate securities, variable-rate demand obligations and tender-option bonds when the variable-rate markets collapsed starting in 2007, said his bank and others were glad to buy bonds to support the markets until it became a risk to their capital. Under variable-rate arrangements, remarketing agents aren’t required to buy back the debt but did so voluntarily to support the market.
Trading Platform
With variable-rate demand obligations, issuers pay for so-called liquidity facilities, or buyers of last resort, that buy back the bonds when investors don’t want them, something that can happen when the yields are reset.
During the global market turmoil, many buyers panicked and tried to unload the bonds because of fears generated by a freeze in fixed-income markets such as mortgage-backed securities. Following the auction-rate debacle in 2008, variable-rate demand obligations tumbled as buyers faced losses.
“There was a lot of fear,” said Novembre. “People quickly started putting the bonds to the bank. The banks were no longer using their balance sheets to support the market.”
Today, he said, that is still true because “dealers are loathe to deploy their balance sheets” amid increased regulation since the financial crisis.
By updating the market with an electronic-trading platform that replaces the traditional remarketing arrangement, Clarity is providing a place where buyers and sellers can make bids and offers for bonds that investors don’t want to hold with more complete information about the market, he said.
Remarketing Role
“There is too much negotiation involved in setting yields now,” he said. “There is an element of human decision making in setting the yields, instead of the actual market place competition.”
Under his system, Clarity takes over the remarketing role, but instead of setting rates, buyers and sellers can see all the bids and offers and make their own bids and offers on an on-line trading platform during a remarketing period — up until the period for reselling the bonds closes.
“We take all the subjectivity out of it,” he said. “Issuers are put in a position of competitive pricing.”
Bloomberg Business
by Darrell Preston
July 18, 2016 — 2:00 AM PDT Updated on July 18, 2016 — 7:32 AM PDT
David Hammer, Head of Municipal Bond Portfolio Management, discusses the impact of lower commodity prices on high yield municipal bonds, and why energy producers may be more concerning than oil revenues.
For more information, visit www.pimco.com/munis
DAVID HAMMER
JULY 2016
This Hawkins Advisory is of interest to single-family housing bond issuers.
7/20/2016
Shivani Singh and Ashley Ramchandani provide an overview of our recent higher education median reports for public and private colleges and universities. Paul Dyson discusses our take on the impact of the recently-enacted Puerto Rico Oversight, Management, and Economic Stability Act (PROMESA) on Guam and the U.S. Virgin Islands.
Jul. 22, 2016
U.S. District Judge Gerald E. Rosen has more experience than most in resolving thorny cases of municipal distress: He was the mediator in the high profile bankruptcy of Detroit. What lessons did he draw from that experience that might apply to future municipal bankruptcies? We put that question to him at our recent Municipal Finance Conference, and he offered what he calls “The Four C’s.”
Candor
“As we began talking to the creditors and to the city…they were in denial across the board…We said denial…is not a way to move forward. We had to go through that ventilation process in the beginning.”
Judge Rosen said he found that both the creditors and the parties were initially unwilling to be honest, with each other and even with themselves. They did not fully accept the dimensions of the structural debt problems and did not recognize the degree to which the city’s ability to fund and deliver essential government services was compromised. Working in a state of denial will not advance the interests of the city, he said. Openness and honesty are integral to resolving financial troubles.
Cooperation
“My job as the mediator [was] to get the parties together and the earlier the better.”
After listening to accounts of other cases of municipal distress, Judge Rosen suggested that some crises could have been avoided with earlier “facilitation of discussion between the various credit groups and the municipalities.”
Creativity
“Every city has human assets, every city has physical assets, every city has revenue assets, so focus on creative ways to leverage those assets.”
Detroit struck a “grand bargain” in which the city essentially sold the Detroit Art Museum to a collection of foundations, nonprofits and other donors to raise money for its underfunded pensions. Judge Rosen said that was just one of several creative elements in Detroit’s bankruptcy resolution. Of course, the exact solutions to any particular crisis will depend on the circumstances, but the essential element is that “smart people who can get on the same team and look down the road, not just to get their piece of the pie, but to make the municipality healthy so there will be a bigger…pie at the other end.”
Courage
“Detroit is really not [just] a series of deals over sixteen months….it’s about people from all different walks of life, backgrounds, strata, coming together to put behind them the mistakes and ghosts of the past.”
The Detroit bankruptcy, he said, could have resulted in a decade of litigation that went all the way to the U.S. Supreme Court. But if that had occurred, there would have been nothing left of Detroit. Instead, all the interests came together to “take a leap of faith” to find a solution that was in the best, long-term interests of the city, its creditors, it employees and its people.
Here’s a video of Judge Rosen’s remarks.
The Brookings Institution
Evan Bursey and David Wessel | July 20, 2016 9:24am
The Governmental Accounting Standards Board (GASB) is currently conducting research on indicators of severe financial stress and going concern disclosures. As part of their research effort, the GASB has developed an online survey to solicit thoughts and ideas.
The survey will be open until Friday, August 5, and may be accessed here.
Treatment of Municipal Securities in Fed’s Final HQLA Rule Draws Unenthusiastic Industry Reactions
On April 1, 2016, the Federal Reserve Board released its final regulations[1] respecting treatment of municipal securities as high-quality liquid assets (“HQLA”) for purposes of its liquidity coverage ratio rule for “covered companies” – the 11 most highly capitalized United States banks – after strenuous criticism from the municipal securities industry and a Congressional response that included a bill that has passed in the House of Representatives[2]. In the final rule, the Federal Reserve Board revised the original proposal by modestly expanding those municipal securities that would qualify for inclusion in a covered company’s HQLA, but rejected most commenters’ recommendations. The following discussion summarizes the original Fed proposal, the principal comments from affected trade groups, the final regulation, the Fed’s rationale for its determinations and the pending legislation.
Financial Crisis and Bank Regulatory Response
In the aftermath of the financial crisis of 2008 and 2009, international banks sought to ensure sufficient liquidity for the largest banks by establishing a quantitative liquidity coverage ratio standard pursuant to the Basel III capital and liquidity reforms. United States bank regulators, including the Board of Governors of the Federal Reserve System (the “Fed”), the Office of the Comptroller of the Currency (the “OCC”), and the Federal Deposit Insurance Corporation (the “FDIC”) published a joint Notice of Proposed Rulemaking (the “NPR”), adopted on September 3, 2014[3], that established a Liquidity Coverage Ratio (“LCR”) to be maintained by larger banks and holding companies[4]. The LCR would require covered institutions, during periods of non-stress, to maintain an amount of high-quality liquid assets that is not less than 100% of its total net cash outflows over a prospective 30 calendar day period.
Significantly for municipal securities issuers and the municipal securities industry, securities issued by “public sector entities” (i.e., state and local government issuers) were not included as HQLAs in the original NPR.
Objections to NPR and Subsequent Fed Proposal
After predictable objections from trade groups representing municipal issuers, banks and the municipal securities industry, based upon potential harm to municipal securities issuance from exclusion of municipal securities as eligible HQLAs under the NPR, on May 28, 2014, the Fed (but without participation by the OCC or the FDIC) issued a proposal (the “Fed Proposal”) that would permit covered institutions to include certain U.S. municipal securities as HQLAs under strict criteria described below.
The Fed Proposal
The Fed Proposal limits eligibility of U.S. municipal securities to investment grade general obligations that are not insured. Revenue obligations, irrespective of credit standing, would not qualify as HQLAs[5]. Additionally, the Fed Proposal imposes significant concentration risk limitations on a covered institution’s holdings of HQLA-eligible U.S. municipal securities:
Issuer and Industry Comments
During the public comment period on the Fed Proposal, which ended July 24, 2014, the Fed received 13 comment letters from issuers and industry groups[6]. All commenters argued that the HQLA standards for municipal securities in the Fed Proposal were excessively limiting, with the exception of Better Markets, Inc., which argued that municipal securities should not be included in HQLAs at all because of the provision in the Fed Proposal that leaves the determination whether a security is “investment grade” to the covered institution itself.
A primary objection from all trade group commenters – including the Securities Industry Finance and Marketing Association (“SIFMA”), the Bond Dealers Association (“BDA”) and a joint comment from 15 issuer groups that included the Government Finance Officers Association, the National Association of Counties, the National League of Cities and the U.S. Conference of Mayors – was the exclusion of investment grade revenue obligations from HQLA eligibility. Specifically, SIFMA noted that the credit quality of many revenue obligations is regarded by the market as preferable to general obligations, particularly in light of adverse treatment of general obligations in recent municipal bankruptcies such as Detroit’s. Indeed, the PFM Group noted that the Fed Proposal “reduces the universe of outstanding eligible municipal securities by more than $2 trillion.” Likewise, the Bond Dealers Association noted that the exclusion of revenue securities from HQLA effectively limits the municipal securities that would be eligible for inclusion as HQLA to less than 40% of securities issued in 2015.
Commenters, including municipal bond insurer Build America Mutual Assurance Company, also criticized the exclusion of insured general obligations from the HQLA eligibility, arguing that the Fed Proposal misconceived the role of bond insurance of otherwise investment grade obligations, which does not substitute for the underlying credit and actually adds liquidity to such securities.
Regarding the concentration risk limits in the Fed Proposal, commenters argued that they are based on misunderstandings of the municipal market. With regard to the limitation to 25% of a pertinent CUSIP (i.e., maturity), commenters argued that the rule would push banks to hold many smaller portions rather than large-block portions that are more liquid because of their appeal to institutional investors. SIFMA argued that the 25% limit is actually counterproductive to liquidity and that, alternatively, this rule should be dropped “in favor of reliance on the risk management systems banks already have in place.”
Regarding the two-times average daily trading volume limitation, SIFMA noted that historic trading volume may not be the best indicator of liquidity in that many bonds are bought as buy-and-hold investments.
Regarding the limitation of U.S. municipal securities to not more than 5% of a bank’s total HQLA, SIFMA noted that no other asset class eligible for inclusion in HQLA, including corporate securities, has an asset-specific limitation. Additionally, the LCR rule separately limits 40% of total HQLA for Levels 2A and 2B combined and has a 15% limit for Level 2B. Thus, SIFMA argued that the existing limitations are sufficient without the addition of the 5% limit.
Pending Legislation
In response to dissatisfaction with the Fed Proposal and the non-participation of the FDIC and OCC in establishing uniform HQLA standards, Representative Luke Messer (R-Ind.) and co-sponsor Representative Carolyn Maloney (D-NY) introduced legislation that would require the Fed Rule “to treat a municipal obligation that is both liquid and readily marketable (as defined in the Final Rule) and investment grade as of the calculation date as a high-quality liquid asset that is a level 2A liquid asset.” The legislation would also require the FDIC and the OCC to conform their HQLA regulations to this statute. The proposed legislation passed the House of Representatives on February 1, 2016, as H.R. 2209 and has been referred to the Senate. As of this writing, there is no Senate sponsorship.
The Final Fed Rule and the Fed’s Rationale; Industry Disappointment
The final Fed Rule makes two basic changes to the Fed Proposal: First, general obligation municipal securities insured by a bond insurer may count as Level 2B liquid assets as long as the underlying municipal security would otherwise qualify as HQLA without the insurance. Second, the final Fed Rule eliminates the 25% limitation on the total amount of outstanding securities with the same CUSIP number that could be included as Level 2B liquid assets. Notably, the final Fed Rule continues to exclude revenue obligations from HQLA status. A summary of the Federal Reserve Board’s rationale for the final Fed Rule is set out in the following footnote[7] .
The final Fed Rule will take effect on July 1, 2016.
In interviews with The Bond Buyer[8], Congressional and trade group spokespersons expressed disappointment in the final Fed Rule. Representative Luke Messer said “Unfortunately, [the rule changes] will continue to discourage investment in our local communities. And, it will do little, if anything, to help cash-strapped school districts and municipalities finance critical infrastructure projects.” John Vahey, Director of Federal Policy at Bond Dealers of America, observed that it is “unfortunate that the Fed has chosen to continue to restrict and limit the use of general obligation bonds and completely exclude high-quality revenue bonds from the banking liquidity rule.”
Potential Impact of the Final Fed Rule? Prospects for a Legislative Override?
What, then, will be the impact of the Fed Rule as adopted? On the one hand, indications are that the HQLA limitations will reduce demand for U.S. municipal securities for covered banks and thus result in increased interest rates for securities bought by covered banks. Also, the continuing absence of a joint regulation that includes the OCC and the FDIC could result in differential standards that could disrupt the market even further. However, since the Fed Rule, as finally adopted, will directly affect only a dozen or so of the largest U.S. banks, it is unknown whether the ultimate Fed HQLA standards will affect non-covered bank lenders and the bond market generally[9].
In light of the passage of House Resolution 2209, the matter is not fully resolved. Whether House Resolution 2209 gains a Senate sponsor and can pass during this election year (not to mention the possibility of a Presidential veto) is speculative, but the industry response to the Fed’s action on HQLA may not be finished yet.
by E. Alston Ray and Caitlyn T. Smith
July 14, 2016
Footnotes
[1] 81 Fed. Reg. 21223 (April 11, 2016).
[2] H.R. 2209, passed February 1, 2016.
[3] 79 Fed. Reg. 61439 (October 10, 2014).
[4] U.S. banks currently meeting the criteria for “covered companies” under the Basel III standards are as follows: J.P. Morgan Chase & Co., Bank of America, Citigroup, Wells Fargo & Co., Goldman Sachs Group, Morgan Stanley, U.S. Bancorp, Bank of New York Mellon, PNC Financial Services Group, Capital One, HSBC North America Holdings, State Street Corporation, and TD Bank U.S. Holdings.
[5] The LCR divides HQLA into three categories of assets: Level 1, Level 2A, and Level 2B liquid assets. Specifically, Level 1 liquid assets are limited to balances held at a Federal Reserve Bank and foreign central bank withdrawable reserves, all securities issued or unconditionally guaranteed as to timely payment of principal and interest by the U.S. government, and certain highly liquid, high credit quality sovereign, international organization and multilateral development bank debt securities. Level 1 liquid assets, which are the highest quality and most liquid assets, may be included in a covered company’s HQLA amount without limit and without haircuts. Level 2A and 2B liquid assets have characteristics that are associated with being relatively stable and significant sources of liquidity, but not to the same degree as Level 1 liquid assets. Level 2 liquid assets include obligations issued or guaranteed by a U.S. government-sponsored enterprises (GSE) and certain obligations issued or guaranteed by a sovereign entity or a multilateral development bank that are not eligible to be treated as Level 1 liquid assets. The LCR subjects Level 2A liquid assets to a 15% haircut and limits the aggregate of Level 2A and Level 2B liquid assets to no more than 40% of the total HQLA amount. Level 2B liquid assets, which are liquid assets that generally exhibit more volatility than Level 2A liquid assets, are subject to a 50% haircut and may not exceed 15% of the total HQLA amount. Under the LCR, Level 2B liquid assets include certain corporate debt securities and certain common equity shares of publicly traded companies. Level 2 liquid assets, including all Level 2B liquid assets, must be liquid and readily marketable as defined in the LCR to be included in HQLA. Under the LCR final rule, U.S. municipal securities were not included in the definition of HQLA. However, under the final Fed Rule all U.S. municipal securities that qualify as HQLAs will constitute Level 2B liquid assets.
[6] All public comments to the Fed Proposal are available on the Fed website at http://www.federalreserve.gov/generalinfo/foia/ProposedRegs.cfm.
[7] In its summary of the final rule, the Federal Reserve Board offered the following rationale for its determinations (emphasis added):
a) Certain US municipal securities may be included as a level 2B liquid asset if they meet the liquid and readily marketable standard in the LCR rule
i) These securities will not be included as a level 2A liquid asset
b) Revenue bonds still are not eligible for inclusion as a level 2B liquid asset:
i) During periods of significant stress, the credit equality of revenue bonds tends to deteriorate more significantly than general obligation bonds.
ii) During times of significant stress, probability of default is considered along with the magnitude of expected loss upon default. Without general taxing authority support, the market would likely be more concerned about the probability of default for a revenue bond as compared to a general obligation bond.
iii) Historically, there have been a significantly higher number of defaults on revenue bonds than general obligation bonds.
iv) Liquidity could disappear if the specified revenue source of a revenue bond were found to be insufficient to meet its obligation, regardless of the total amount of the revenue bond outstanding.
c) A Board-regulated covered company may include as a level 2B liquid asset a US general obligation municipal security that has a guarantee from a financial institution as long as the company demonstrates that the underlying US general obligation municipal security meets all of the other criteria to be included as level 2B liquid assets without taking into consideration the insurance.
d) The final rule retains the limitation on the inclusion of US general obligation municipal securities of a single issuer. A Board-regulated covered company that owns more than 2x the average daily trading volume of all US general obligation municipal securities issued by a public sector entity may include up to 2x the average daily trading volume of such securities as eligible HQLA:
i) The Board believed that this 2x average daily trading volume cap could likely be absorbed by the market within a 30 calendar-day period of significant stress without materially disrupting the functioning of the market.
ii) The Board believed that this requirement ensures that US general obligation securities included as eligible HQLA remain relatively liquid and have buyers and sellers during periods of significant stress.
e) The final rule retains the 5% limitation on the amount of US municipal securities that can be included in a Board-regulated covered company’s HQLA amount:
i) The Board believed this limit will act as a backstop to address the overall liquidity risk presented by the municipal securities market, including the large diversity of issuers and sizes of issuances by ensuring covered companies’ HQLA amounts are not overly concentrated in and reliant on US municipal securities.
f) The final rule eliminates the 25% limitation on the total amount of outstanding securities with the same CUSIP number that could be included as level 2B assets:
i) This limitation could have barred certain companies from including certain municipal securities, and particularly small issuances, in their HQLA amount.
[8] “Fed Rule Treating More Munis as HQLA Seen As Too Restrictive,” The Bond Buyer, April 1, 2016.
[9] Many thanks to Belinda Hannah at First National Banker’s Bank in Birmingham, Alabama, and Alan Ganucheau, Greg Brewer, Jason Thomas and Steve Cole at Hancock Bank, for taking the time to discuss the Fed Proposal and its potential impact on the municipal securities market. However, nothing in this post is attributable to them or their employers, and, of course, any errors in this post are my own.
© Copyright 2016 Butler Snow LLP. All Rights Reserved.
Assured Guaranty topped the rankings of municipal bond insurers for the second quarter while Orrick Herrington & Sutcliffe LLP was the leading bond counsel.
Muni issuance is only a little behind last year’s pace but bond insurance penetration fell to 5.59% in the second quarter from 5.87% in the first quarter to land at 5.85% for the first half. Overall, the principal amount wrapped by Assured, Build America Mutual, and National Public Finance Guarantee – the three insurers writing new business – decreased to $12.79 billion for the first half of this year over 970 transactions, down from the $14.36 billion in 1,084 transactions during the first half of 2015, according to data from Thomson Reuters.
Assured retained its first place perch, despite having a lower principal amount insured and fewer deals with $6.84 billion in 464 deals from $8.75 billion in 594 deals, while also seeing its market share slip to 53.5% from 61% percent. The data includes Assured’s subsidiary Municipal Assurance Corp.
“During the second quarter of 2016, Assured Guaranty continued to lead the industry, insuring 267 small, medium and large new issues, which represented 53% of the insured par sold in the primary market. Our $3.8 billion of primary-market par was up 25% from the first quarter of 2016,” said Robert Tucker, senior managing director, investor relations and communications at Assured.
Tucker also mentioned that looking at Assured’s first-half 2016 primary market activity, they captured a similar 53% of the market by guaranteeing $6.9 billion of par.
“Our secondary-market activity for the half of 2016 was very strong,” Tucker said. “We issued 234 policies, totaling an industry-leading $752 million of par, 87% higher than in the first half of 2015. Our combined primary and secondary market par insured during the first half totaled $7.6 billion.”
BAM also saw increases, as its principal amount insured rose to $5.59 billion in 468 issues from $5.29 billion in 479 issues. Although the mutually-owned company didn’t do as many deals during the first six months of 2016 compared to the same period in 2015, they did see an increase in market share, improving to 43.6% from 36.9%.
“BAM had a great first half and a record second quarter, when our primary market par insured exceeded $3 billion for the first time,” said Bob Cochran, BAM’s chairman. “We got there by staying focused on our core mission of improving market access and transparency, particularly for small- and medium-sized issuers, and expanding investor demand for our guaranty.”
Cochran also said that they are definitely seeing a growing awareness of the unique benefits BAM brings to a transaction as a mutual insurer, which he said includes its excellent financial strength and durable, AA/stable rating, as well as the additional transparency it provides for every insured bond by publishing a free credit profile on its website.
“The increased investor demand for BAM-insured paper was particularly obvious in our secondary market activity, which totaled almost $260 million in 190 trades in the second quarter, more than doubling volume from both the first quarter of 2016 and the second quarter last year,” Cochran said.
National also had a better first half this year compared to last year, as its amount insured increased to $367 million over 39 transactions from $309 million in 11 transactions.
“In light of the ongoing difficult environment for our industry – with extremely low interest rates and the uncertainty regarding the outcome for Puerto Rico – we are pleased that investors continue to express demand for bond insurance,” said Tom Weyl, head of new business development at National.
The municipal arm of MBIA Inc., which started writing new business in the third quarter of 2014, saw its market share inch up to 2.9% from 2.1%.
“We are also pleased with National’s steady progress. We are gaining greater attention from important parties in the market that will further our progress, especially as market conditions become more favorable,” said Weyl.
In the bond counsel rankings, Orrick not only held its first-place position but extended its lead, as the firm finished the first half of 2016 with a par amount of $22.12 billion or 10.4% market share in 217 transactions, an improvement over the $20.69 billion or 9.7% market share in 205 transactions during the first six months of 2015.
“We are obviously happy with our firm’s results for the first half of 2016,” said Roger Davis, chair of Orrick’s public finance practice. “The national market volume was down by about 4% compared to the first half of 2015. Orrick’s volume was up by about 9%, and our market share jumped by almost two full percentage points to over 10%.”
Davis said that persistent low interest rates, accompanied until recently with the threat of rate increases by the Federal Reserve, led to a large number of refundings.
“And on top of that, we saw increasingly robust new money financing activity, particularly in multifamily housing, health care, public and charter schools, energy (including alternative and distributed energy), even governmental purpose (general fund and enterprise revenue) projects, all sectors in which Orrick is particularly strong,” said Davis.
Davis also noted that the office Orrick launched in Houston in January has been busy from inception is a substantial new contributor to the firm’s public finance group and its results.
“Looking ahead, we are as busy in all of our nine public finance offices around the country as I can remember being during the summer months,” said Davis.
Hawkins Delafield & Wood LLP stayed in second place with $11.09 billion or 5.2% market share over 173 deals, all slightly down from the $12.41 billion or 5.8% market share over 225 deals the firm finished with during the same period of time last year.
McCall Parkhurst & Horton LLP saw increased year over year, as the firm moved up to third from fourth place, finishing the half with $8.48 billion in 264 transactions versus $7.89 billion in 251 transactions.
Norton Rose Fulbright dropped from third to fourth to $6.87 billion from $9.69 billion, while Kutak Rock LLP moved up one spot into the top five with $6.14 billion from $6.10 billion.
Rounding out the top 10 are Squire Patton Boggs, Chapman and Cutler LLP, Stradling Yocca Carlson & Rauth, Sidley Austin LLP and Bracewell LLP.
The two biggest movers from the first half are Chapman and Cutler LLP, who jumped up to seventh from 15th a year ago and Bracewell LLP who leaped into the top 10 after finishing 16th during the first half of 2015.
Hawkins held the top underwriters counsel spot and pushed its lead further, finishing the first half of 2016 with $13.75 billion or 9.2% market share in just 65 deals, which compared to $10.58 billion or 7.1% market share in 83 deals in the first six months of 2015.
“For Hawkins in the first half of 2016, we had strong results across the board in terms of sectors and geography,” said Howard Zucker, managing partner at Hawkins. “This is due to having more lawyers devoted to the full-time practice of public finance than any other law firm in the nation, including 14 tax attorneys. Hawkins is 162 years old, and has been doing public finance for over 135 years but we know that we cannot rest on our laurels–we understand that we have to come to work each and every day to earn and deserve the trust and confidence of our clients.”
Zucker added that among the many deals in which Hawkins participated in that were noteworthy, the firm was counsel to the underwriters in the $2.4 billion dollar bond issue for the rebuilding of LaGuardia Airport that was a P3 transaction, and bond counsel for the refunding of bonds of the NYS Utility Debt Securitization Authority. In addition, Hawkins was also involved in several large transactions for the State of California, and many housing and hospital financings around the nation.
“After the bankruptcy of, among others, the City of Detroit, and the Federal enactment of legislation to address the financial situation in Puerto Rico, there is much more attention to the legal structure of transactions, including statutory liens and special revenues, and that requires expertise in bankruptcy and secured transactions,” said Zucker. “This is another example of the requirement that bond lawyers have the necessary expertise in multiple areas of the law.”
Hawkins opened its ninth office in Michigan last fall and as of Jan. 1, the firm added three partners to its ranks.
“We look forward with excitement to the future of public finance,” said Zucker.
Norton Rose Fulbright finished second with $8.02 billion, Stradling Yocca Carlson & Rauth was in third with $6.41 billion, Kutak Rock LLP came in fourth place with $5.78 and Nixon Peabody LLP was fifth with $5.75 billion.
Rounding out the top ten are Orrick, Squire Patton Boggs, Andrews Kurth LLP, Bracewell LLP and Greenberg Traurig LLP.
The biggest jump belonged to Bracewell LLP, who finished the first half of last year in 21st place and moved up to ninth this year.
“The trend for many years has been for greater specialization in the bond legal practice. This is a reflection of the increased complexity of municipal bond issues, the highly extensive regime of federal tax regulations, as well as the heightened disclosure expectations of the market and of the SEC,” said Zucker.
Zucker also noted that today law firms that want to be leaders in this field have to be truly dedicated, and have to commit significant resource to the depth and breath of expertise in order to be able to advise issuers and others in the navigation of the matrix of issues across the full range of sectors of public finance.
The Bond Buyer
By Aaron Weitzman
July 20, 2016
CLEVELAND, July 21, 2016 /PRNewswire/ — Republican elected officials from across the nation explained how infrastructure investments have fueled growth in their local economies, and said those successes support the case for more federal resources for infrastructure, as well as the preservation of tax-exempt municipal bonds in any tax-reform legislation. Their comments came during a policy briefing at the Republican National Convention sponsored by the National League of Cities (NLC), the nation’s largest and most representative organization for city officials, and Build America Mutual (BAM), the first mutual insurer of municipal bonds.
Hon. Ray LaHood, a Republican who represented Illinois’ 18th Congressional District for 14 years before being named Secretary of Transportation in 2009, opened the session by arguing that the federal government should raise the gas tax to generate more money for infrastructure investment – particularly focused on urban areas.
“The next generation of transportation is going to take place in the cities. It’s not about building more Interstates or bridges, it’s about how people are going to live in communities without needing automobiles,” Secretary LaHood said. “Until we get politicians in Washington and a new administration thinking along the lines of a big pot of money to jumpstart these opportunities, we’re selling ourselves short.”
Clarence Anthony, NLC’s CEO and executive director, said preserving the tax-exemption for municipal bonds, which cuts the cost of infrastructure investment for states, cities, counties and other municipal governments, is a key priority for local government leaders. The tax exemption must come alongside long-term, stable funding for infrastructure and transportation, comprehensive transportation planning, and support for local broadband access.
“We are going to both the Republican and Democratic conventions because cities need to be partners with the next president of the United States, whoever that will be. We need the candidates to understand that we must make infrastructure a priority for America,” Mr. Anthony said. “Cities are a crucial part of that conversation because when cities succeed, the nation succeeds.”
BAM Chairman Robert Cochran said the tax-exempt municipal bond market is uniquely positioned to provide U.S. states, cities, counties and other government agencies with affordable funding to meet the nation’s infrastructure needs.
“There is no doubt that there is municipal market demand and investors that will provide that additional $100-$150 billion of annual investment that it will take to get to that $1.5 trillion of infrastructure funding that we need in order to make up the gap over the next 10 years,” Mr. Cochran said.
Additional panel participants included Oklahoma City Mayor Mick Cornett, the president of the US Conference of Mayors; Fort Worth, Tex., Mayor Betsy Price, who co-chairs the NLC’s presidential elections task force; El Paso County, Colo., Commissioner Sallie Clark, president of the National Association of Counties; and Sheila Amoroso, who manages the municipal bond department at Franklin Resources, one of the largest investors in municipal bonds.
Build America Mutual
July 21, 2016
About the National League of Cities
The National League of Cities (NLC) is dedicated to helping city leaders build better communities. NLC is a resource and advocate for 19,000 cities, towns and villages, representing more than 218 million Americans. www.nlc.org.
About Build America Mutual
BAM is the first mutual insurer of municipal bonds and the leading insurer of new-issue municipal bond transactions. BAM’s members are the more than 2,000 municipal bond issuers – including cities, counties, school districts and utility systems nationwide – who have used BAM insurance to save more than $300 million on their infrastructure investments since 2012. To improve transparency in the municipal market, BAM publishes a Credit Profile for every transaction it guarantees, which can be downloaded for free at www.buildamerica.com/credit-profiles. BAM-insured bonds are rated AA with a stable outlook by S&P Global Ratings.
WASHINGTON – Two Senators have introduced a companion bill to a measure in the House that would permanently raise the annual issuer limit for issuers of bank-qualified bonds to $30 million from $10 million.
The Municipal Bond Market Support Act of 2016 (S. 5237) was introduced by Sen. Bob Menendez, DN.J. and referred to the Senate Finance Committee on Thursday. The bill is cosponsored by Sen. Ben Cardin, D-Md., who is a member of the Senate Finance Committee’s taxation and IRS oversight subcommittee.
It is an identical version of The Municipal Bond Market Support Act of 2015 (H.R. 2229), which was introduced in the House in May of last year by Rep. Tom Reed, RN.Y. That bill is pending before the House Ways and Means Committee.
Menendez and Cardin could not be reached for comment Wednesday.
The companion bills would raise the annual issuer limit to $30 million permanently for the first time since bank-qualified bonds were created in 1986. The legislation would also index the annual issuer limits to inflation and apply to 501(c)(3) nonprofit borrowers rather than to the issuers they borrow from in conduit deals.
The bill pending in the Senate, if enacted, would greatly benefit many of the smaller, more rural jurisdictions that generally issue bank-qualified bonds to fund infrastructure projects, Emily Brock, director of the Government Finance Officers Association’s federal liaison center here told The Bond Buyer on Wednesday.
“This would really benefit a significant number of GFOA members,” Brock said, adding that roughly 70% of the organization’s members are mid-to-smaller sized jurisdictions. “Smaller jurisdictions often have to pay a premium because of investor unfamiliarity with their area.”
Bank-qualified bonds were created under the Internal Revenue Code of 1986 in order to allow smaller issuers to sell their tax-exempt bonds directly to local banks. These bonds give local issuers a chance to bypass the traditional underwriting process and access more cost-effective credit.
Brock said that small issuers often pay higher underwriting costs and also have a tougher time selling their bonds because investors oftentimes are not familiar with their jurisdictions. Selling bank-qualified bonds directly to banks reduces issuance costs by roughly 25-to-40 basis points, according to GFOA’s bank-qualified municipals bonds resource center. As a result, GFOA said that many small issuers have been forced to pay higher interest rates.
Under the current threshold, a 25-to-40 basis points savings on a 15-year, $10 million bond would be between $232,000 and $370,000, according to GFOA. The basis points savings on a 15-year, $30 million bond would range from $696,000 to $1.1 million, the group estimates.
Banks can currently deduct 80% of the carrying cost of a qualified tax-exempt obligation under the federal tax code. The carrying cost includes the interest incurred from purchasing or carrying an inventory of securities.
However, Congress in 1986 limited bank purchases by saying banks could only buy the bonds of state and local governments that issue no more than $10 million of bonds during the calendar year.
Congress temporarily increased the issuer limit to $30 million in 2009 and 2010 under the American Recovery and Reinvestment Act, but that the increase was not renewed when it expired at the end of 2010.
Other versions of the Municipal Bond Support Act were introduced in the Senate in 2011 as well as in the House in July 2014.
Brock said the $30 million threshold was reached because the $10 million level set three decades ago was not tied to inflation. When indexed for inflation, the figure would be roughly $30 million, she said.
Brock said GFOA will continue to push through grassroots efforts to gain support for the bill, as well as urge more Senators to cosponsor the bill. A letter supporting the Municipal Bond Market Support Act of 2016 was sent to Menendez on June 24 was signed by 14 organizations, including GFOA, Bond Dealers of America and the National Association of Bond Lawyers.
She said she is confident that the bill can garner more support ahead of the next Congress because of the identical bills introduced in both the House and Senate.
“This is a stronger step than we’ve made in the past,” she said. “It allows both houses to see that this is a priority, and it sets the stage for really good conversation. It’s definitely a positive step in the right direction.”
The Bond Buyer
By Evan Fallor
July 20, 2016
Virtually everyone agrees that the United States needs modern, well-maintained infrastructure to ensure its future prosperity. Platforms produced for both major political parties at their conventions this month mention the issue, with Democrats pledging to “make the most ambitious investment in American infrastructure since President Eisenhower created the interstate highway system” and Republicans noting that “everyone agrees on the need for clean water and safe roads, rail, bridges, ports and airports.”
Yet financing that infrastructure has become highly contentious. Lawmakers at all levels of government – have different ideas of how much to spend on infrastructure and where that money should come from, and a hesitancy to increase taxes or concerns over spending huge amounts of money on “luxury” upgrades has created political gridlock in many places.
But if the spending were less controversial and the political will were there, the U.S. could substantially transform its infrastructure. The new construction and upgrades could change how Americans travel, strengthen the country’s economic engine, and make our communities safer and happier places to live. Texans might ride a futuristic bullet train to Atlanta, every child might attend a modern well-equipped school, and no city would have to worry about the safety and reliability of its drinking water.
As The Bond Buyer reaches 125 years of covering how America finances its infrastructure needs, we take a look at ten key areas of need and what could happen if money and politics weren’t in the way. We examine what the project is, how it could benefit America, and, importantly, how it could be financed.
INTERSTATE 2.0
What it is:
A total modernization of the interstate highway system with upgrades such as dedicated truck lanes, redesigned interchanges to reduce bottlenecking, and express bus service
How it benefits the country or region:
The new interstate would improve commerce and the quality of life by reducing travel times and creating easier access to major population centers. The existing system was built more than half a century ago during the presidency of Dwight Eisenhower, and in many sections is inadequate for modern traffic needs or becoming aged and unreliable.
How much it costs:
Roughly $1 trillion
How it gets paid for:
All options on the table, but the most realistic is likely a combination of federal spending driven by user fees such as gas taxes and some local investment. Gas taxes have historically been the major means, but P3s are possible if allowed by the federal government.
AIRPORT INFRASTRUCTURE
What it is:
A radically consolidated ATC system with current control towers replaced by ground-level or underground facilities using an array of airport sensors at large airports, along with expansions and modernizations.
How it benefits the country or region:
Creates a more efficient and safer air travel. Air travel facilitates the movement not only of passengers but also of goods, and is a crucial economic driver for many localities with large or hub airports.
How much it costs:
Billions, but exact cost depends on the extent of the upgrades. The Federal Aviation Administration is attempting to implement its “NextGen” technological upgrades program, but has said it is dependent on full federal funding for the next 3 years, a political uncertainty.
How it gets paid for:
Federal spending or existing avenues of airport finance, including bonds backed by airport fees. Passenger Facility Charges, fees levied at commercial airports controlled by public agencies, are capped at $4.50 per passenger and could be raised to produce more revenue.
BRIDGE REPLACEMENT
What it is:
A replacement of structurally deficient and obsolete bridges nationwide. The American Road and Transportation Builders Association estimates that there are 58,495 U.S. bridges in need of repair.
How it benefits the country or region:
Rebuilt bridges are safer and improve traffic flow because they can handle increased weight loads, whereas some older bridges now have had to limit traffic for safety concerns. Bridge replacement could also facilitate expansion of certain highway sections crucial to some local economies.
How much it costs:
Likely over $150 billion nationwide.
How it gets paid for:
A good P3 candidate because they can be tolled and backed with revenue bonds.
WATER INFRASTRUCTURE
What it is:
A replacement and expansion of America’s existing drinking water infrastructure, much of which is past or approaching its useful life
How it benefits the country or region:
Outdated water infrastructure can be unreliable or even unsafe, as in Flint, Michigan. Water main breaks can interrupt service and cause costly damage.
How much it costs:
The American Water Works Association has estimated it will cost about $1 trillion through 2035, assuming replacement of the entirety of America’s drinking water system over that time. Drinking water components typically have a 15-95 year useful lifespan.
How it gets paid for:
Local planning and financing is the way to go, as each localities needs are unique. Some communities would pay as they go, others would bond.
NATIONWIDE HIGH SPEED RAIL
What it is:
A nationwide network of trains capable of exceeding 200mph. Such trains are already common in Europe and Asia, but are essentially nonexistent in the U.S. Amtrak operates a “high speed” Acela service in the Northeast, but its average speeds along its route are considerably slower than other high speed rail services globally.
How it benefits the country or region:
These trains could provide a green, fast way to travel between major metropolitan areas. They could serve as an alternative to air travel for short to intermediate distance trips, such as between Seattle and San Francisco or Houston and New Orleans. The U.S. Conference of Mayors has touted the economic benefits high speed rail would have to cities served by it.
How much it costs:
$500 billion plus
How it gets paid for:
A combination of federal dollars and local borrowing via bonds. The federal government has shown an interest in helping local governments leverage federal money to build high speed rail infrastructure.
PORT MODERNIZATION
What it is:
A series of improvements to the largest U.S. ports to ensure their continued economic competitiveness. Includes deepening them, adding more land-side cargo infrastructure, inclusion of robotic technologies.
How it benefits the country or region:
Modernized U.S. ports will facilitate more efficient interstate and international commerce, and help prevent port-driven localities from being driven out of business by ports in Mexico or Canada.
How much it costs:
More than $1 trillion
How it gets paid for:
Port authorities would borrow via bonds backed by their revenues. Port Authorities are already often some of the largest most frequent issuers in the U.S., and many have high credit ratings allowing them to borrow at a low cost.
SCHOOL UPGRADES
What it is:
Getting U.S. K-12 education into good operating condition. Almost half of U.S. public school buildings were built for the baby boom generation born between 1950 and 1969, the American Society of Civil Engineers reports.
How it benefits the country or region:
U.S. schools serve as not only education centers, but also as community gathering places, shelters during disasters, and other important functions.
How much it costs:
$270 billion plus.
How it gets paid for:
State and local spending, including bonds that could be either general obligations or increasingly-popular property-tax bonds. The ASCE also recommends exploring alternative financing options and innovative ways to reduce costs. Warren County Kentucky’s Richardsville Elementary School, for example, generated enough electricity via solar panels to sell energy back to the grid.
HAZARDOUS WASTE SITE CLEANUP AND REDEVELOPMENT
What it is:
Cleanup and redevelopment of more than 1,000 unsafe brownfield sites. The U.S. produces millions of tons of hazardous waste annually.
How it benefits the country or region:
These sites pose a potential health and safety risk and also can’t be turned into useful public sites until they are cleaned up and made safe.
How much it costs:
Roughly an extra $500 million annually over what the Federal government currently spends. Possibly more than $200 billion over the next 30 years.
How it gets paid for:
Federal spending through the Environmental Protection Agency’s Superfund is the traditional way, but the EPA can also force whoever is responsible to clean up the site in many cases. Localities could partner with the federal government or be incentivized to redevelop these sites locally.
LEVEE REPAIR
What it is:
Repair and replacement of American levees, which protect both farmland and developed areas from flooding. The U.S. has some 100,000 miles of levees in all 50 states and the District of Columbia
How it benefits the country or region:
Insufficient or outdated unreliable levees can fail, causing devastating losses to the communities affected.
How much it costs:
More than $100 billion.
How it gets paid for:
P3s are a possibility, if surrounding infrastructure or the waterway can be monetized. US Army Corps of Engineers needs additional federal funding, localities must increase investment on levees not the responsibility of the federal government.
NEW AGE ENERGY INFRASTRUCTURE
What it is:
Modernizing and expanding an increasingly outdated and unreliable distribution and transmission network for U.S. power supplies.
How it benefits the country or region:
Outages are a huge blow to the communities affected, slowing business to a crawl and creating a dangerous situation.
How much it costs:
Experts believe there is an investment gap of roughly $100 billion over the next several years.
How it gets paid for:
Largely local and P3, but federal government can play a role, particularly in incentivizing or helping in the development of green energy infrastructure.
The Bond Buyer
By Kyle Glazier
July 19, 2016
Last week, a group of Senate lawmakers introduced legislation (S 3257) that would permanently raise the issuer limit on bank-qualified bonds from $10 million to $30 million. The legislation, which breathes new life into the effort to restore the annual issuer limit to $30 million, is the culmination of work by GFOA’s Federal Liaison Center with the offices of Senator Cardin (D-MD) and Senator Menendez (D-NJ).
This legislation is identical to the legislation introduced in the House late last year (HR 2229), which is a significant step in the right direction—it not only sends a message to both the House and Senate about the importance of raising the bank-qualified loan limit, but it also sets the agenda for what may prove to be an exciting 115th Congress beginning in January 2017.
The Federal Liaison Center encourages GFOA members to reach out to your senators and encourage co-sponsorship on this important legislation. Our Bank-Qualified Loan Resource Center provides sample letters and other helpful information about the legislation and the history of bank-qualified bonds.
Bank-qualified bonds were created in 1986 to give smaller issuers more cost-effective access to credit by allowing them to bypass the traditional underwriting system and sell their tax-exempt bonds directly to local banks. In addition to the higher costs of issuance in the normal underwriting process, many small issuers have a difficult time selling their bonds because investors may not be familiar with their jurisdictions. Many small issuers have therefore been forced to pay higher interest rates on their bond issuances.
Recognizing the utility of bank-qualified bonds to overcome these cost barriers, Congress temporarily expanded their use by raising the issuer limit to $30 million annually in 2009, and as a result, the market for bank-qualified bonds increased to approximately $32 billion that year. However, despite the effectiveness of bank-qualified bonds and bipartisan support on Capitol Hill, Congress did not extend these provisions beyond their December 31, 2010, sunset date, and on January 1, 2011, the annual issuer limit for bank-qualified bonds reverted to $10 million.
GFOA
Tuesday, July 19, 2016
GASB Chair David A. Vaudt recently announced the appointment of a consultative group to assist with the Board’s research examining equity interest ownership of legally separate entities.
The members of the consultative group are:
WHAT DO CONSULTATIVE GROUPS DO?
The GASB assembles consultative groups at the discretion of the GASB chair for pre-agenda research that is expected to be extensive and to address a broad portion of the accounting and financial reporting standards. Consultative groups serve as a sounding board, providing suggestions and feedback to the GASB staff as research activities progress. As part of this process, consultative group members review drafts of research materials prepared by GASB staff, commenting as appropriate.
HOW ARE PARTICIPANTS SELECTED?
Consultative groups are officially appointed by the GASB chair after consultation with the other GASB members and GASB staff. Consultative group members typically have a particular expertise or experience with the issue being researched and also are capable of articulating the views of other, similar constituents.
Members primarily are identified from the GASB’s database of stakeholders, including persons who have indicated a willingness to volunteer for a consultative group. The GASB attempts to maintain an appropriate balance of financial statement preparers, auditors, and users on each consultative group.
Within each group, the GASB seeks to include a variety of types of stakeholders, such as finance officers from general purpose governments and business-type activities; auditors in government and private practice; and users from the municipal bond industry, citizen and taxpayer groups, legislative bodies, and the academic community. The GASB also tries to balance other factors that may be relevant, such as governments of various sizes and geographic areas of the country.
The Governmental Accounting Standards Board (GASB) is conducting a survey on the effectiveness of financial stress indicators of state and local governments. The survey is intended to gather feedback on the following questions: 1) What criteria might achieve the objective of disclosing severe financial stress uncertainties with respect to governments; 2) What information do financial statement users need with respect to the disclosure of severe financial stress uncertainties; and 3) Are the going concern indicators currently presented in note disclosures appropriate for state and local governments under severe financial stress.
The survey can be accessed here and should be completed no later than Friday, August 5, 2016. If you have any questions, you can contact Amy Shreck of the GASB project team at [email protected]. You do not need to complete the entire survey in one session. If you save your responses, you will receive an individualized link that you can use to complete your survey later.
DALLAS - A $2 billion flood diversion project aimed at preventing future natural disasters in North Dakota and Minnesota will be the first publicp-rivate partnership for the U.S. Army Corps of Engineers.
The Red River project would protect more than 225,000 residents and $14 billion of property by moving floodwaters away from Fargo, N.D., and other areas that suffered from a massive flood in 2009 that nearly inundated the region.
The project includes a channel that is 36 miles long and a quarter-mile wide, two aqueducts, four railroad bridges, four interstate highway bridges, and 10 county road bridges.
The partnership agreement for the diversion project was signed July 11 by Lowry Crook, deputy assistant secretary of the Army for civil works, as well as the mayors of Fargo, N.D., and Moorhead, Minn., and the directors of the Fargo-Moorhead Flood Diversion Authority.
The Red River has flooded the area 49 times in the past 110 years, including every year from 1993 to 2011 and again in 2011. Another major flood could cause more than $10 billion of damages, said diversion authority chairman Darrell Vanyo.
The agreement formalizes the federal government’s $450 million contribution to the $2 billion project and paves the way for a formal request from the Diversion Authority next month for qualification from interested private partners.
The Red River project will be the Army Engineers’ first P3 test, said Corps commander Lt. Gen. Thomas P. Bostick.
The Water Resources Reform and Development Act of 2014 (PL 113121) required the Army Engineers to create a pilot P3 program with up to 15 projects.
“We can’t wait. The nation can’t wait,” Bostick said. “Finding a way to think creatively about funding these projects is very important.”
Private investors are necessary because Congress provides only $1.5 billion a year to fund $23 billion of Corps’ projects, he said.
“For the Corps, we’ve hired people who wake up every day and their number one mission is to think about public-private partnerships and [how] to move them forward,” Bostick said.
North Dakota and its local governments will provide $1.2 billion to build the project, with $175 million of state funds already committed. Minnesota, which will receive fewer benefits from the project than its neighbor, will contribute up to $100 million.
The local governments will fund most of their share of the project costs with proceeds from revenue bonds supported by a dedicated 0.5% sales tax already approved by voters in Fargo and Cass County, N.D., said county administrator Keith Berndt.
The private partner is expected to provide up to 20% of total project costs.
The Flood Diversion Authority intends to use local sales tax revenues and state funds to make annual availability payments to the selected concessionaire.
The private partner that would be selected in 2017 would be responsible for financing its share of the project, building the required infrastructure, and operating the diversion facility for up to 35 years.
The Army Engineers will build a 12-mile dam on the Red River to direct floodwaters into the diversion channel though a conventional design/build approach, said Corps project manager Terry Williams.
It would take 20 years or more for the Corps to complete the entire project without the private partners because its federal funding comes in annual installments that are not consistent, Williams said.
“They may be able to find more innovative ways to design and build it knowing that they are going to have this operation and maintenance,” she said. “They may be willing to take a little more risk than the Corps would if we were designing and building it.”
The Bond Buyer
By Jim Watts
July 13, 2016
Cities nationwide have crafted and acted on ambitious blueprints for light-rail and other forms of mass transit, but unlike the Twin Cities, many of them have asked their voters whether they want higher taxes to help pay for it.
Ballot initiatives “give local officials the ability to turn a tricky political decision over to the voters,” said Jason Jordan, executive director of the Center for Transportation Excellence, a Washington, D.C., group that tracks transit spending. Since 2000, transportation initiatives have been on the ballot in 41 states, with an average of 71 percent passing.
A referendum of this sort has not been considered in Minnesota because the Legislature would have to authorize it. And, since efforts to pass a half-cent metro sales tax for transportation were thwarted by light-rail-averse Republicans last spring, that seems unlikely.
The final piece of local funding for the $1.79 billion Southwest light-rail line, totaling $135 million, is now in doubt. The fate of close to $900 million in federal matching funds for the controversial project is murky as well.
Partisan politics over mass transit haven’t necessarily played out nationally the way they have in Minnesota, according to Jordan. “We have found no partisan connection with these [transit] measures at all,” he said. “Voters really have a chance to evaluate whether they believe there’s value in a project or not.”
This fall, Seattle-area residents will vote on an initiative called Sound Transit 3 that calls for new sales and property taxes to fund $53.8 billion in transportation projects, including 62 additional miles of light rail.
Voters in the car-clogged Los Angeles area will decide in November whether to increase a county sales tax by half a cent for the next 40 years, raising about $120 billion to expand mass transit and various transportation initiatives.
Other cities, including Dallas, Phoenix and Denver, have used voter-approved tax revenue to build transit systems that are far more expansive than the Twin Cities’, which at the moment has two light-rail lines spanning 23 miles.
Dallas, Texas’ third-largest city, boasts a $5 billion light-rail network that is the longest of its kind in the country with some 90 miles of track. Last summer, Phoenix voters approved a $31.5 billion transportation plan for the next 35 years that includes a transit sales tax increase to 0.7 percent. The funds will help build 42 miles of light rail.
In Denver, a city often seen as a peer to the Twin Cities, voters in 2004 approved the $4.7 billion FasTracks program, which added 122 miles of new commuter and light-rail lines in the region, as well as bus-rapid transit (where buses operate like trains) and related infrastructure.
However, Denver discovered the hard way how sales taxes ebb and flow with the economy. Once the Great Recession hit, costs of the transit program ballooned to nearly $7 billion, leaving a budget gap of $2.2 billion. A unique public-private partnership involving local businesses stepped in to help fund several rail lines, including one connecting Union Station in downtown Denver to the Denver International Airport.
Now back on track, transit options in Denver have been crucial in attracting millennials to the city, as well as $5.5 billion in transit-oriented development, said Nate Currey, spokesman for the Regional Transportation District. “You do not have to have a car to live here,” he said, adding that aging baby boomers are shedding their wheels, too.
Transit “is a big economic competitiveness issue for us to compete as a region,” said Adam Duininck, chairman of the Metropolitan Council, the regional body in the Twin Cities that plans and operates transit. “When you look at how we compare to other regions, we do well in all areas except for transit.”
There is a little-known transit sales tax in the metro area that has played a key role in funding big projects, such as the nearly $1 billion Green Line, linking the downtowns of Minneapolis and St. Paul.
Since 2008, five Twin Cities metro counties — Hennepin, Ramsey, Washington, Anoka and Dakota — have used the quarter-cent sales tax and a $20 motor vehicle sales tax to invest in transit projects administered by a group of mostly elected officials called the Counties Transit Improvement Board (CTIB). And 10 years ago, a general referendum question passed by voters dedicated 40 percent of motor vehicle sales tax proceeds to transit over a five-year period.
But Dakota County, unhappy with its return from the transit tax, voted last month to leave the group, and other suburban counties may follow.
If cities are unable to raise local money for big transit projects like light rail, they are in danger of losing matching dollars from the Federal Transit Administration. The FTA’s New Starts program, which pays out about $2.3 billion a year for new light rail, commuter rail and bus-rapid transit projects costing more than $250 million, looks first for a local funding commitment before awarding its grant money.
The competition for FTA money is fierce, transit experts say.
“You snooze, you lose,” said Hennepin County Commissioner Peter McLaughlin, who chairs CTIB. “If we whiff on [Southwest], we’re letting competitor regions with a vision march ahead of us.”
Critics disagree. Light-rail is “really expensive infrastructure to build and keep up that doesn’t work,” said Kim Crockett, vice president of the Center of the American Experiment, a think tank based in Golden Valley. The race for federal transit dollars — also footed by taxpayers — is a wasteful folly, she said.
Even cities like Seattle that are perceived as being transit-friendly have critics. John Niles, who co-founded a Seattle group called Smarter Transit, says the impending ballot initiative in the Emerald City would cost the average person $1,000 more a year. (The transit agency there, Sound Transit, claims the figure is $200 a year.)
Niles says Seattle should refine its current system — much of which was built after a 2008 referendum added 2 percent in various sales taxes — before expanding it even more. “Let’s use the existing network to its full potential,” he said. “This may be a bridge too far.”
Meanwhile, other cities and regions continue to look to voters for a thumb’s up on transportation. This fall, more than 20 regions across the United States — from Pulaski County, Ark., to Kalamazoo, Mich., — will hold referendums to raise money for transportation initiatives, according to the Center for Transportation Excellence.
The Minnesota Star Tribune
By Janet Moore
JULY 13, 2016 — 10:33AM
The website Quartz reported recently that yields on U.S. 10-year Treasury bonds are lower than they have been since the days of Alexander Hamilton.
But when it comes to bond yields, zero is not the limit. Brexit and uneasiness about the global economy have pushed interest rates on a third of developed-country government debt into negative numbers as investors seek safe havens. That means countries like Germany, Switzerland and Japan are charging investors money for the privilege of holding onto their cash.
Government bonds are many Americans’ introduction to investing, and for many of us they represent safety and solidity in a volatile world. In fact, lots of investors have been moving into bonds as the stock market has been in turmoil lately, which is part of the reason yields are falling.
But with returns so low, would we be better off putting money in the mattress?
Not surprisingly, investment managers say no. Bonds are still an important part of your diversification strategy for retirement. This is because they counterbalance movements in the stock market, and their yields are much more stable than those of stocks.
Here are some topics to discuss with your investment manager.
–What types of bonds are best for you?
Again, within the overall category of bonds, most people are most familiar with U.S. Treasuries. They have an interest rate or coupon that is set on the day you buy it and paid out every six months for a term that ranges from 1 to 10 years for Treasury notes, and up to 30 years for Treasury bonds. You get the full principal back when the bond reaches maturity, giving some insulation from market ups and downs. However, there is market risk if you need to sell before the term is up.
The same basic structure is in place for other types of bonds: those issued by foreign countries, by corporations, or by U.S. state and local governments or their agencies (known as municipal bonds). Note that muni bonds can have special federal tax exemption (and possibly state or local tax advantages if you buy them for the city and state where you live).
In all these cases, by buying a bond you are essentially lending money to the entity in question. In general you’ll find higher yields where there is also higher risk of default, as when lending to developing countries or distressed U.S. cities, or when buying “junk bonds” issued by higher risk firms, particularly in the energy sector.
–Is it better to own bonds or bond funds?
Bond funds are basically collections of bonds with staggered maturities. Just as with mutual funds full of stocks, you pay a management fee and expense ratio. In fact, the increasingly popular target-date retirement funds tend to include both stocks and bonds.
And, because it’s a bouillabaisse of different holdings, there is no guaranteed date that you’ll get back your principal.
That said, many investment managers feel that it’s difficult to properly diversify through buying individual bonds unless you have a lot of money to park specifically in fixed-income investments. (What “a lot” means can vary — some say half a million dollars, while others argue that a hundred thousand is plenty.)
And the pressure to diversify is increasing with yields on the standard Treasury bonds so low.
So to recap, for most beginning investors, proper exposure to bonds will come in the form of target-date funds which will give you a selection of U.S. Treasuries, corporate and foreign issues, alongside stocks.
For those with more assets or who are heading closer to retirement — meaning you are shifting more towards fixed-income investments — bond-only funds would be the next place to look.
If you are willing to be an active money manager or work with an investment adviser you trust, you should look beyond Treasuries to buy individual bonds across sectors.
The Chicago Tribune
by Anya Kamenetz
July 12, 2016
(Anya Kamenetz’ most recent book is “The Test: Why Our Schools Are Obsessed with Standardized Testing, but You Don’t Have to Be.” She welcomes your questions at [email protected].)
(c) 2016 ANYA KAMENETZ DISTRIBUTED BY TRIBUNE CONTENT AGENCY, LLC
Copyright © 2016, Chicago Tribune
These distressed bonds from troubled places like Puerto Rico or Atlantic City can return as much as 8% after the tax exemptions.
Buying distressed bonds is hardly the stuff of muni investors’ dreams. But with the yield on high-quality intermediate munis down near 1.4%, the opportunity to earn extra income by buying insured bonds from places with weak credit profiles is worth a look.
Consider this: Long-term insured Puerto Rico bonds, the main opportunity for this strategy, yield about 4.5% currently. Given that the interest is exempt from federal, state, and local income taxes, that payment equals a taxable yield of nearly 8% for investors in a top tax bracket.
Insured muni prices have held steady near or above par for years, even as Puerto Rico’s finances deteriorated. In contrast, uninsured benchmark Puerto Rico bonds now trade for 67 cents per dollar of par value, reflecting how much of the face amount investors expect to recoup.
Insured bondholders got paid this month even as the commonwealth defaulted on July 1 on almost a billion dollars in interest and principal payments. At a time when munis are expensive relative to Treasuries and yields are at historic lows, “the insured Puerto Rico story still offers value,” wrote Cumberland Advisors, which manages $105 million in insured Puerto Rico bonds.
There was a time in the muni market when buying insured bonds was commonplace. The financial crisis changed that. Bond insurers failed or had to restructure, and even the best firms lost their triple-A ratings. Now the leading muni insurers—MBIA’s National Public Finance Guarantee and Assured Guaranty—have credit ratings in the mid-to-upper tiers of investment grade. Investors essentially evaluate the underlying bond based on the insurer’s rating. That’s why insurance doesn’t add value for the great majority of muni bonds, which are rated higher than the insurers.
“You need a broken credit for the market to really assign value to the insurance,” says Hugh McGuirk, who oversees municipal-bond investing at T. Rowe Price. That’s also why there aren’t a ton of insured bonds to choose from. Less than 10% of the muni market is insured now, but that number is increasing, according to National.
IT’S NOT JUST PUERTO RICO insured bonds that investors are buying. Chicago Board of Education insured munis trade at a premium to uninsured, and yields are attractive. National points to bonds issued by Atlantic City, N.J.; Chicago; and North Las Vegas as recent examples of insured bond prices holding steady or rising while uninsured bonds fell. Cumberland says long-term insured munis outside Puerto Rico yield about 2.5%.
Buying insured bonds of weak credits requires extra legwork, says financial advisor Richard Daskin of RSD Advisors. Investors need to assess the underlying bond and the ability of the insurance company to pay if the issuer defaults. He is comfortable with both National and Assured and thinks they merit higher ratings from credit agencies.
Other drawbacks: Daskin experienced a few delays in receiving payments on insured bonds when Puerto Rico defaulted earlier this month, mainly due to paperwork snafus when the default occurred just before a holiday weekend. “It was eye-opening as to how insurance really works,” he says. He notes the bonds are not very liquid, so investors should plan to hold them long term.
Mark Taylor, manager of Alpine High Yield Managed Duration Municipal fund (ticker: AAHMX), buys insured munis maturing in under five years. He believes National and Assured can meet their obligations in that period. He owns Puerto Rico bonds maturing in 2020 that yield about 4%.
But this strategy is not for everybody. Greg Steier, head of tax-exempt portfolios at Brown Brothers Harriman, won’t buy munis when he’s not confident of credit quality, even if there is insurance. “At the end of day, the underlying credit has to satisfy our criteria,” he says.
For T. Rowe’s McGuirk, insured bonds are “on the table.” He adds, “There aren’t many other opportunities where you can find yield.”
BARRON’S
By AMEY STONE
July 16, 2016
These guidelines offer guidance for managing investment pools in a manner that provides state and local government participants with investment options that, when prudently managed, provide safety of principal and liquidity.
New Hampshire has joined a growing number of jurisdictions in the United States that have enacted legislation enabling public-private partnerships (P3) for transportation infrastructure projects. According to Governor Maggie Hassan, the P3 Law is expected to play an important role in advancing New Hampshire’s transportation goals, including, among other projects, bringing commuter rail from Boston to Nashua and Manchester, New Hampshire. The P3 Law, Senate Bill 549, was approved on June 16, 2016 and will take effect on August 15, 2016.
The P3 Law authorizes the Commissioner of the State’s Department of Transportation (DOT) to enter into certain types of contracts with private entities for transportation infrastructure projects, and establishes a public-private partnership transportation infrastructure oversight commission to recommend and advise on requests for P3 proposals.
DOT’s Authority to Enter into P3 Contracts with Private Entities
P3s allow for certain risks and rewards to be shifted and shared between the private and public sectors. Specifically, according to the P3 Law, “public-private partnerships allow for the sharing of resources to finance, design, build, operate, and maintain transportation infrastructure projects and are especially effective when limited financial resources are available.” The responsibilities of the private and public entities involved and associated risks and rewards will generally depend on how the P3 project is structured among various alternatives. Pursuant to the P3 Law, the Commissioner, with the approval of the Governor, Council, and Capital Budget Overview Committee, may now enter into agreements with private entities for design-build-finance-operate-maintain (DBFOM) or design-build-operate-maintain (DBOM) services for transportation infrastructure projects.
Each P3 project must be approved as part of the State’s 10-year transportation improvement program in accordance with Section 240 of the New Hampshire Revised Statutes Annotated.
P3 Transportation Infrastructure Oversight Commission
The P3 Law establishes a public-private partnership transportation infrastructure oversight commission (the Commission) to consider and recommend suitable P3 projects to the Commissioner. The Commission will act as an advisory board during the execution of a P3 project, and support the DOT in the development of a request for proposals and in the preparation of agreements for P3 projects.
Members
The Commission will consist of the following members, each for an initial term of two years: two members residing in different geographic regions of the state to be appointed by the Governor; two members to be appointed by the President of the Senate; two members to be appointed by the Speaker of the House of Representatives; and one member to be appointed by the State Treasurer who will not be an employee of the State Treasurer’s office. The Commissioner will serve as a non-voting member of the Commission. Note that there are additional qualifications and conditions to appointment and reappointment specified under the P3 Law.
Duties
The P3 Law sets forth the various duties of the Commission, which include the following:
Procedures
The P3 Law sets forth certain procedures that must be followed in approving any P3 proposal. The DOT must first notify the Commission of its intent to use a P3 contract for DBFOM or DBOM services by submitting a written request to the Commission for its consideration. The Commission must provide an initial written response within 15 days. No request for proposal may be issued by the DOT without the Commission’s written recommendation and concurrence by the Governor and Council of both the procurement method and content of such request for proposal.
Reports
Under the P3 Law, the Commission will be responsible for issuing certain reports, including the following:
Contributions from Other States
A P3 project in New Hampshire may involve one or more neighboring states. For such a project under the P3 Law, the Commissioner may receive and accept capital contributions and funding from other states and may approve the transfer of support personnel and experts.
New Hampshire’s P3 Law is limited to transportation infrastructure projects and does not allow for social infrastructure projects, such as schools, hospitals, and housing, which have become more popular throughout the country. The P3 Law also limits the delivery methods in which P3 projects can be procured.
Attorneys in Ballard Spahr’s P3/Infrastructure and Public Finance Groups will continue to monitor and report on new developments in public-private partnerships in New Hampshire and other states. The Groups are recognized leaders in representing government and private sector developers, investors, and lenders in innovative public-private projects.
July 15, 2016
Copyright © 2016 by Ballard Spahr LLP.
www.ballardspahr.com
(No claim to original U.S. government material.)
All rights reserved. No part of this publication may be reproduced, stored in a retrieval system, or transmitted in any form or by any means, including electronic, mechanical, photocopying, recording, or otherwise, without prior written permission of the author and publisher.
This alert is a periodic publication of Ballard Spahr LLP and is intended to notify recipients of new developments in the law. It should not be construed as legal advice or legal opinion on any specific facts or circumstances. The contents are intended for general informational purposes only, and you are urged to consult your own attorney concerning your situation and specific legal questions you have.
Executive Summary
Kroll Bond Rating Agency (KBRA) has affirmed the insurance financial strength rating of AA+ with a Stable Outlook for Municipal Assurance Corp. (“MAC”). The rating affirmation incorporates the reduction in claims paying resources from MAC’s repayment of $400 million of surplus notes effective June 30, 2016 to its affiliates.
Key aspects of KBRA’s rating assessment are MAC’s strong claims-paying resources and the company’s diverse insured portfolio which consists of lower risk, predominantly investment grade U.S. municipal exposures. MAC has no exposure to Puerto Rico, which, in light of the Commonwealth’s severely stressed financial position, KBRA views as a credit positive. As a major part of our analysis, KBRA used a Monte Carlo simulation analysis to determine a level of stress losses to be applied to MAC’s insured portfolio. KBRA tested MAC’s ability to pay this stress level of claims, and other expenses, in a run-off scenario. Under KBRA’s Bond Insurer Financial model, MAC satisfied all projected claims due with an adequate balance remaining.
Since the company’s capitalization in 2013, new business origination has fallen short of management projections and has not kept pace with the fairly rapid amortization of MAC’s legacy exposures. The decline in the insured portfolio combined with MAC’s large and stable balance sheet has pushed leverage ratios lower than historical levels.
KBRA also conducted a detailed review of MAC’s governance, credit, and risk management protocols and found them to be strong and reflecting best practices. MAC has a proven management team and a well-developed governance framework.
Late in the second quarter of 2016, MAC received permission from its New York regulator to repay the full amount of both series of outstanding surplus notes, ultimately resulting in an asset transfer of $400 million to MAC affiliates, Assured Guaranty Municipal Corp. (“AGM”, AA+/Stable) and Assured Guaranty Corp. (“AGC”). Since its capitalization in 2013, MAC has not paid any dividends. KBRA views the surplus note repayment as equivalent to an extraordinary dividend and we factored this transaction into our rating assessment. While MAC’s financial model results from KBRA’s stress test remain above the AA+ rating level, the amount of projected excess assets is lower than was calculated for KBRA’s last review on August 3, 2015, reflecting the now lower level of claims paying resources following the repayment of the surplus notes.
This rating is based on KBRA’s Financial Guaranty Rating Methodology dated December 15, 2015.
Fear mongers on both sides of the Atlantic would have us believe that governments are failing. They cite racially-charged violence from Dallas to Charleston, South Carolina; voters in Britain choosing to exit the European Union; the flood of migrants from the war in Syria; terrorist-inspired massacres from Brussels to San Bernardino, and the anemic global economy that is dividing generations of workers, families and communities.
Among investors, though, the full faith and credit of governments is at an all-time high, according to data compiled by Bloomberg. If low interest rates on sovereign debts are the ultimate measure of confidence in the governments that issue them, the market remains unshaken. The yield on short- and long-term securities has never been lower, according to Andy Haldane, chief economist and executive director of monetary analysis and statistics at the Bank of England.
As these interest rates are benchmarks for state and local governments, their cost of borrowing has plummeted to record lows as well. U.S. municipalities are financing at 1.54 percent this month, less than the 1.67 percent of 1945 or 4.71 percent of 1933, according to Bloomberg data and the U.S. Government Publishing Office.
The once-widening budget deficit as a percentage of gross domestic product is shrinking in the U.S., to 2.5 percent from 10.1 percent in 2009, and is now a 0.7 percent surplus in Germany.
30-YEAR RETURNS
For bondholders, the total returns (income plus price appreciation) have been a bonanza — surpassing gold, the fear monger’s favorite store of value. During the past 30 years, global sovereign debt returned 576 percent, or more than twice the 271 percent return for gold, while U.S. Treasury securities returned 529 percent, according to Bloomberg data. The yield on the 10-year Treasury note, which climbed to a high of 15.8 percent in 1981, is 1.3 percent this month, the lowest since Bloomberg began compiling such data in 1962.
Secular Stagnation
The record-low rates are a symptom of what many economists, led by former Treasury Secretary and former Harvard President Larry Summers, call secular stagnation: Slowing population growth and insufficient technological innovation and capital investment. These economists also see the low rates on U.S. and other sovereign debt as the most propitious opportunity to get economies moving faster because governments can borrow so cheaply to pay for infrastructure improvements, thereby creating demand from higher-paying construction jobs while investing in everyone’s future.
The market agrees. So far in the 21st century, the bonds sold to finance roads, bridges, hospitals, sewers and schools have outperformed all state and local government debt as well as the stock market and even gold, according to Bloomberg data. That’s because of the combination of after-tax returns and record-low financing costs. The borrowing cost to toll and turnpike authorities, a proxy for U.S. infrastructure financing, is an unprecedented 1.7 percent.
PERFORMANCE SINCE 2004
Since such data became available in 2004, toll and turnpike bonds returned 89 percent, easily beating the 74 percent benchmark for the municipal-securities market. The Standard & Poor’s index of U.S. stocks had an 87 percent after-tax return for those in the lowest 28 percent tax bracket — since most investors in tax-exempt securities are in the higher 35 percent tax bracket, though, the advantage to investors in infrastructure bonds has actually been greater.
To be sure, nothing approached gold’s 403 percent return during the past 15 years when global high-yield corporate bonds returned 223 percent, investment grade corporate bonds 139 percent, global sovereign bonds 132 percent and Treasuries 102 percent. But gold’s price fluctuations are four times that of U.S. Treasuries. On a risk-adjusted return basis, gold has been lagging all categories of the credit market. During the past five years, for example, global high-yield corporate bonds gained 32 percent, followed by U.S. Treasuries at 19 percent, global investment-grade bonds at 18 percent and global sovereign debt at 9 percent. Gold lost 16 percent, according to Bloomberg data.
Gold also loses when taxes are taken into account. U.S infrastructure debt is mostly tax exempt, which helped it outperform stocks and bonds not only in the long term but also during the past two years and, most recently, during the last 12 months. In that year they returned more than 10 percent compared to the municipal-bond benchmark of 8 percent and the S&P 500’s 3.6 percent after-tax return. During the past 10 years, when infrastructure bonds returned 82 percent, gold gained 76 percent on an after-tax basis (assuming most investors are in the 35 percent tax bracket) and gold’s volatility, or price fluctuations, was almost six times that of bonds.
So far this year, nothing comes close to matching the returns of infrastructure debt in the municipal market, where North Carolina Turnpike Authority debt has appreciated more than 22 percent, followed by Colorado’s E-470 Public Highway Authority’s 12 percent and California’s Riverside County Transportation Commission’s 11 percent, according to Bloomberg data.
So when Larry Summers calls for “a new approach” starting from “the idea that the basic responsibility of government is to maximize the welfare of citizens, not to pursue some abstract concept of the global good,” and to let people “feel that they are shaping the societies in which they live,” the market already has ratified this policy by making infrastructure one of the best investments of our time.
BloombergView
By Matthew A. Winkler
(With assistance from Shin Pei)
JULY 13, 2016 5:00 AM EDT
This column does not necessarily reflect the opinion of the editorial board or Bloomberg LP and its owners.
To contact the author of this story:
Matthew Winkler at [email protected]
To contact the editor responsible for this story:
Jonathan Landman at [email protected]
With U.S. bond yields near record lows, municipal-debt investors are finding a way to pick up a little extra return: Buying lower-coupon securities, which provide fatter payouts because they’ll be harder hit once interest rates start to rise.
The discrepancy was on display when Massachusetts sold bonds late last month. The state paid a 2.18 percent yield on those maturing in 2038 that pay annual interest of 5 percent. For debt with a 3 percent coupon, the yield was half a percentage point more.
Even such a small pickup can be alluring with negative interest rates overseas, Treasuries paying near record lows and the difference between long and short-term municipal debt narrowing to the least since 2008 — meaning there’s less extra income for holding the longest-dated securities. And the risk that the Federal Reserve will soon tighten monetary policy appears to have receded: prices in the futures market suggest a rate increase isn’t likely until the second half of 2017.
“Absolute levels of rates are getting so low that for people, particularly high-grade buyers afraid of credit risk, a strategy to outperform is to buy lower coupons,” said Peter Block, managing director of credit strategy at Ramirez & Co Inc., a New York-based underwriter.
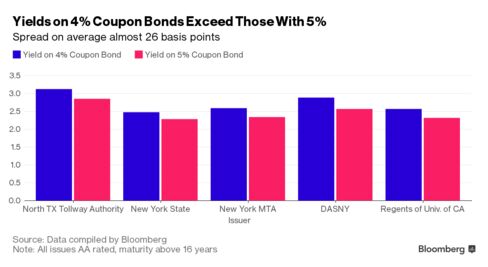
The discrepancy stems in part from a quirk of the $3.7 trillion municipal market, where most state and local governments give themselves the option to buy bonds back before they’re due — usually in a decade — in case they can be refinanced at lower costs.
Because interest rates have largely been on a steady decline since the 1980s, governments have almost always exercised that option. If rates were to rise, which would cause prices of outstanding bonds to fall, those with rock-bottom coupons are more likely not to be called back, leaving investors with the choice between selling at a loss or holding them until maturity.
For bonds with top tier credit ratings, that risk has caused investors to demand about one-quarter percentage point more in yield to hold 10-year bonds with a 4 percent coupon instead those set at 5 percent, Block said. Some mutual funds also have little option but to buy the lower-coupon debt, he said: Many are restricted from paying too much above the bond’s face value. As yields have declined, the price of fixed-income securities with higher annual interest payments has soared.
“The question is,” he said, “Will four’s become the new five’s? Will orange become the new black?”
Bloomberg Business
by Molly Smith
July 13, 2016 — 2:00 AM PDT
Douglas Offerman, Senior Director at Fitch Ratings, talks about the landscape for public pensions with The Bond Buyer. He looks at how state pensions are faring and discusses what impact the new GASB requirements have on disclosure.
Social impact investing describes the direction of investment funds to opportunities or companies that have desirable environmental, governance or social factors, and is related to social finance, which involves the use financial assets or instruments to fund projects that have a positive social or environmental impact.
Through impact investing, America’s capital markets enable programs to improve local outcomes and help communities combat the challenges of long-standing problems such as poverty, pollution, and other social needs.
SIFMA hosted a roundtable on Social Impact Investing with industry experts and Members of Congress. The event fueled a discussion on the role of America’s capital markets in creating and funding programs designed to improve local communities. Participants discussed Social Finance’s Pay for Success Programs, such as the Nurse-Family Partnership in South Carolina and the Connecticut Family Stability Project; and Morgan Stanley’s underwriting work for Sustainable Neighborhood Bond, which funds affordable housing in New York, and its Investing with Investing with Impact Platform and Sustainable Investing Portfolios, which allow investors of all sizes to invest with impact, making scale in the social finance market possible.
July 14, 2016
By: Chris Killian
NEW YORK, NY, July 14, 2016 – CUSIP Global Services (CGS) today announced the release of its CUSIP Issuance Trends Report for June 2016. The report, which tracks the issuance of new security identifiers as an early indicator of debt and capital markets activity, suggests a steady issuance of new corporate and municipal debt offerings over the next several weeks.
Total CUSIP requests for all U.S. and Canadian corporate securities reached 3,864 in June, up 9% from May
monthly totals. Within that broad asset class, there were 797 security identifier requests for new U.S. corporate debt issues, a decline of 9% from May, and 304 CUSIP request for Canadian corporates, a 20% increase over the previous month. On a year-over-year basis, corporate CUSIP request volume for both debt and equity asset classes across the U.S. and Canada was down -0.3% through June 2016 versus June 2015, reflecting weak volumes in January 2016 and comparatively strong issuance volumes in the early part of 2015.
The volume of requests for new municipal CUSIP identifiers saw a fifth consecutive month-to-month increase in June. A total of 1,754 new municipal bond identifier requests were made over the course of the month, a 1% increase from May. On a year-over-year basis, municipal bond identifier requests were up 1.3% in June.
Regionally, municipal bond issuers in Texas demanded the highest volume of new CUSIP identifiers in the first half of 2016, accounting for a total of 1,013 identifier requests during the period. Texas was followed by New York (774 CUSIP requests) and California (656 CUSIP requests).
“While the month-to-month growth rate of new CUSIP requests in the corporate debt and municipal bond market
has slowed from the break-neck pace we were seeing earlier in the year, we’re still seeing indications of very steady new issuance volume for the coming months,” said Gerard Faulkner, Director of Operations for CUSIP Global Services. “As we turn the corner to the second half of the year, we expect the CUSIP indicator to be a telling signal for the market appetite of major debt and equity issuers.”
International debt and equity CUSIP International Numbers (CINS) were mixed in June. Requests for new
international debt CINS were down 9%, while requests for new equity CINS were up 48%. On a year-over-year
basis international debt CINS were down 30% and international equity CINS were down 61% through June 2016.
“Given all of the uncertainty in the global economy right now, it’s actually quite amazing that CUSIP request volume has stayed so strong,” said Richard Peterson, Senior Director, S&P Global Market Intelligence. “Clearly, issuers across several asset classes still see an attractive environment for raising new capital and that sentiment is continuing to show up in our CUSIP request data.”
To view a copy of the full CUSIP Issuance Trends report, please click here.
That may seem like an odd question until you consider that a tax-credit financing could easily be viewed as ‘AAA.’ That contrasts with Illinois bonds that trade below their ‘BBB’ benchmarks. The difference represents significant value — perhaps more than 100 basis points of savings on long-term offerings.
Here’s a simple example of a proxy financing. Instead of issuing a 1year note that paid $100 at maturity, Illinois would sell a $100 tax credit that could be applied any time after one year. It’s an alternative that produces identical net cash flows.
What’s the appeal of the tax-credit alternative? It guarantees that a holder will receive full value as long as he has a matching tax liability. That’s true even if the issuing State is in a financial crisis and can’t pay its bondholders. Imagine where a State’s bonds would trade if it missed a payment. But a tax credit would still be worth 100%. In fact tax credits may be the perfect hedge: as long as taxes are owed, they retain full value.
You might also notice something interesting – using tax credits in this way allows a holder to prepay his taxes at a market discount, which is probably the safest and most efficient way to lend to a municipality.
Still, the ideal solution would be to wrap an ordinary bond around the tax credits, so that a holder has both the convenience of cash pay and the safety of back-up tax credits. That’s the thinking behind a proposed GO structure, Tax Offset Municipal Securities (TOMS). In its simplest form it’s a cash-pay bond, but in the event the issuer can’t pay, bondholders receive equivalent tax credits instead.
In terms of mechanics the Trustee purchases tax credits from the State at the close of the underwriting. This is done under an agreement which acknowledges that the credits are receipts for estimated tax payments. The Trustee would then automatically “put” these tax credits to the State at each payment date for its cash equivalent. If all goes well bondholders would be paid cash as expected and the matching tax credit would expire. But if the State failed to pay, the Trustee would simply distribute the tax credits.
You might ask about the behind-the-scenes machinery. It establishes that a holder’s credit is for estimated taxes already paid. That makes it secure. No one has ever suggested that a State could say to a taxpayer, “We’ve cashed the check for your taxes, but we’re not going to allow the deduction.”
In the end it’s a structure that has the potential to deliver high-grade enhancement without counterparty exposure or credit risk, in effect bond insurance which no traditional insurer can match.
The Bond Buyer
By Paul Fennell
June 30, 2016
Paul Fennell is an independent investment banker specializing in capital market and fixed-income
solutions.
Property-assessed financing for energy-related improvements to homes and businesses is starting to take off in Florida.
Since Florida’s Supreme Court upheld the state’s Property Assessed Clean Energy (PACE) law against challenges last autumn, applications for the innovative financing have been rising fast, and more local governments are signing up to offer the program in their areas, PACE leaders in Florida say.
“We were probably getting 200 to 300 applications a month, and last month, we got about 1,200,” said Joseph Spector, vice president of operations for Ygrene Energy Fund Florida, the largest PACE lender by far in the state. “Now, we’re active in an area of about 2.7 million people. By the end of the summer, as more cities and counties join, we could be at 5 million people – or about 25 percent of the state.”
Ygrene already has contracted about $74 million in PACE financing in Florida since starting three years ago in the state. It expects to sign up $100 million in new financing this year and at least $200 million more next year, Spector told Southeast Energy News.
Two other PACE players active nationwide also are ramping up in Florida. Renew Financial of Oakland, California entered the state last fall by buying EcoCity Partners of St. Petersburg, and is revising its PACE offerings. And Renovate America of San Diego, California is working to launch a residential program in Florida this October and to expand to businesses financing later, executives confirmed.
“There are no more regulatory or legal challenges” to PACE expansion in the state, said Mike Antheil, market development director in Florida for Renovate America. “It’s now about getting the word out to the people, and it’s trending in the right direction.”
A slow start amid legal challenges
Florida’s Legislature authorized the PACE program in 2010. The law lets property owners borrow funds to make energy improvements such as installing more efficient air conditioning systems, solar panels or hurricane-impact windows. The participants then pay back the money together with property taxes – just like an assessment.
In many cases, savings from increased energy efficiency as well as lower premiums on property insurance are big enough to cover the full cost of PACE repayment. That means the owner has no outlays upfront and no added costs in making the property improvements through PACE. Communities also gain, because contractors get new business and improved energy efficiency helps slow demand for new power plants, PACE advocates say.
Begun in California in 2008 and key to financing solar projects there, the PACE program was slow to take off in Florida – until this year.
That’s largely because of legal challenges, including one by the Florida Bankers Association. The bankers worried that repayment of PACE financing would come before repayment of bank mortgages, when properties were sold or re-financed. Similar cases have surfaced at the federal level and been resolved; the Federal Housing Administration is soon to publish guidance aimed to “unlock” PACE for homes with federally-backed mortgages, industry leaders said.
Last autumn, the Florida Supreme Court dismissed the bankers’ case for lack of standing, and it has upheld PACE in several other challenges, said attorney Erin L. Deady, who wrote an extensive article on PACE for the June 2016 issue of the Florida Bar Journal.
Some cities and counties in Florida delayed authorization for PACE, pending the court rulings.
Brandsmart USA, a chain of consumer electronics and appliance stores based in Hollywood, Florida has become the biggest commercial user of PACE funds in the state so far, with projects totaling $5 million. It’s mobilized the financing for new air-conditioning, lighting, roofing and other improvements at several stores in what executive vice president Larry Siniwitz calls “a phenomenal program.”
Brandsmart already is “cash-positive” on PACE at its south Miami-Dade store after the first year, saving about 10 percent more on energy bills and maintenance than it costs to back the money – and all without paying a dime upfront, Siniwetz said. It works through a services contractor, ABM, who handles all the property improvements and also guarantees that the savings from the improvements will be enough to repay PACE, he said.
Governments keen on consumer protections
Some local governments in Florida also had concerns beyond the bankers’ and legal challenges.
South Florida’s Broward County, home to Fort Lauderdale, was worried about protections for consumers and for local governments themselves, said Alan J. Cohen, assistant to the county administrator. The county wanted to make sure that consumers knew that PACE may not pay for itself and could cost them money out of pocket. Plus, the government wanted to find a way to protect cities and the county from lawsuits, if borrowers filed suits against contractors or lenders on PACE projects, Cohen said.
To address those issues, Broward now is putting safeguards in its PACE authorization. First, it is requiring PACE providers agree to cover any costs in the event of a lawsuit related to their projects. Next, it is limiting payments for annual taxes and assessments including PACE to 5 percent of the fair market value of properties – a step taken in other jurisdictions.
In a unique move, Broward also is asking participants to affirm one of three other things when using PACE: Either that the mortgage lender or servicer consents to escrow the PACE assessment; that energy or insurance savings can cover the cost of the PACE assessment; or that the PACE repayment won’t exceed 4 percent of their gross income. The county came up with that income standard because of concern over low-income senior citizens being targeted for financial products, Cohen said.
“Consumer protections by far are the most important aspect of what we are moving forward with,” Cohen said of PACE.
Unlike some other states, PACE programs in Florida are not run by governments but rather by third-parties such as Ygrene and Renew Financial. Programs typically involve a district that cities and counties can join. The trend now is for local governments to sign up with multiple providers, so that the programs compete.
Not much PACE funding for solar so far
By volume, competition will be largely for residential financing.
At Ygrene, about 99 percent of PACE contracts in Florida so far are for homes and then mainly for hurricane-related protection such as impact windows and new roofs, said Spector. Those upgrades cut insurance premiums. Thicker windows, often with tinted film, also help trim energy costs by keeping out more sun. So far, Solar accounts for only about 6 percent of the PACE funding in Florida, Spector added.
“We recommend property owners secure the building envelope first” with impact windows, roofs and other improvements, said Spector. If people want solar panels later, they can opt for a smaller installation to meet lower energy needs.
Rivals also will compete on terms for funding. Ygrene now offers financing for terms of 5, 10, 15 or 20 years with rates ranging about 6.5 percent to 7.4 percent linked to indexes, Spector said. The average amount financed now runs about $22,500, he said.
But the biggest difference between programs, industry leaders agree, will be how they treat consumers and contractors.
At Ygrene, Spector said staff is trained to describe PACE to consumers in detail. Some people call in and think because PACE is government authorized, it’s free. “You have to explain that it’s like going to a bank. You have to qualify first, and you have to pay it off,” he said. To protect customers, Ygrene also won’t pay contractors until an inspection is complete or the borrower has signed off on the project, added Spector.
The competition is expected to grow as Renew Financial and Renovate America get active in the state. Over time, predicts Spector, “You’re looking at a PACE industry that could potentially be at half a billion dollars in financing per year in Florida.”
Southeastern Energy News
by Doreen Hemlock
July 6, 2016
Doreen Hemlock writes on energy, business, travel and other topics. She’s worked on staff at newspapers in the U.S. Virgin Islands, Peru, Venezuela, Puerto Rico and South Florida and contributed to publications worldwide. She holds an MBA from Columbia University and lives in Miami Beach.
For the average citizen, comprehending government finance is along the lines of comprehending quantum physics.
Fortunately, a new company, ClearGov, has been launched to address the former. We’ll leave the latter to institutions of higher learning.
Based in Hopkinton, the startup was founded last year to bring clarity to government finance, hence its name.
And the company has already been making news. Earlier this year, it took first place in AOL Inc.’s TechCrunch PitchOff at the Royale nightclub in Boston. Billed as an event showcasing the “Cream of the Boston Startup Crop,” TechCrunch has been hosting startup competitions in Boston every year since 2013.
ClearGov was one of only 10 finalist startup companies chosen to participate. At the event, its CEO and founder Chris Bullock was given 60 seconds on stage to pitch ClearGov to a packed house of hundreds of attendees and a panel of judges made up of local venture capitalists and TechCrunch editors.
“Everyone has a right to know how their local property tax dollars are being managed,” said Bullock. “ClearGov transforms complex and confusing municipal financial reports into easy-to-understand infographics that benchmark cities’ and towns’ performance against statistical peers. The platform helps local governments better communicate their financial performance to help inform voters and policy makers. Being selected by the panelists as the winner was a great validation for our business and clear indicator that there is demand for tools that help governments drive efficiencies.”
As result of its victory, ClearGov was awarded an exhibitor table in May at TechCrunch Disrupt NY 2016, an event described as “the world’s leading authority in debuting revolutionary startups.”
ClearGov was also recently named by the editors of Government Technology magazine to the GovTech100 comprised of 100 government-focused companies with innovative or disruptive offerings.
Bullock recently discussed his company with Daily News staff writer Bob Tremblay.
QUESTION: Why was the business started?
ANSWER: ClearGov was born from a simple question: “How are my property taxes being spent?” I searched municipal websites and found large, annual reports 200-300 pages long. About halfway into them I would find the financial statements, but they used unfamiliar terminology, had complex transfers between funds and generally lacked any context to the numbers. For example, seeing that a municipality spends $60 million on education is nothing more than looking at a large number without context. What people want to see is how much of their money goes towards things like education and are the tax dollars being spent efficiently compared to other cities and towns. In other words, I could see a tremendous need for clarifying government data and putting it into perspective. Fulfilling that need facilitates the overall enhancement of government efficiency and public engagement in a most productive manner.
This isn’t my first time taking an opaque industry and making it transparent. I did that in the legal industry as well as co-founder of Sky Analytics, which helped large corporations benchmark attorney rates and matter costs. It has since been sold to Huron Consulting. I was fortunate to combine my analytic background with my co-founder’s solid municipal and executive management operations. ClearGov is my fifth company.
Q: Why did you choose your current locale?
A: I live in Hopkinton and decided to base the business in my hometown.
From April to June, ClearGov was invited to be part of the Innoloft Acclerator at the Constant Contact headquarters in Waltham. We’ve grown from four to eight employees and our development team will soon be expanding, so we have since relocated from Waltham to Hopkinton.
Q: Do you have other businesses or work in other businesses?
A: No.
Q: What does your company do?
A: ClearGov creates financial transparency pages on our website for every town in Massachusetts (and several other states) that are free to the public. We sell expanded, more robust and granular data platforms to the municipalities for an annual fee. Those platforms are linked or embedded in their municipal websites to provide a user-friendly consumer interface for local government transparency. Local municipalities add more recent and detailed financials to the site along with commentary to better tell the story behind figures, to share the metrics that drive budgetary decisions and to access tools to benchmark their municipal budget against the state and their statistical peers.
Q: What makes you different from the competition?
A: Benchmarking: Numbers by themselves are near meaningless to the average citizen. To know that your town spends $55 million on education is not too helpful, but to know that your town spends 47 percent more than similar towns on education is interesting. Benchmarking provides powerful context to data.
Visual format: Our infographic format is easier to digest for the average citizen; other platforms often have a lot of bells and whistles, but too many options can confuse the average citizen. So we’ve purposely taken a simpler approach to the user interface modeled after infographics.
Market approach: From a more holistic standpoint, our whole market approach is unique. ClearGov.com is a resource for taxpayers. Towns have a presence on ClearGov even without their participation, so towns are drawn to want to manage their presence.
Non-financial metrics: ClearGov intertwines demographic and educational data to better communicate the factors that may be driving costs.
Q: What is the price of your service?
A: ClearGov’s annual fee is based on the municipality’s annual budget and ranges from $2,500 a year to $25,000 a year. ClearGov launched its service to municipalities in December 2015. Framingham, Sudbury, Holliston, Norwell, Norwell, Easton, Athol, Brookline and Upton are just a few of the towns that have already signed up.
Q: Any future plans?
A: ClearGov will be launching in several new states in the coming months.
Q: Any news to report?
A: ClearGov is currently raising a seed round of investment.
Q: Apart from residing in Hopkinton, do you have any other MetroWest connections?
A: I was born and raised in Framingham and graduated from Framingham High School in 1995.
ClearGov’s website is www.ClearGov.com.
The Milford Daily News
By Bob Tremblay
Daily News Staff
Posted Jul. 11, 2016 at 12:01 AM
In the past, states and local governments have relied in large part on low-cost tax-exempt financing to meet their infrastructure needs. While there is a growing consensus that our present infrastructure needs are great, many states and local governments are finding it more difficult to continue to borrow to address such needs due to a number of factors, including constitutional and statutory debt limitations, mounting pension liabilities and flat and/or declining revenues. As a result, a number of states and local governments have turned to public-private partnerships (“P3s”) to address infrastructure needs. P3s have been successfully used in Western Europe and Canada for many years but have only recently taken root in the United States. A P3 is an arrangement between a governmental entity and a private entity that allows for greater private sector investment and participation in public projects. Sectors where P3s have been used include transportation, energy (including municipal electric and gas generation and distribution facilities, as well as renewable energy projects), telecommunications, water and wastewater, governmental buildings, healthcare, education, housing (affordable, senior, student and military) and hospitality. While Federal tax law requirements often force governmental entities to choose between low-cost tax-exempt financing and P3s, there are a number of proposals pending that would expand the ability of governmental entities to use both together.
Under Federal tax law, governmental entities may only issue tax-exempt governmental bonds to finance projects where there is little to no private business use. Private business use can arise from any number of arrangements with private entities, including leases and management contracts. Until recently, management contracts generally had to fit within one of the safe harbors set forth in IRS Rev. Proc. 97-13, which essentially only allows for compensation to the private party to be a fixed amount or a fixed amount per unit of service. However, the IRS has recently provided more flexibility with the respect to the terms of such arrangements. Notice 2014-67 added to the list of allowable agreements an agreement where the compensation paid to a private party may include a percentage of gross revenues or expenses of a facility (but not both) so long as the term of the contract is not more than 5 years. In addition, the Notice clarified that a productivity reward generally does not cause the compensation to be based on a share of net profits, which would result in private use, if the eligibility for such award is based on the quality of the services rather than increases in revenues or decreases in expenses and the amount is a stated dollar amount. Even more recently, the IRS released Private Letter Ruling1 201622003, which approved a management contract where a portion of the compensation is an incentive fee that is partly triggered by a variant of net profits. The IRS found that the incentive fee was not structured in such a way that its amount rose in proportion to increases in net profits or fell in proportion to decreases in net profits, and therefore ultimately was not based on a share of net profits. The IRS has indicated that it intends to publish further guidance on management contracts sometime this year, and it is our hope that such guidance will allow for even more flexibility with respect to the terms of such agreements.
In addition to guidance on management contracts, in 2015, the IRS released final allocation and accounting regulations that will also help to facilitate P3s. These regulations allow for “mixed-use” projects where the governmental portion is financed with tax-exempt bonds and the private portion is financed with equity. In addition, with respect to partnerships, the new regulations look through to the partners so that the amount of private business use is only the private partner’s use of the property.
In addition to tax-exempt governmental bonds, Federal tax law currently allows tax-exempt private activity bonds to be issued to finance a variety of specified projects, including airports, water and sewer infrastructure, solid waste facilities, public education facilities and highway infrastructure. In fact, a number of large P3 projects in the transportation sector have paired credit assistance under the Transportation Infrastructure Finance and Innovation Act (“TIFIA”) with tax-exempt qualified highway facility private activity bonds. There are also several administration and congressional proposals to enhance existing private activity bonds and to add new categories of private activity bonds. As part of his 2016 proposed budget, President Obama presented the concept of qualified private infrastructure bonds and there is proposed legislation in Congress that would create Move America Bonds, both of which would help encourage private investment in infrastructure through P3s by allowing for tax-exempt financing of certain types of public facilities where there is private use. Another legislative proposal would add to the list of tax-exempt private activity bonds certain types of governmental buildings and thus allow for state and local governments to utilize tax-exempt financing for P3 projects involving public libraries, public universities and colleges, courthouses, public hospitals and health care, research and laboratory facilities, government offices, and public safety facilities. Under current law, the amount of many private activity bonds that may be issued annually is limited, but water and wastewater infrastructure P3 projects, which municipalities all over the country have increasingly looked to in order to fulfill the massive need for capital improvements in that sector, could be bolstered by proposed legislation that would remove this volume cap limitation for private activity water and wastewater bonds. In a related development, Congress also recently amended the Water Infrastructure Finance and Innovation Act (“WIFIA,” and modeled after TIFIA) to allow the use of tax-exempt bonds with WIFIA credit assistance.
All in all, leaders in Washington seem to have recognized the growing use of P3s by state and local governments, have taken positive steps to facilitate the combination of P3s and low-cost tax-exempt financing, and are poised to take further action in this area.
by Michael J. Bradshaw
Last Updated: July 6 2016
Butler Snow LLP
The content of this article is intended to provide a general guide to the subject matter. Specialist advice should be sought about your specific circumstances.
Bank of America Merrill Lynch stormed back in the second quarter to rank first among municipal underwriters for the first half of 2016, increasing its par amount and market share from a year earlier.
Public Financial Management Inc. remained atop the financial advisor league table and the state of California was the largest municipal issuer.
BAML closed the quarter with a par amount of $20.76 billion in 161 issues, or 17.5% market share for the second quarter. For the first half, the firm finished at $33.98 billion in 283 deals, for a 15.8% market share, up from $27.85 billion in 263 deals or 13% market share in the first half of 2015, according to data from Thomson Reuters.
Overall, the top 10 firms combined for a total par amount of $214.51 billion in 6,417 transactions compared to $215.01 billion in 6,839 transactions in the first half of last year.
“It’s a spectacular opportunity right now and we are working hard at helping our clients to come to market and take advantage of the low rates,” Jonathan Nordstrom, head of municipal sales and trading at Raymond James, which climbed two places to eighth in the first half ranking. “There is excellent interest in muni bonds and we are even seeing the international customer coming in, it’s an incredible market right now but rates could go lower.”
Citi, which finished in first place after the first quarter, dropped back down to second place with a total of $27.29 billion in 290 deals or 12.7% market share in the first half. That compares with to $25.34 billion in 279 deals or 11.8% market share in the same period last year, when Citi was also in second place.
For the second quarter, Citi had a par amount of $14.05 billion or 11.8% market share. Citi was the lead bookrunner on some of the largest deals so far this year, including the $2.9 billion general obligation sale in March from California and the $2.4 billion LaGuardia airport deal, which was the biggest airport and alternative minimum tax deal to ever hit the market.
JPMorgan finished both the quarter and first half in third place. For the quarter, the bank had $13.56 billion in 133 transactions or 11.4% market share. JPMorgan finished the half with $22.03 billion in 221 deals or 10.3% market share, down from $24.67 billion in 245 deals or 11.5% market share in the first half of last year, when it also ranked third.
Morgan Stanley finished the first half in fourth place, with $14.91 billion or 7% market share, down from $18.02 billion or 8.4% market share a year earlier. They also finished in fourth place for the second quarter, winding up with $7.92 billion or 6.7% market share for the past three months.
Rounding out the top five is Wells Fargo, which moved up one spot from last year and finished the first half with $14.75 billion or 6.9% of the market, which compares to $11.54 billion or 5.4% in the first half of 2015, which was good for sixth place.
RBC Capital Markets was sixth with $10.94 billion, followed by Stifel with $9.14 billion but had the most number of deals with 485.
Raymond James was the biggest mover, jumping up two spaces to number eight with $8.98 billion.
“We are pleased with how the year has gone, working hard to try and increase market share and influence and impact on our customers,” said Nordstrom. “Our competitive underwriting desk has done a great job of pulling business and that is connected with our sales force, who continues to get better. We are seeing more engagement with customers and that has helped propel our performance.”
Piper Jaffray was ninth with $8.13 billion and Barclays finishes the top 10 with $6.97 billion.
Financial Advisors
Public Financial Management was once again atop the first half league tables for financial advisors, as they increased its par amount and market share from last year. PFM finished the half with $39.50 billion or 21.9% market share, which was up from the $35.65 billion and 19.8% market share from the first half of 2015.
“PFM was pleased to increase our market share during the first half of the year compared to the first half of 2015, even as bond volume declined,” said John Bonow, chief executive officer and managing director for the PFM Group. “We believe that the increase is due to two factors: our consistent ability to help clients identify refinancing opportunities in the prevailing low rate environment and a good number of clients focused on creative and sustainable ways to finance much needed projects and infrastructure.”
Bonow said low borrowing rates seem to have real traction as the world digests the U.K. exit path from the European Union.
“Domestic economic indicators continue to be mixed, but worldwide financial and economic uncertainty will likely depress the appetite for the Federal Reserve to take action on rate increases and that may encourage many state and local governments to make longer-term commitments to infrastructure and social program investments,” he said.
Bonow said he expects PFM to continue to bring effective solutions to its current and future clients who understand the value PFM provides through our practical and sustainable financial solutions to their challenges.
Hilltop Securities, which was in third place at the end of the first quarter, moved up into second place to finish the first half, the same position they were in at the end of the first half last year. Hilltop’s par amount was $18.49 billion. Public Resources Advisory Group finished the half with $17.36 billion for third place, after finishing the first quarter in second place.
The two biggest movers in the ranking were the firms rounding out the top five: Acacia Financial Group Inc. and Kaufman Hall and Associates Inc.
Acacia moved up to fourth, after finishing the first half of 2015 in sixth place. The New Jersey based company finished the first half with $8.30 billion, up from the $4.21 billion in the first half of 2015.
Kaufman Hall and Associates moved into the fifth spot after posting $4.04 billion in the first half of this year.
Negotiated Underwriting
BAML claimed the top spot for underwriting negotiated deals, with a par amount of $22.39 billion for the first half this year, compared with $17.78 billion during the same period last year when it finished third. Citi remained in second, the same spot as in the first half last year, with $19.91 billion. JPMorgan, which was in first at this point last year, fell to third with $15.50 billion. Morgan Stanley was fourth with $10.83 billion and RBC fifth with $10.68 billion.
Wells Fargo ranked sixth with $10.61 billion, followed by Stifel with $8.74 billion, Piper with $7.00 billion, Raymond James with $6.84 billion and Barclays with $6.31 billion.
Competitive Underwriting
BAML finished the first quarter atop the ranking for competitive-only deals with $11.59 billion, followed by Citi with $7.39 billion. JP Morgan was third with $6.52 billion. Robert W Baird & Co., was fourth with $4.28 billion, moving up from sixth at this point last year and Wells Fargo was fifth with $4.14 billion, as it made the biggest year-over-year leap, moving up from sixth place a year ago.
Morgan Stanley was sixth with $4.08 billion, followed by Raymond James with $2.14 billion, Hutchinson Shockey Erley & Co. with $1.24 billion, Piper with $1.13 billion and FTN Financial Capital Markets with $885 million.
Top Issuers
The state of California is the No. 1 issuer for the first half of the year, retaining the top spot it held after the first quarter of the year. In total so far this year, the Golden State has issued $4.52 billion of bonds.
“Our general obligation bonds are what we issued the most of so far this first half,” said Tim Schaefer, deputy treasurer, public finance, for California Treasurer John Chiang.
The Golden State came with a whopping $2.9 billion GO sale in March, which was more than half refunding. The final amount was split into $1.1 of new money and $1.8 of refunding, which gave the state $294 million of present value savings. In April, they came back with $1.5 billion, which was mostly refunding and they netted another $195 million of PV savings.
Schaefer said that refundings are driving the volume.
“With interest rates as low as they are, we are being very aggressive in refunding everything we can get our hands on as long as it makes economic sense,” he said. “The market has been very kind to us in the last 18 months, offering us very attractive yields and trading at much tighter spreads from the MMD scale that our ratings would imply.”
Schaefer also said that the state is in much better financial position than it has been in a long time and that the market appears to be telling us they have greater confidence in the state’s ability to manage it out of tough situations.
“As long as the supply and demand stays this way, we will take advantage. We are high grade, but not yet triple-A, so that hand full of basis points of extra yield makes a difference.”
Although an issuer from the west coast held the top spot, the east coast was well represented with four of the top five spots, including three issuers from New York City.
The New York Transportation Development Corp. was second with $3.25 billion, most of which came during the mega LaGuardia deal.
The NYC Transitional Finance Authority was third with $2.65 billion, followed closely by the Commonwealth of Massachusetts with $2.64 billion. The NYC Metropolitan Transportation Authority rounds out of the top five with $2.62 billion.
The Bond Buyer
By Aaron Weitzman
July 6, 2016
The social impact bond or pay for success program (“PFS program”) is an alternative private financing model used to test social impact programs before governments step up to finance such programs. In these programs the government contracts with a private sector intermediary to obtain social services. The intermediary obtains funds for the services by raising capital from private commercial and/or philanthropic groups. The intermediary uses these funds to pay a service provider to deliver the social services. Over a set period of time, performance of the social services is measured, usually by a third party consultant, based upon up-front established criteria. After the review period, the government pays the investors only if the performance targets are met.
As of the end of 2015, there were eight (8) established PFS contracts in the United States and more in the pipeline. The Corporation for National and Community Service through its Social Innovation Fund launched a PFS program and selected eight (8) initial grantees through which 43 programs are receiving technical assistance. Banks such as Goldman Sachs, Northern Trust, Bank of America, Merrill Lynch and Santander Bank have invested capital in PFS programs. In addition, federal legislation, known as the Social Impact Partnership Act, has been introduced to help establish PFS programs, and six (6) states (Colorado, Idaho, Massachusetts, Oklahoma, Texas and Utah) have passed PFS enabling legislation. Other states are considering legislation or participating without legislation.
Despite the trend toward expanding PFS programs, there are some criticisms. PFS programs can be more expensive than direct government funding due to costs of legal services, program administration and loan management. There are also questions about how outcomes are measured, since the “success” of most programs is measured in a relatively short time frame considering the deep-rooted social problems that are being addressed. In addition, data suggest that investors want to minimize risk and back programs where there is more evidence of possible success. Detractors of PFS programs argue that governments should finance these programs themselves based upon the probability of success. Despite the questions and criticisms, it appears from the significant increase in PFS programs that this type of investment tool is here to stay, at least in the short-term.
by Francina J. Critzman
Last Updated: July 8 2016
Miles & Stockbridge
The content of this article is intended to provide a general guide to the subject matter. Specialist advice should be sought about your specific circumstances.
How do they do it?
Municipal bonds maintained a trajectory to the record highs reached last week as a series of bankruptcies, budget debacles and defaults failed to damage investor confidence in the industry as a whole.
Municipal analysts and experts say decades of improvements – from enhanced disclosure and heightened enforcement to increased transparency and growth of technological advancements – have helped the broader tax-exempt market build immunity to isolated debacles in distressed municipalities.
Improved credit surveillance and information flow, advancements in online trading platforms, better market technicals, and the economy have helped investors shrug off a range of fiscal debacles from today’s credit crises in Puerto Rico and Illinois, to the historic $18 billion Detroit bankruptcy in 2013 and the $2 billion Orange County, Calif., default back in 1994.
Robert Doty, president of Annapolis, Md.-based municipal securities consulting firm AGFS attributes munis’ staying power to better disclosure practices and market discipline enforced by the Securities & Exchange Commission.
“The market continues to function even though we have a major issuer in the market – Puerto Rico – defaulting, and Illinois is teetering,” he said.
Disclosure and Market Stability
Some analysts say the stability of the market is tied to economic progress and the general credit worthiness and demand for tax efficiency in the $3.7 trillion municipal market.
“As long as the tax base and the population remain near current levels the market will continue to let Illinois kick the can down the road,” Michael Pietronico, chief executive officer at Miller Tabak Asset Management, said in an interview last week.
Overall, the municipal bond market has awarded lower borrowing costs to issuers with strengthening finances, and that has helped the market retain its positive nature in the midst of recent credit and fiscal crises, Pietronico said.
“Issuers believe market access is a right when in fact it is a privilege,” he added.
“Detroit is a prime example of that phenomenon as they leaned on the rest of the state of Michigan to gain market access when in many minds they were bankrupt and unable to fund their own liabilities.”
“Puerto Rico understands that ‘penalty box’ quite well, while states such as Illinois continue to pay a yield premium in a market starved for yield,” Pietronico added.
Doty, who has over 45 years of experience in the municipal industry, said disclosure and transparency enforced by the SEC have continued to improve, protecting today’s market in the face of credit debacles.
“We have a lot of guidance and the market has improved considerably,” he said, referring not only to SEC disclosure and enforcement practices, but also the guidance and market support from the National Association of Bond Lawyers and National Federation of Municipal Analysts.
Problematic credits, such as the state of Illinois, Chicago, and New Jersey are viewed as “one-offs” that are isolated from the general market, according to Jeffrey Lipton, managing director and head of fixed income research at Oppenheimer & Co.
“These are high profile names that take up significant headline real estate, and for the most part, should not deliver very many surprises given the information flow and heavy analytical coverage,” Lipton said. “The muni market is a $3.6 trillion entity with an extremely high percentage of bonds meeting timely payment of principal and interest. The asset class also experiences much higher recovery rates as compared to corporate bonds.”
David Litvack, managing director and head of tax-exempt research at U.S. Trust, Bank of America Private Wealth Management said the municipal market is “benefitting from a very favorable technical environment, in which demand for tax exempt income is overwhelming available supply.”
New deals are oversubscribed, and low nominal rates have caused credit spreads to tighten over the last few years as investors search for yield, he said.
“We believe Puerto Rico’s credit problems have not resulted in contagion to the broader muni market, because the commonwealth is seen as an outlier,” Litvack added.
Puerto Rico’s fiscal and economic declines with associated bond defaults are not expected to have a systemic impact upon the broader municipal market, because its fiscal story has been widely publicized in recent years, according to Lipton.
“There has been a substantive shift in trading participants and commonwealth bond ownership to more sophisticated investors such as hedge funds and distressed buyers,” Lipton said in an interview last week. “We continue to believe that any temporary market sell-off that may be triggered by a Puerto Rico event could give rise to buying opportunities,” he said.
Historical Comparison
Decades of industry advancements – some as basic as information flow – have helped the market evolve and strengthen.
“In the 1970’s the market still had physical certificates and coupons to clip,” John Donaldson, director of fixed income at The Haverford Trust Co. said last week. “Today, municipal bonds trade and settle like any other issue.”
Transparency has evolved and contributed to better market participation.
“We can see the details on any public issue from our Bloomberg terminal; we can access updated financial reports with a click,” Donaldson said. “Back then it could easily take a week to get information necessary to make a decision on a credit you did not own.
“Price information in the form of MSRB trading data is also transparent. Secondary market pricing in the 1970’s was anything but transparent,” he added.
The advent of official statements on general obligation deals helped to define the practice of increased disclosure to and education of investors over the last three decades, Doty of AGFS said.
The market in recent years has fared significantly better than it did back in the mid-1970s when New York City faced default on its GO debt in 1975 due to the ill effects of a stagnant economy, according to Doty. It narrowly avoided default after the Teacher’s Union agreed to invest $150 million to buy Municipal Assistance Corporation bonds, followed by a $1.3 billion in federal loans to the city for three years.
“The market was extremely disruptive when New York City had its problems, but it’s a contrast, and the difference in my view is that investors can distinguish between credits and back then they couldn’t,” Doty said. “Official statements weren’t being used very much for GOs, and New York City didn’t use one until 1975.”
Now, traders are able to value so-called troubled bonds based on the specific risk and arrive at yields that satisfy the investor community – something that couldn’t be done in the 1970s because the pricing and credit information wasn’t easily and readily accessible, Doty of AGFS said.
Despite the distressed outliers, investors can rely on municipal bonds for capital preservation, portfolio liquidity, tax-exemption, as well as strong credit quality, Lipton said.
“The muni market of 2016 has, in some ways, become an extension of 2015, but overall performance is poised higher this year,” he added. “Muni bond buyers have been nicely rewarded just by staying invested and clipping their coupons,” he added. “Year-to-date, Barclays shows munis have returned 4.49%, versus 5.52% for Treasuries.”
Lipton said a so-called “perfect storm” may create an attractive municipal bond market that may lead to even lower yields – even with the ongoing debacles.
“A more accommodative Fed, the Brexit vote – with all of the associated uncertainty – variability in economic data, strong market technicals, and an enduring competitive edge are all converging,” Lipton said. “This dynamic is expected to extend the market’s 38 consecutive-week run of positive mutual fund flows, despite noted retail and institutional resistance to currently lofty prices.”
The Bond Buyer
By Christine Albano
July 1, 2016
Clayton County officials blocked without explanation Tuesday night a plan to issue tax-exempt bonds to renovate three apartment complexes that are home to 2,500 residents.
The plan Tuesday would have enabled a nonprofit to buy and renovate the apartment complexes using tax-exempt bonds issued by Wisconsin-based Public Finance Authority. The project now will have to be done using taxable bonds. About 50 residents from the three apartment complex showed up for the commission meeting.
Commission Chairman Jeff Turner, who supported the deal, asked commissioner Michael Edmondson, who brought the measure before the board, to explain his reasoning for blocking the deal. Edmondson replied “I don’t think it’s in the best interest of the county.” When asked after the vote to elaborate, Edmondson declined to give details.
The Public Finance Authority deal would not have created any financial risk to the county, said Richard deGorter, executive director of Linked Economic Development & Affordable Housing Foundation or LEDAHF. LEDAHF is a 22-year-old nonprofit in the Washington, D.C. area that has been buying and rehabbing properties along the east coast to preserve affordable housing. The Clayton project is LEDAHF’s first in Georgia.
The loss of tax exempt status for the $50.7 million bond issue will cost LEDAHF about $500,000 a year more or about $17 million over the life of the 35-year bonds, deGorter said.
DeGorter told The Atlanta Journal-Constitution he will look at taking the case to federal court with the help of national nonprofits that pursue such litigation.
“In 40 years as a developer, I’ve never encountered anything as irrational and, I believe, illegal as this vote,” deGorter said. “The lack of accountability and transparency on the board is unprecedented in my experience and extreme. We’re exploring bringing the federal government (into to this case) because it’s a violation of the Fair Housing Act because they’re obstructing the provision of affordable housing.”
Despite the county’s decision, deGorter said: “We’re still going to buy the properties but this action bars us from getting tax-exempt bond financing. ”
LEDAHF is under contract to buy Laurel Pointe and Bradford Ridge apartments, both of which are in the northwestern part of Clayton, Commissioner Gail Hambrick’s district. Hambrick voted to block the plan. The nonprofit also plans to buy Ashford Ridge, a 250-unit complex in the center of Clayton, commissioner Michael Edmondson’s district. Edmondson also voted to reject the financing by Public Finance Authority. Commissioner Sonna Singleton Gregory cast the third vote, effectively killing the tax-exempt bond deal. Commissioner Shana Rooks voted in favor of the deal.
The three apartment complexes are owned by JAMCO Properties, which owns 20 apartment properties in metro Atlanta, most of which are clustered in Clayton. A review of online comments about JAMCO showed complaints about the properties ranging from aging pipes to poor treatment by staff to flooding.
“I’m very disappointed. It’s a decision that has great impact on a whole lot of people. This (plan would) renovate apartments, beautify the area and increase the tax base. I don’t know why he’s doing this,” Turner told the Atlanta Journal-Constitution regarding Edmondson’s action. “He owes the citizens of Clayton County an explanation.”
The Atlanta Journal-Constitution
By Tammy Joyner
Posted: 3:05 p.m. Wednesday, July 6, 2016
As bond yields dwindle worldwide, investors are turning to a $150 billion niche of the municipal market that offers higher payouts because of the risk they’ll be subject to a tax that few Americans actually pay.
The securities, which finance airports, housing agencies and non-profits, provide yields that are more than half a percentage point above typical state and local debt. That’s because the interest is covered by the Alternative Minimum Tax, a federal provision that applies to about 4 million high-income earners a year. For everyone else, it’s tax free.
“The demand for AMT bonds has grown because everyone is in search of yield in this yield-starved market,” said Tommy Chan, a senior credit analyst in New York for Ziegler Capital Management, which oversees about $11 billion and has been buying some of the debt for clients who aren’t subject to the tax. “The yields have compressed over the past year, but we still think there’s value there.”
Taxable debt has been among the best performing in the municipal market, in part because of money pouring in from overseas while officials hold interest rates below zero in Germany and Japan to spur economic growth. The bonds have returned 11.2 percent since the beginning of the year, more than double the 4.7 percent on traditional tax-exempt securities, according to Bank of America Merrill Lynch’s indexes.
When New York’s LaGuardia Airport sold $2.4 billion of the AMT debt in May, 30-year securities with a 5 percent coupon yielded 3.27 percent, about 2 percentage points more than top-rated debt, according to data compiled by Bloomberg. The price has since climbed, pushing the yield down to about 2.8 percent, narrowing the premium over the benchmark to 1.6 percentage points.
The prospect of paying the AMT — which ensures that deductions aren’t used to erase most or all of one’s bill to the Internal Revenue Service — has usually made the bonds less appealing to municipal debt investors, who typically look for tax-free investments with little risk. The AMT, however, has become less likely: It applied to just under 4 million tax returns — or 2.7 percent of the total — in 2013, according to data compiled by the Tax Policy Center. That’s down from as much as 4.3 million in 2011.
The more one earns, the less of a concern the AMT becomes, according to Chan. For those whose income exceeds $1 million, the likelihood drops to just 18 percent, compared with 63 percent in the $200,000-$500,000 bracket.
Nor is the tax risk an issue for investors outside the U.S., who have been stepping up purchases of municipal bonds that offer bigger yields than can be found at home.
Investors are still looking to take advantage of owning more AMT bonds in their portfolios, said Rob Amodeo, head of municipals in New York for Western Asset Management, which oversees about $440 billion.
“If you have a standalone portfolio and understand your clients’ tax status that they’re not subject to AMT and don’t anticipate being subject to it in the future, then absolutely, it’s an opportunity,” he said. “It’s a strategy we’ve been using over the last few years.”
The increased demand from buyers has been a boon for public-works projects by driving down the cost of financing. AMT bond issuance totaled about $16 billion in 2015, and $12 billion has been sold already this year, according to data compiled by Bloomberg. The Massachusetts Port Authority is planning to offer $172 million next week for Boston’s Logan International Airport.
“The country has embarked on large infrastructure projects, which has been reflected in a pickup in AMT bond issuance,” Amodeo said.
Bloomberg Business
by Molly Smith
July 8, 2016 — 2:00 AM PDT Updated on July 8, 2016 — 9:19 AM PDT
The world’s bubble-like bond rally has found its way to the U.S. municipal market.
The price of junk-rated Ohio tobacco debt that may never be paid in full has climbed 14 percent since the start of the year. New York City’s Albert Einstein College of Medicine sold $175 million of unrated securities in January at par for a yield of 5.5 percent. Now, they’re worth 122 cents on the dollar and yield 2.8 percent, according to data compiled by Bloomberg. Even those issued by Puerto Rico, which has been defaulting on a growing share of its debt, have returned 8.4 percent.
“What has changed in the last six months that makes the credit worth more?” said Lyle Fitterer, who oversees $40 billion as head of tax-exempt debt for Wells Capital Management and has been buying higher-rated bonds instead. “I’ll tell you what’s changed: the money flowing into high-yield funds.”
That corner of the $3.7 trillion municipal market, home to bonds backed by hospitals, speculative real estate developments and settlement payments from tobacco companies, has turned into a mad scramble. With interest rates hitting record lows around the world, investors are grasping for anything that promises bigger returns, driving a run up that will leave them at risk if the pendulum swings the other way.
As money poured into municipal mutual funds for the last 39 straight weeks, $8.3 billion — or more than one-third of the total — went to those focused on high-yield securities, according to Lipper US Fund Flows.
As a result, the extra payouts investors demand to compensate for risk has shrunk. Excluding Puerto Rico bonds, the difference in the yields of investment-grade and high-yield munis has narrowed to about 2.7 percentage points, 0.65 percentage point less than the average since 1995, according to Barclays Plc.
Securities that can be bought in blocks of $1 million or more, such as new issues and tobacco debt, are in high demand. When a private consortium borrowed $2.4 billion to finance the redevelopment of LaGuardia Airport’s Central Terminal Building, investors placed 10 times as many orders as bonds available, according to LaGuardia Gateway Partners, the manager of the project. The securities were rated Baa3 by Moody’s Investors Service, one step above junk.
John Miller, who oversees Nuveen Asset Management’s $14 billion high-yield muni fund, said a more accurate gauge of the risk of high-yield securities is to compare them to AAA rated tax-exempt bonds. By that measure, high yield municipals — excluding Puerto Rico — are trading at 2.4 percentage points more than top-rated bonds, or 0.1 percentage point less than the historical average.
“That’s attractive for having already eliminated the most volatile part of the market and the market that has the highest default risk,” said Miller, co-head of fixed income for Nuveen in Chicago. “Outside of Puerto Rico, we’re not seeing real stress.”
Tobacco bonds, which are backed by payments from cigarette companies under a 1998 settlement with 46 U.S. states, have benefited as smokers plowed savings from lower gasoline prices into cigarettes.
Moody’s projects 80 percent of the securities may default, based on historical declines of 3 percent to 4 percent in U.S. smoking. Cigarette shipments, which determine the payouts that states used to fund the debt, increased 1.9 percent last year, the most ever, according to the National Association of Attorneys General.
“That’s a big swing,” said Miller.
Last year’s bump is an anomaly, said Ken Shea, a senior analyst with Bloomberg Intelligence in Skillman, New Jersey. In the first three months of the year, shipments declined 5.5 percent from the previous quarter, according to Management Science Associates, a data and analytics firm.
The muni market is pricing high-yield bonds with the belief that interest rates will stay low for a long period and the economy will grow at a moderate rate, said Wells’s Fitterer.
He said that forecast may not be far off the mark. But with prices already having rallied so much, Fitterer is buying the least risky securities and letting his fund’s high-yield holdings decline as bonds mature. For example, a AA- rated Metropolitan Transportation Authority bond maturing in 2044 is trading at an average yield of 2.3 percent, just 0.5 percentage point less than the unrated Albert Einstein bonds. Einstein forecasts a $62 million loss in 2016, and 60 percent of its revenue comes from grants, contracts and gifts.
“We all know that at some point the markets will turn,” he said. “You have to look at the portfolio and say, ‘Gee, am I getting paid enough to take the incremental credit risk?’”
The indicated yield on Wells’s high-yield fund is 2.79 percent, compared to 6.35 percent for the Oppenheimer Rochester High Yield Municipal Fund, the highest of 40 such funds tracked by Bloomberg.
“We’ve always told people if we don’t see value in high yield we’re going to go where we see the best relative value,” Fitterer said. “If people don’t want to buy my fund, I’m fine with that.”
Bloomberg Business
by Martin Z Braun
July 7, 2016 — 2:00 AM PDT
Taylor Riggs, a contributor to Bloomberg Briefs, talks with reporter Joe Mysak about this week’s municipal market news.
July 7, 2016
The price of security in financial markets keeps rising, and many investors are still paying up.
As investors have flooded into government bonds in recent weeks, pushing yields on the 10-year Treasury note to record intraday lows, they also bought shares of utility companies. Known as bond proxies because they pay relatively high dividends and are considered less risky than other S&P 500 sectors, shares of U.S. power and water providers have climbed 21% in 2016, gaining along with other haven assets like gold.
The run-up has made utility shares more expensive than usual compared with their last 12 months of earnings. The price-to-earnings ratio for utility stocks was roughly 21 on Thursday, compared with a 10-year average of 15 and higher than the S&P 500’s P/E ratio of 18.
It is a reflection of investors’ continued jitters about slowing global growth and the political and economic fallout from the U.K.’s vote to leave the European Union. Utilities were the only S&P 500 sector to rise in the meltdown immediately following the result.
Because utility companies provide critical services to U.S.-based customers, their stocks are relatively isolated from the turmoil overseas, while the recent fall in already-low government bond yields has also made such dividend-paying stocks more attractive in comparison, several analysts and investors said.
A wave of fear in the aftermath of the Brexit vote and an extended period of economic anxiety in 2016 have been more than enough to overwhelm concerns that the stocks are overpriced and suffering from diminishing returns.
“All of those components together lead to a favorable environment for utilities,” said Erik Davidson, chief investment officer at Wells Fargo Private Bank. “And yes, valuations are stretched, but if you look at global bonds, valuations are even more stretched.”
Last year, the sector lagged behind the broader market, falling 8.4% in 2015 as the S&P 500 lost 0.7%.
Utility stocks in the S&P 500 offer a dividend yield of 3.4% according to FactSet, behind only telecommunication stocks. That compares with a yield of 1.492% on the 10-year Treasury note on Thursday.
Government bond yields hit record lows in countries including Germany and Japan after the U.K. vote. Investors’ expectations for a rate increase from the Federal Reserve have fallen precipitously, increasing the appeal of dividend-paying stocks.
Some of the better-performing utility companies this year include American Water Works Co., Inc., which has gained 40%, NiSource Inc., a natural gas and electrical provider that is up 36%, and CenterPoint Energy, which has risen 31%.
There is relative certainty about utilities’ performance and ability to pay dividends, said Mike Barclay, senior equity portfolio manager at Columbia Threadneedle Investments. “When people are looking for yield in a low-rate environment, that’s very attractive. You can sleep a bit at night.”
Other haven assets have also gained considerably this year. Gold is up 25%. Yields on municipal bonds hit historic lows in June. Yields fall as prices rise.
Some investors said that even as low bond yields demonstrate the appeal of relatively safe, income-producing investments, utility stocks have grown very expensive, underscoring the risk of sinking money into stocks that have already shown big gains.
Other assets favored because of their dividends have taken a hit recently. These includes bank stocks, which have fallen amid concerns that low rates will pressure their profits, and energy-focused master limited partnerships, which suffered when oil prices fell.
“Don’t chase income and especially don’t chase it after everyone else has started chasing it,” said Allan Roth, a financial adviser at Wealth Logic in Colorado Springs. “The fact that utilities have gone up so much means it’s an especially poor time to do it.”
While expectations for rising rates have dwindled, utility stocks are expected to suffer if bond yields rise, making debt more competitive with the shares because investors have less need for utilities’ income. Economic growth could also cause investors to rotate to faster-growing sectors, leaving utilities behind.
“If we see growth prevail, we suspect they’ll be less rewarded than other spaces,” said Eric Wiegand, senior portfolio manager at U.S. Bank’s Private Client Reserve.
Still, some investors and analysts said it makes sense to stick with the stocks because there are few alternatives.
“People come in, they hit the switch and they expect the lights to go on,” said Jack Caffrey, equity portfolio manager at J.P. Morgan Private Bank. He has trimmed his utility exposure, but the run-up means he’s still overweight the sector. “You’re not worrying about how a plebiscite in a country 12 hours away is going to do to demand for electricity.”
THE WALL STREET JOURNAL
By AARON KURILOFF
July 1, 2016 2:53 p.m. ET
Write to Aaron Kuriloff at [email protected]
PORTLAND, OREGON — The National League of Cities (NLC), PolicyLink and the Urban Land Institute (ULI) are convening today in Portland, Oregon to launch the first-ever Equitable Economic Development Fellowship. Six cities were chosen to participate in the inaugural year of the fellowship: Boston, Charlotte, Houston, Memphis, Milwaukee, and Minneapolis.
The Equitable Economic Development Fellowship is a two-year, $1 million effort to help equity, transparency, sustainability and community engagement become driving forces in local economic development efforts. During the fellowship, which is generously funded by the Surdna Foundation and the Open Society Foundations, economic development leaders will convene for leadership development, technical assistance, and peer learning. Another class of six cities will be invited to participate in the second year of the program in 2017.
“Historically, many communities have not seen the benefits of local government economic development policies and programs. It isn’t difficult to find examples in cities and states around the country where local governments have particularly shortchanged people of color, immigrants and low-income neighborhoods,” said Jess Zimbabwe, director of the Daniel Rose Center for Public Leadership in Land Use at NLC and ULI. “Some cities are looking for a new path forward, developing creative strategies to jumpstart their economies and to more inclusively invest public dollars.”
While in Portland, each city team will identify a particular equity challenge in economic development to focus on during the course of the fellowship. The cities will receive support and technical assistance from NLC, PolicyLink and ULI, as well as their peer cities, to address the specific diversity and inclusion challenge. While in Portland, the city fellowship teams will also hear from Mayor Charlie Hales and leaders from the Portland Development Commission about the city’s strategies for moving the needle on equity and inclusion.
“It’s important for cities of all shapes and sizes to have economic policies that impact and benefit all of the members of our communities,” said Clarence E. Anthony, CEO and executive director of the National League of Cities (NLC). “This fellowship will bring together six different cities to tackle six different inclusion issues. We are excited to partner with these cities to address these challenges and create solutions that will help lead to a more equitable future.”
“Cities are recognizing that creating equitable and sustainable economic prosperity for all should be the goal of their activities across the board,” said Angela Glover Blackwell, PolicyLink president and CEO. “We are excited to be working with economic development leaders who are eager to integrate an equity approach into their efforts to grow strong local economies.”
“We’re excited about the launch of the new fellowship and its significance in helping us create more livable, vibrant, and economically successful cites,” said ULI Global Chief Executive Officer Patrick L. Phillips. “The involvement of community stakeholders in the economic development process is a key part of creating places that are appealing to residents, visitors and investors.”
“At Surdna, we believe it’s essential that cities develop new approaches to economic development that ensures greater prosperity for all communities. The Equitable Economic Development Fellowship will advance new thinking and best practices that we anticipate will influence the broader field”, said Phil Henderson, president of the Surdna Foundation. “We are truly grateful to partner with the National League of Cities, Urban Land Institute and PolicyLink to launch this ambitious program that will transform economic development practices across the country.”
“All too often, government is challenged in its ability to deliver economic opportunity to the communities that need it most. We are excited about the potential of this fellowship to help bring new ideas and new leaders to the table, and to demonstrate that equity and inclusion can drive economic growth for the many, not just the few,” said Ken Zimmerman, director of US Programs at the Open Society Foundations.
JUNE 28, 2016
A flood of state and local government debt in June wasn’t enough to dampen a rally in the municipal-bond market.
While states and local governments sold $44 billion fixed-rate bonds, more than any month since October 2010, the securities returned 1.6 percent, buoyed by steady investor inflows and a flight to the safest assets amid speculation about impact of the U.K. vote to leave the European Union.
It was the best June performance since 2000 and the market’s biggest advance since January 2015, according to a Bank of America Merrill Lynch index. In a sign of the market’s strength, 30-year yields declined 0.15 percentage point the day after England’s June 23 referendum, slightly more than Treasuries. At 3.18 percent, the Bond Buyer’s 20 Year General Obligation Bond Index is at its lowest since May 1965.
“We’re talking about massive issuance and nevertheless deals have been vastly oversubscribed, at least until now,” said Mikhail Foux, head of municipal strategy at Barclays Plc. “People just can’t get enough despite rates actually falling.”
Historically, June has proven to be a weak time for the local bond market because it has the heaviest supply of new bonds. The Bank of America Merrill index has posted positive returns in the month only three times since 2006.
Macroeconomic forces this year combined to push up prices instead. June began with a disappointing jobs report that showed employment growth was the lowest in five years, weakening the case for the Federal Reserve to raise interest rates. It ended as investors took shelter from the fallout from the so-called Brexit. In between, the Fed’s statement that inflation remains below its 2 percent target stimulated demand for longer-dated bonds.
U.S. state and local-government debt funds have taken in cash for 39 straight weeks, according to Lipper US Fund Flows data, the third longest streak. Even before the U.K.’s vote triggered turmoil in markets worldwide, the funds picked up $1.4 billion in the week ending June 22, the most since January 2013.
Foreign buyers, faced with negative interest rates in their own countries, are contributing to the flood of cash.
With yields at a more than 50-year low, such inflows may be curtailed if investors start looking elsewhere for higher returns, said Matt Dalton, who oversees $5 billion of munis as chief executive officer of Rye Brook, New York-based Belle Haven Investments.
“There’s just not as much meat on the bone,” Dalton said. “When you’re at a low yield level like we are, at some point you just run out of gas.”
The only part of the muni yield curve that has slightly underperformed is the short-end, said Foux.
Investors should add short-dated bonds and hedge them with Treasuries, he said. Short-dated New Jersey general obligation and appropriation-backed bonds and Detroit Public School bonds are attractive as is zero-coupon debt.
In July and August, the strength of the $3.7 trillion market may continue as issuance declines and bondholders reinvest debt payments and proceeds from callable bonds. Nuveen Asset Management forecasts $48 billion will be reinvested in July and $44.5 billion in August, compared with issuance of $39 billion and $37 billion, respectively.
Since the beginning of the year, munis have returned 4.3 percent, or 6.2 percent on a tax-adjusted basis, according to Barclays. That’s better than the 5.4 percent return for Treasuries. The S&P 500 has gained about 2.7 percent.
“All those features in terms of tax exemption, the yield, and negative correlation to equities have attractive characteristics, so they keep putting money to work and that money is coming in globally as well,” said John Miller, co-head of fixed income in Chicago at Nuveen, which oversees $120 billion of munis.
After Brexit, the Fed likely won’t raise interest rates for the rest of the year, eliminating a risk to the value of outstanding fixed-income securities, Miller said.
Meanwhile, a victory by Democrat Hillary Clinton in the presidential election would also support municipal bonds because she would likely raise taxes, increasing the value of the tax exemption, said Foux. Conversely, a Trump victory would hurt.
“For the most part, I see the market being supported near term,” Foux said. “It’s a defensive asset class. It should perform well in times of stress.”
Bloomberg Business
by Martin Z Braun
July 1, 2016 — 2:00 AM PDT Updated on July 1, 2016 — 4:54 AM PDT
U.S. municipal bond and note sales will total just $1.6 billion during next week’s shortened calendar because of the July 4th holiday, compared with nearly $9 billion this week, according to Thomson Reuters estimates.
The biggest deal on the calendar is from the South Carolina Transportation Infrastructure Bank for $204 million of revenue refunding bonds.
Low supply has contributed to strong muni market performance. The 30-year yield on top-rated muni bonds hit another record low on Friday, closing at 1.99 percent, according to Municipal Market Data, a Thomson Reuters unit.
The 10-year yield was 1.34 percent on Friday, just 5 basis points off its the record low of 1.29 percent hit on June 27.
Muni bond issuance levels dropped to $214.5 billion in the first half of 2016, a 0.2 percent decline from the same period last year.
Fri Jul 1, 2016 5:29pm EDT
(Reporting by Hilary Russ; Editing by Dan Grebler)
“Blended” models have the potential to bridge some big gaps in infrastructure finance.
Public-private partnerships are the future of public finance. That little sentence can light a fire in the world of public money, which is struggling to find the wherewithal to pay for infrastructure.
For a while now, public-private partnerships (P3s), which let a private entity handle everything from the development and operation of a public project to its financing, have become a standard option to replace roads, bridges, wastewater treatment facilities and other core infrastructure. Recently, there’s been talk of using P3s for the reimagining of such icons as New York’s Penn Station and LaGuardia Airport, Chicago’s “L” train, and the Los Angeles Convention Center.
It has become increasingly clear that P3s are a badly needed alternative to finance projects. One reason: Many states and localities have reached either the end of their political will to take on more debt or their legal limits on borrowing inexpensive, tax-exempt money. Federal law does not permit the use of tax-exempt bonds on a project if more than 10 percent of the money comes from private sources, which is why projects are usually financed with all public money or all private money.
At the same time, there is concern that P3s are giveaways to the private sector. The pushback centers on a contention that many P3s don’t shift enough of the financial, operational and political risks onto the private sector.
Despite the unease, there is widespread agreement that the private sector can add value. This is especially true for project management and operations. Private partners don’t answer directly to a political process. They can deploy new technology, invest in preventive maintenance, rearrange staffing and bring in new expertise, all without asking permission. Many government infrastructure managers would give anything for that kind of speed and flexibility.
So what’s got public finance folks excited about P3s’ future? Recent attempts to blend the public sector’s access to low-cost, tax-exempt financing with the private sector’s expertise and agility. Three emerging strategies are moving in that direction.
One is to bring nonprofit partners into the mix with the goal of allowing private partners to have financial skin in the game so that they are more excited about managing or operating a piece of public infrastructure.
Here’s how this strategy would work: A government and its private partners structure a P3 around a nonprofit corporation. That nonprofit sells tax-exempt municipal bonds to finance most or all of the project, leases the project back to the government and then uses those lease payments to pay off the bonds. Because it’s a nonprofit, it can also take money from private-sector investors and write contracts with private partners to maintain and operate a project.
The National Development Council claims to have pioneered this “American Model” of P3s. Seattle’s South Lake Union and the Riverside County, Calif., Law Building are good recent examples.
A second strategy is to expand the scope of tax-exempt financing. Under federal law a government can use tax-exempt private activity bonds to finance infrastructure that’s managed by private operators — airports and water-sewer systems, for example. However, federal law also limits the size and scope of the private activity bond market. Expanding the amount of private activity bonds allowed and the types of projects they can finance would expand these joint benefits.
A third is for governments to grow their role as lenders. States have a variety of infrastructure loan programs for local governments. The federal government does the same through Transportation Infrastructure Finance and Innovation Act loans and similar programs. Under some P3 models, private partners can access these programs and use them as loan guarantees against other investments. This can help to leverage enough private investment to make a P3 pencil out. The Move America Act legislation now pending in Congress seeks to boost these types of loan financing tools.
Right now these “blended” P3 models are just a small part of the infrastructure finance landscape. But they have potential to bridge some big gaps.
GOVERNING.COM
BY JUSTIN MARLOWE | JUNE 2016
The governors of Louisiana and New Hampshire recently signed transportation P3 enabling bills into law.
Although the Louisiana Transportation Authority already is permitted to use P3s, Act 519, which was introduced as SB 549, extends this authority to the state’s Department of Transportation and Development.
The law also stipulates that a quarter of all P3 projects the department conducts must be located outside a metropolitan planning area. This subset of projects must be approved by House and Senate transportation, agriculture, forestry, aquaculture and rural development committees.
The law, which took effect June 13, specifically prohibits the department from accepting unsolicited proposals.
The law also sets up a public-private partnership transportation infrastructure oversight commission, whose members are appointed by the governor and other state officials, to review and recommend suitable projects to the commissioner. The commission is required to hold at least one public meeting to solicit feedback on draft requests for proposals, followed by a 30-day comment period.
This is the first law the state has enacted authorizing the use of P3s to procure infrastructure projects.
“Senate Bill 549 will help build innovative public-private partnerships that are critical to moving commuter rail forward,” Gov. Maggie Hassan said in a June 16 statement upon signing the bill. She also expressed dismay over legislature’s refusal to include her proposal to build a commuter rail line from Boston to Nashua and Manchester, N.H., in the 10-year transportation plan. Hassan had previously signed into law a bill authorizing a study to assess the feasibility of using P3s for such projects.
NCPPP
June 30, 2016
A brief historical stat sheet to the municipal ARS, FRN, and VRDO market ending June 2016. In excel format only.
July 1, 2016
DALLAS — Cash-strapped colleges and universities are finding public/private partnerships as an attractive avenue for financing student housing and other campus infrastructure projects, according to Fitch Ratings.
The benefits of a P3 financing include an efficient construction process and less operational risk for the school, Fitch analysts said in a new report on college P3s.
“Recent P3s by some colleges have been able to procure funds more quickly and efficiently than traditional sources while offloading risk to the private sector and preserving colleges’ balance sheets,” said Fitch senior director Seth Lehman, chief analyst on the report.
College campuses are like small cities that provide a number of public services that can generate the revenues sought by private investors, Lehman said.
“It’s not for every university,” Lehman said. “The schools have to be willing to give up some control to the private investors, like the ability to set dormitory fees.”
Higher education P3 ratings are likely to fall within the triple-B category but higher ratings are possible for P3s with robust coverage and little cost risk, he said.
“Strong contractors and sufficient third-party security packages can also result in a higher rating for higher ed P3s” Lehman said.
Large public flagship universities with good credit ratings are less likely to turn to P3 financing than are the smaller schools, according to Lehman.
“The larger schools with good access to the municipal market often don’t see that they can justify it but secondary institutions are less certain to find funds for renovations or other infrastructure needs,” he said.
A $1.14 billion campus expansion project at the University of California at Merced announced in November 2015 could be a model for future higher education P3 projects, Lehman said.
“That’s one that a lot of people are going to be looking at,” he said. “It’s certainly one of the larger ones you’ll see in the higher ed market.”
The UC Merced 2020 Project will be financed with $600 million of University of California revenue bonds that the UC Board of Regents will be asked to approve in July and $157 million of UCMerced funds.
Plenary Properties Merced was selected Wednesday as the winning bidder for the 39-year concession to build and operate almost 1 million square feet of new facilities on the campus located near Yosemite National Park.
Plenary Group, an international infrastructure developer, is the lead partner and equity provider.
The consortium of international financial, engineering, and design partners will contribute $386 million of equity to the four-year construction effort and receive $51 million per year of availability payments for 35 years.
The UC Merced project will include classrooms and housing for 1,700 students as well as recreational areas, dining spots and walkways. Work will begin later this year and be completed by 2020.
The new buildings will feature classrooms and meeting spaces on the ground floors and student residences on the upper levels.
The Merced deal is the largest P3 of its kind in the U.S. higher education sector and the first time that the UC system will use a single private development team for a multiyear, multi-building project, said UC president Janet Napolitano.
The work will be completed nearly twice as fast as a traditional public construction project, she said.
“UC Merced is poised to become a model for our other campuses as we look for the most efficient ways to construct, operate and maintain facilities that enable us to pursue our teaching, research and public service missions,” Napolitano said.
UC Merced is the newest and smallest full-service campus in the UC system, with 6,685 students. The expansion project will provide space for 10,000 students.
The Bond Buyer
By Jim Watts
June 16, 2016
In one of the biggest rallies in recent memory, municipal bonds surged on Friday after Britain voted to leave the European Union.
Yields on some top-rated municipals fell as much as 17 basis points to record low levels. Analysts said the move signaled that yields will remain near all time lows longer than anyone had expected and that negative U.S. interest rates may be on the horizon.
A New York muni trader who has been in the business for over 25 years said that Friday was one of the wildest trading days that he had ever seen.
“The flight to quality was crazy overnight and muni ratios got ridiculous cheap,” the trader said. “We pretty much had two types of buyers who came in and bought. We saw the mutual funds who were getting squeezed because they were getting higher coupons getting redeemed and taken out, which forced them to re-invest at lower yields. When they come in, they chase the market. But on top of that, we saw absolute low yields and attractive relative yields.”
While analysts saw Friday’s trading as just a one-day price movement, they also felt there were longer-term implications looming for the market.
“Today’s rally is an overreaction, no doubt” said Vikram Rai, CFA and head of municipal strategy at Citi. “But there is no doubt that Brexit will mean lower yields for a longer time.”
Rai said Federal Reserve Chair Janet Yellen is very cautious about roiling the financial markets by raising interest rates too early – and that she had waited and bypassed a chance for a June hike in order to study any possible effects of a Brexit yes vote.
Others also saw a cautious Fed ahead.
“With the news, it seems pretty likely you take the Fed off the table now,” said Jim Grabovac, senior portfolio manager at McDonnell Investment Management.
“It is off the table for July [and] unlikely conditions would warrant actions prior to the end of the year,” Grabovac said. “Aside from the near-term shock, over the medium-term I think this will put pressure on rates to remain low and will stay persistent. This could also be seen as a positive for the dollar, and a stronger dollar would pressure U.S. inflation higher.”
Municipal Market Data’s Senior Market Analyst Randy Smolik also said he that a July rate hike by the Fed was probably off the table, but that doesn’t mean the Fed won’t move later in the year.
“There’s no immediate satisfaction,” he said, noting that Britain has up to two years to negotiate a withdrawal from the EU and that a lot could change in that time.
On the buy side, sources stressed both the short- and long-term consequences to the Brexit vote.
“The immediate impact is lower yields and higher dollar prices on most high to medium-quality bonds,” said Michael Pietronico, chief executive officer at Miller Tabak Asset Management in New York City. “We sense 5% coupons will begin to lag as the ultra-high dollar prices will turn retail investors off.”
Pietronico said his firm has long held that negative interest rates were heading to the United States. “We have been vocal on that call for months with our target for this to occur in the second half of 2017,” he said. “If we are wrong on this call it will only be because it happens sooner.
“The United States economy cannot sustain growth with a strong U.S. dollar and the direct consequence of Brexit will be downward pressure on inflation here in America, and a Federal Reserve [that] will no longer even challenge the notion outwardly of raising rates again.”
According to Friday’s final read of Municipal Market Data’s triple-A scale, the yield on 10-year benchmark muni general obligation fell 17 basis points to 1.36% from 1.53% on Thursday, while the 30-year muni yield declined 15 basis points to 2.08% from 2.23%. Both maturities are now at record low levels. At one point during the day, yields were down by as much as 20 basis points.
Markit said the effects from Brexit vote were felt throughout the market early on Friday, with yields on investment-grade bonds tightening 17 to 20 basis points from previous day’s close.
According to Markit’s evaluated bond pricing service (http://www.markit.com/Product/Pricing-Data-Bonds-Municipal), yields on University of California, 5’s of ’46, tightened by 18 basis points.
And the rally was not isolated to top rated-munis, Markit said, adding that yields on lower rated Loma Linda University Medical Center, 5.25’s of 56, tightening 14 basis points as well. Taxable California, 7.6’s of 40, also rallied 10 basis points from previous day’s levels.
Some analysts see a continued demand from buyers of municipal securities.
“The market for munis has been strong and this will only add to the dynamic,” said Dan Heckman, senior fixed-income strategist at U.S. Bank Wealth Management. “I am not surprised the vote went that way, but I was surprised by the margin of Exit; it was a wider win than I thought would occur. What is happening today is a unwinding on the equity side.”
Other market strategists agreed.
“I expect business as usual for munis after the dust of today’s rally settles,” Janney Municipal Strategist Alan Schankel said in an email on Friday. “As low as our rates look (munis and Treasuries), they are still above rates of Euro economies, some of which are negative (Switzerland and Germany).”
George Rusnak, Head of Global Fixed Income at Wells Fargo Wealth Management, saw a fair amount of trading volatility but said that was “both exacerbated and muted by this being a Friday in summertime,” when there is typically less trading being done.
He said he was not seeing the market have any liquidity problems, but added there was a bifurcation in munis, with some buyers gravitating toward a risk off trade while other looking moving into it as a risk on trade.
Munis have done very well so far this year, he said, in terms of mutual bond fund inflows and muni to Treasury ratios.
He said the only fly in the ointment might be that low yields are forcing higher pricing and that issuers might have to change their focus.
“They are running into retail resistance,” he said, adding that there’s a recalibration taking in mindsets, so there may be more issues being priced with lower than 5% coupons.
But most saw strength in munis lasting beyond the day.
“We have lower yields now, but munis are hanging in there,” said Dawn Mangerson, senior portfolio manager at McDonnell Investment Management. “I would say hold onto your munis for a little longer, they are a safe haven and a complement to equities.”
She added that “positive yield is awesome for foreign investors.”
Other analysts agreed.
While there is likely to be global economic uncertainty and global financial-market volatility, Peter Donisanu, global research analyst, and Paul Christopher, head global market strategist at Wells Fargo Investment Institute believe that the domestic impact will be manageable and investors should remain active.
“Outside of limited trade ties, the direct impact around the world is likely to be contained, and we believe that growth in the U.S. economy may slow from 1.9% to 1.7% in 2016,” the team wrote in a June 24 global investment strategy report.
“Systemic risks are likely to remain subdued given significant financial tools available to central bankers and the significant amount of global liquidity available,” the analysts wrote. “We believe that it is important that investors look through the uncertainties related to UK’s upcoming negotiations with the EU and remain fully committed and fully invested in their long-term investment plan,” Donisanu and Christopher added.
There are longer-term effects of the Brexit referendum that should be taken into account as well, strategists said.
Rai saw three possible scenarios. Politically the vote could embolden some political parties in other EU counties to also push for a membership referendum. Economically, the impact could result in slower growth in the Eurozone, he said. Slower growth means lower yields, he said, and that could be good for U.S. Treasuries. Financially, it may mean many banks which had moved headquarters to London may move back to the continent, which might hurt bank profitability.
Heckman also saw a possible political danger
“On the long term, if other countries want to make votes to leave the EU, that would be problematic and create volatility,” said Heckman.
The Brexit vote should bolster and support municipal bond prices, especially with a favorable July and August seasonal period on tap, while the long term implications of the British exit from the EU will take time to evaluate, according to Anthony Valeri of LPL Financial.
“The negative economic implications and lingering uncertainty are positive for municipal prices,” Valeri told The Bond Buyer Friday afternoon. “As is typical during flight-to-safety rallies, munis lag Treasuries but are still enjoying broad-based strength — long-term bonds outperforming intermediate, which in turn is outperforming short-term bonds.”
“Despite a strong start to 2016, I don’t envision recent gains fading soon,” Valeri said.
Overall, Valeri said Brexit should reinforce investor demand for high-quality bonds, however, while a flight-to-safety is underway, he said municipals are unlikely to match the pace of Treasury gains. In addition, he said, central banks are now more bond friendly and the Federal Reserve rate hikes before end of year are highly unlikely.
The Bond Buyer
By Chip Barnett and Aaron Weitzman
June 24, 2016
Christine Albano contributed to this story.
NEW YORK, June 24 (Reuters) – U.S. municipal bond yields blew through previous record lows on Friday as investors snapped up tax-free debt amid a global flight to safety after Britain voted to leave the European Union.
Yields on top-rated munis fell as much as 20 basis points, with movement especially steep in longer maturities, according to a preliminary read of Thomson Reuters’ Municipal Market Data’s (MMD) benchmark scale. Bond prices move inversely to yields.
The $3.7 trillion muni market, most of which is investment-grade tax-exempt debt issued by states and cities, was already on a hot streak with no end in sight, with demand outstripping supply for months.
For 38 straight weeks, investors have poured money into muni bond funds with a net $30.4 billion added year-to-date. The week ended June 22 had the highest inflows in over three years at $1.4 billion, according to Lipper data.
Over the past 12 months, munis have returned 7.03 percent versus 5.18 percent for Treasuries, according to Barclays indices.
The “feeding frenzy” for muni bonds is unabated, said Bank of America Merrill Lynch research strategist Philip Fischer.
“Munis are very strongly bid and we’ve been bullish on the muni market for a long time. We remain bullish,” he said, adding: “We expect we will have another new low in muni rates in the next couple of weeks and we’ll probably get some profit taking then and rates will go back down before the end of the year.”
Low muni yields allow state and local governments to borrow, for infrastructure, school construction and more, and refinance old debt at affordable interest rates.
Yet debt issuance has been low in part because of a lingering austerity mindset among many public officials after the recession prompted painful public sector spending cuts.
Issuance totals $205.5 billion so far this year, a 2 percent drop over the same period in 2015, according to Thomson Reuters data.
Yields hit lows on June 16 for 10-year and 30-year munis, at 1.42 percent and 2.13 percent, respectively, according to MMD.
MMD data goes back to June 1981, when the yield on a AAA-rated 30-year bond was 10.20 percent.
Some have urged caution because even riskier muni bonds are now expensive.
Even so, investors are not likely to rush to cash out, said Dawn Daggy-Mangerson, director of municipal portfolio management at McDonnell Investment Management.
“Munis are a nice place to put your money until things settle down,” she said.
By Hilary Russ
(Reporting by Edward Krudy and Hilary Russ in New York; Additional reporting by Karen Pierog in Chicago; Editing by Daniel Bases and Tom Brown)
Public agencies enter into P3 agreements to reduce a project’s construction and life cycle costs, expedite their completion, and improve their efficiency and reliability. In addition to skills and experience, private developers often count on having the flexibility to use innovative techniques and technologies to help them meet these expectations.
Although more than half of the innovations that are typically incorporated into P3 projects are “incremental,” they can help to shave 30 percent from a project’s costs, especially in transportation and transit projects, a new study indicates.
“Understanding the Effect of P3s on Canadian Infrastructure Projects,” conducted by researchers at the Ryerson Institute for Infrastructure Innovation at Toronto’s Ryerson University, reports the results of a literature review of P3 project documents and interviews with 19 people who were associated with 15 successful Canadian P3 projects.
The researchers found that about 60 percent of the innovations these projects included were relatively modest in scope because timely, cost-effective project delivery, not innovation, are procuring agencies’ top priority. The relatively short time frame developers have to respond to requests for proposals and the tendency of public and private partners to be risk averse also discourage exploratory approaches to project development. As a result, proven rather than experimental technology tends to be proposed and accepted, the study’s authors found.
This finding notwithstanding, many of the requests for proposals Canadian agencies issue encourage developers to propose innovative approaches, although their means of doing so varies. British Columbia and Alberta use very general terminology to attract innovative proposals, for example, while Infrastructure Ontario will issue required or preferred innovation provisions in its RFPs.
The researchers found that the types of new technology or techniques that were introduced, and when, varied by project type. Facility P3s, such as hospitals and court houses were most likely to incorporate innovation in the design rather than construction phase and were often described in the RFP. These new approaches usually involved technological adaptation or changes to respond to the demand for services or to achieve energy or architectural sustainability.
Most innovations in transportation and transit projects, on the other hand, were proposed and implemented after financial close and focused on construction challenges. These changes were often developed to address geotechnical, traffic management and project durability challenges. “This is a good indication that P3s have successfully transferred the construction risk to the private sector,” the researchers wrote.
The authors also provided a glimpse into major innovations interview subjects had introduced in specific P3 projects. These included “compact footprint, building orientation and use of spandrel glass panels” to make a courthouse project more green, installing a pneumatic tube system and automatic guided vehicles to streamline a hospital’s delivery process, and building cut-and-cover tunnels rather than boring them as part of a railway project.
Almost all of the interview subjects agreed that the procuring agencies accepted proposed innovations based on cost and said that far more proposed innovations were rejected than accepted. Approval was based on the proposed innovation’s affordability and ability to enhance performance.
The researchers made several recommendations to public agencies and private developers to encourage innovation and its acceptance in P3 projects. They called on agencies to focus less exclusively on contract compliance and more on addressing the needs a project is intended to address, its preferred functionality, performance and the level of services it is intended to provide.
Private developers were encouraged to focus on projects that involve life cycle development rather than short-term project completion.
The researchers also urged the P3 community to collaborate with universities and applied research centers to spur radical innovation and advised governments to invest in infrastructure research and development.
Finally, they called for more research into innovative ways to finance P3s.
NCPPP
June 23, 2016
Carol Spain, an Associate Director in the States Group out of Chicago, discusses our recently published article “Debt Levels Flatline As US States Prioritize Budget Management Over Investment”.
Jun. 23, 2016
By using data analytics to make decisions about pretrial detention, local governments could find substantial savings while making their communities safer.
Few areas of local government spending present better opportunities for dramatic savings than those that surround pretrial detention. Cities and counties are wasting more than $3 billion a year, and often inducing crime and job loss, by holding the wrong people while they await trial. The problem: Only 10 percent of jurisdictions use risk data analytics when deciding which defendants should be detained.
As a result, dangerous people are out in our communities, while many who could be safely in the community are behind bars. Vast numbers of people accused of petty offenses spend their pretrial detention time jailed alongside hardened convicts, learning from them how to be better criminals.
Ideally, deciding who should stay in jail and who can safely be released would be based on the individual’s risk of not showing up for court and his or her risk of committing a crime while awaiting trial. Instead, the deciding factor is often the defendant’s pocketbook. Those who have the money for bail — including those who are more successful criminals — get out, while the rest remain in jail. Nearly half of Americans don’t have $400 for emergencies; if they get arrested, they are probably going to stay in jail until trial or a guilty plea. The long-term economic impact of incarceration is an earnings drop of 40 percent.
In this era of big data, analytics not only can predict and prevent crime but also can discern who should be diverted from jail to treatment for underlying mental health or substance abuse issues. Avoided costs aggregating in the billions could be better spent on detaining high-risk individuals, more mental health and substance abuse treatment, more police officers and other public safety services.
Jurisdictions that do use data to make pretrial decisions have achieved not only lower costs but also greater fairness and lower crime rates. Washington, D.C., releases 85 percent of defendants awaiting trial. Compared to the national average, those released in D.C. are two and a half times more likely to remain arrest-free and one and a half times as likely to show up for court.
Louisville, Ky., implemented risk-based decision-making using a tool developed by the Laura and John Arnold Foundation and now releases 70 percent of defendants before trial. Those released have turned out to be twice as likely to return to court and to stay arrest-free as those in other jurisdictions. Mesa County, Colo., and Allegheny County, Pa., both have achieved significant savings from reduced jail populations due to data-driven release of low-risk defendants.
Data-driven approaches are beginning to produce benefits not only in the area of pretrial detention but throughout the criminal justice process. Dashboards now in use in a handful of jurisdictions allow not only administrators but also the public to see court waiting times by offender type and to identify and address processing bottlenecks.
Fast-tracking minor cases allowed Tarrant County, Texas, for example, to reduce its jail population by 40 percent; mental-health diversion resulted in $10 million in savings per year in Bexar County, Texas; and New Orleans reduced crime while witnessing a two-thirds decrease in its in jail population by using risk-based pretrial decision-making and turning to summonses rather than detention for low-level offenses such as disturbing the peace and marijuana possession.
Why isn’t every jurisdiction moving toward data-driven criminal justice decision-making? One of us served as a three-term “tough-on-crime” district attorney and the other as a high-ranking state criminal justice official, yet neither of us saw much semblance of a systemic approach. Change that involves multiple stakeholders is hard and requires dedicated leadership. Only a coordinated system can accurately balance community risk and benefit. There will be mistakes. Someone who is released will commit a serious crime. But large-scale pretrial incarceration of minor offenders just creates more crime.
As more jurisdictions realize that what is fiscally responsible is also just, we have the opportunity not only to save money but also to make our communities safer and economically stronger. Data-driven decision-making might not solve all of the challenges of achieving justice, but it’s a good place to start.
GOVERNING.COM
BY STEPHEN GOLDSMITH, JANE WISEMAN | JUNE 22, 2016