Finance


Privatized University Housing: An American P3 Success Story.

While Washington policy experts ponder how best to advance Public-Private Partnerships (P3) as a solution to the underfunding of U.S. infrastructure needs, they should look no further than to colleges and universities for a true American success story.

In recent years, privatized university housing has emerged as an important alternative by which higher education institutions use P3 financing to build new student housing capacity. Since 2010, over 64,000 new beds on more than 100 different campuses across the country have been financed, built and are being maintained by the private sector.

By way of background, P3 is a financing technique that has emerged in Western economies as a way for the private sector to provide public infrastructure. It can take various forms, but in its broadest application involves a private sector sponsor contracting for a fee with a governmental entity to finance, construct, operate, and maintain a given piece of public infrastructure such as a toll road or a bridge that remains under governmental ownership. Proponents point to various private sector efficiencies as one of the technique’s advantages.

The Obama Administration and many in the think tank world are active promoters of P3, and this approach is often positioned as an alternative to the U.S. municipal bond market that historically has provided about 75% of our country’s infrastructure financing. This market is unique to the U.S. and it remains a primary reason that the P3 model has not caught on here with the same speed as it has in other countries. To date, P3 has only provided about 1% of infrastructure financing in the last 25 years.

So why has P3 in the privatized, on-campus university housing sector been so successful? There are unique characteristics of this sector that allow for P3 and the municipal market to work well together and provide a better overall solution than if a transaction was executed purely through one financing technique or the other. Said another way, convergence of the two markets (municipal and P3) delivers a better result.

An overwhelming number of higher education institutions in the U.S. have significant capital improvement and deferred maintenance plans where improvements are necessary not only to replace and restore aging facilities, but also to modernize academic programs and expand capacity. High on the list of needed improvements is student housing, a large portion of which remains dilapidated or outdated.

Unfortunately, most higher education institutions have to operate on lean budgets and, with the nation’s recent economic challenges, support for new capital projects is scarce. As an auxiliary service, student housing often falls low on the list of priorities, taking a back seat to direct education projects. Colleges and universities often have to choose between improving their educational facilities and providing new student housing, making P3 financing an attractive alternative when traditional state funding is unavailable.

Even if state funding is available, the procurement process associated with obtaining such funding can be burdensome and time consuming, often taking years to complete. P3 financing offers an alternative that is usually faster and often more cost effective than the traditional approach, allowing colleges and universities to meet their needs and the needs of their students more immediately.

Under a long standing provision in federal law, tax exempt financing is available for these projects through a 501c3 sponsor, which enters into a tri-party partnership through a long-term ground lease with its university partner, and development and operating agreements with a private sector partner that provides student housing development and management expertise. This is less often the case for other infrastructure sectors and levels the playing field for P3 in terms of the cost of financing as compared to the municipal market for student housing projects.

Additionally, there is a dedicated revenue source to pay for these new student housing rooms–typically, from the parents of students attending the college. Many infrastructure projects often do not have a specified revenue source to repay the related debt. The private sector in a P3 transaction obviously expects to be paid for the financing and other services they are providing and it is helpful to have a readily identified source of that payment in the case of privatized university housing.

As a consequence of this confluence of circumstances, American higher education is often opting to use P3 to deliver expanded housing capacity. It has the low financing cost of the municipal market and the efficiencies of the private sector in terms of development, operations and maintenance with the university transferring this responsibility to the sponsor. Note the final product is also a lot nicer than the dorms many of us Iived-in decades ago when attending college.

One example of many is the Texas A&M University System (“System”). Beginning in 2013, P3 financing was used to finance and construct approximately 4,000 beds of on-campus housing on four separate campuses of the System. The System’s Administration distributed an RFP to pre-qualify developers of student housing. Numerous firms responded, five of which were selected as qualified developers. Subsequently, these five firms competed for each project with specific requirements of design, location, construction, financing, operations and maintenance.

The System partnered with Collegiate Housing Foundation, which is a national 501c3 organization that over the last 17 years has participated in 49 projects in 23 states, to own the facilities, and also partnered with one of the qualified developers for each of the projects.

Those facilities are all now completed and open for operations. Over the next year, the System plans to utilize a similar P3 approach for three additional new construction projects, as well as the acquisition of a fourth.

Washington should be informed by the lessons of this success story. It should expand the availability of tax exempt financing to other infrastructure sectors for state and local government to advance key projects. Until it does, P3 may continue to languish as a financing alternative to the considerable backlog of U.S. infrastructure needs.

The Bond Buyer

By Chris Hamel and Michael Baird

March 7, 2016

Chris Hamel is Head of RBC Capital Markets’ Municipal Finance group.

Michael Baird is a Managing Director overseeing RBC Capital Markets privatized higher education practice.


High-Yield Muni Sector Thrives on Inflows, Low Volatility.

Inflows should remain steady and continue to fuel the municipal high-yield sector, where strong performance, attractive spreads, and low volatility are boosting demand while other fixed income asset classes languish, municipal experts said this week.

At the same time, the sector has also seen the arrival of “fallen angels,” as formerly investment grade credits like Chicago became part of the speculative market, giving investors more options.

With performance thriving and volatility trending lower, heavy demand has pumped cash into high-yield municipal bond funds for the past 22 weeks to extend the sector’s more than two-year recovery, while other fixed-income sectors, like corporate bonds, have sold off.

“Most of the returns are being driven by the income, and the stability is noteworthy this year as well,” John Miller, co-head of fixed income at Nuveen Asset Management told The Bond Buyer on Tuesday.

Municipal high yield mutual funds have three month total returns of 1.65%, year to date of 1.06%, and 4.46%, 3.71%, and 7.22% over one, three, and five years, according to Morningstar data as of Mar. 9.

Excluding Puerto Rico, defaults have been low in the municipal high yield arena, and that has moderated redemptions and boosted demand, according to the Miller, who manages municipal funds with about $20 billion of assets, including a high-yield municipal portfolio.

“There is less of a compelling reason to redeem,” he said.

Despite some spotty selling pressure during individual weeks or months, he said the municipal high-yield sector in general has been on a recovery path since the end of 2013 – and remains on that path.

“2014 was a very strong year, and 2015 was much more of earning your income and coupon and also low volatility, good demand, good liquidity and low default, and 2016 looks a lot like 2015 so far,” Miller said. “Investor inflows to high-yield muni product are consistently positive alongside municipal products in general” so far in 2016, he continued.

Additionally, Miller said while the sector’s low supply pales in comparison to corporate issuance of roughly $1 trillion a year, there are increasing defaults in the corporate bond market and added volatility from its exposure to the low oil prices and oil and gas exploration and production.

The municipal high-yield sector by comparison has less exposure, he said, to the more highly energy-intensive sectors that are affecting the corporate market – even though there isn’t as high a corollary in the municipal market.

Overall, the scenario of strong market technicals should lead to many additional weeks of inflows in the near-term as demand for the product grows under the current positive market conditions, experts said.

Triet Nguyen, managing director and group co-head of NewOak Fundamental Credit, said the technicals for the sector have been bolstered by steady inflows into high-yield municipal funds, though the inflows tapered off last week.

High-yield municipal funds reported inflows of $27.310 million for the week ended March 2, after inflows of $245.834 million the previous week, according to Lipper data. Experts said the inflows probably result from seasonal shifts in assets ahead of the April 15 income tax deadline.

Weekly reporting municipal bond funds attracted $212.25 million in the week ended March 2, after inflows of $696.39 million in the previous week, Lipper said.

Nguyen said scarcity and investors’ growing confidence in the U.S. economic outlook has helped insulate the high-yield municipal market from this year’s sell-off in the corporate bond market.

“Many high-yield names are trading at levels that seem disconnected from the underlying credits,” he said.

For example, Nguyen said corporate-backed municipals in the distressed energy and commodity sectors are at their richest levels in years versus their corporate counterparts.

That has helped price stability on the municipal side, he said.

“On the taxable side, many of the energy-related names are trading at depressed dollar price levels that reflect expectations for an eventual debt restructuring, yet on the muni side the same credits are still trading at a much higher dollar price,” he said.

While rising interest rate fears do have a more direct impact on the municipal market, the Federal Reserve Board’s quarter point increase after more than eight years of its zero-bound target was understated and showed little to any effect on the general or high-yield market. “That is not to suggest that it couldn’t eventually have a big impact,” Miller said, “but it doesn’t appear to be having a big impact just yet.”

The Fed’s rate increase may even have been a catalyst of investment in the municipal high-yield asset class, according to Miller.

“I think people were waiting to get it over with to see what the impact would be – and there weren’t any undue declines out there resulting from that,” he said.

Investor concerns seem to be waning even in a sector that is heavily long-dated. “Although those fears are ever-present, I think they receded a bit, and that is one worry that is less pronounced,” Miller said.

The opportunity to earn attractive average spreads of 250 basis points compared to the generic triple-A market helps offset the sectors’ inherent risks.

Miller said there is value to be had in the health care sector where mergers and acquisitions have been strong and credit upgrades have been more frequent than downgrades lately.

For instance, nonrated bonds for New York’s Albert Einstein Medical Center recently sold with a 5.50% coupon due in 2045 at par, and have traded up since the late January new issue, according to Miller.

In addition, the property tax-backed sector has seen steadily narrowing credit spreads – but yet is still attractive with some credits offering plus-240 basis points to the triple-A scale, down from as high as plus-275, Miller said.

“Underlying that is very steady property tax collections supporting these bonds and making them secure and reliable,” he explained.

Nonrated bonds for the Crystal Crossing Metropolitan District in Colorado recently sold with a 5.25% coupon due in 2040 at par back in January and have also traded up in the secondary market due to the strong market conditions, Miller noted.

Meanwhile, the tobacco sector – a top-performer in the last two years — is also offering value due to some technical and fundamental catalysts, he said.

The sector has been supported by the steady inflows in 2014, 2015, and in 2016, according to Miller, as well as the combination of employment growth and falling oil and gas prices, which contributed to the stabilization and consumption.

He said they are a liquidity management tool that is sensitive to fund flows. “People buy them when they have inflows so they can sell them when they have outflows,” he said.

The most actively-traded tobacco credits are California’s Golden State Tobacco Securitization 5.75% coupons due in 2047, which is was trading at 6.08% yield on Wednesday. The bonds are rated B3 by Moody’s Investors Service and B-minus by Standard & Poor’s.

While these bonds represent the traditional municipal high-profile, the strong performing sector has gone through a bit of a recent transition, as “fallen angel” credits have arrived, expanding the scope and availability of high-yield options.

“While real-estate dependent sectors such as senior living and special assessment districts [dirt bonds] have rebounded along with the housing market, a new source of high-yield supply is coming from traditionally investment-grade sectors, specifically local governmental entities who have never fully recovered from the Great Recession, and are now struggling with the rising burden of unfunded pension liabilities,” Nguyen said.

“School districts from Chicago to Detroit and Philadelphia are paying the price for years of structural deficits which are now brought to a head by budget shortfalls at the state level, and Illinois and Pennsylvania are prime examples of this,” Nguyen continued.

While a lot of high-yield is new projects involving hospitals, schools, roads and bridges, it can also include “fallen angel” credits, so-called because of their recent decline from investment grade ratings due to serious fiscal distress and resulting credit turmoil, Miller said.

While many credits in Chicago remain investment-grade, Chicago general obligation bonds and Chicago Board of Education public school credits lost their investment-grade ratings last year amid the city’s pension woes and severe credit deterioration and their own rocky finances.

Chicago carries a junk-level rating of Ba1 from Moody’s Investors Service, and BBB-plus ratings from both Fitch Ratings and Standard & Poor’s, with negative outlooks.

Spreads on a $500 million GO refunding and restructuring in January offered narrower spread penalties in its first GO deal since approving a large property tax hike.

However, its 2038 maturity with a 4.875% yield still offered 229 basis points over the triple-A benchmark when the deal was priced by Citi Jan. 12.

Even including these new troubled credits into the high-yield municipal universe Miller expects a forecast of lower default activity outside of Puerto Rico to be a supportive of the municipal high-yield sector going forward.

“In a low interest-rates world, an average of 250 basis points of excess return is pretty good, so I think the demand continues to be there,” he said.

“I think we can earn our coupon and plus perhaps a moderate amount of price appreciation if your credit selection pans out favorably,” he added.

The Bond Buyer

By Christine Albano

March 11, 2016


S&P Reports On U.S. Public Finance Bank Loans Evaluated In 2015.

NEW YORK (Standard & Poor’s) March 9, 2016– Standard & Poor’s Ratings Services U.S. Public Finance department said in a report today that in 2015 it evaluated the impact on obligors’ ratings of 126 bank loans totaling $5.16 billion. Of that total, five loans negatively affected the credit quality of Standard & Poor’s-rated parity obligations because of lenient covenants and inadequate liquidity levels to handle potential acceleration events.

The overwhelming majority of bank loans generally haven’t negatively affected U.S. public finance issuers’ credit quality when the financing structures mitigate contingent liquidity risks and where liquidity is sufficient under our criteria, the report says.

The report is titled “S&P Evaluated $5.1 Bil. Of U.S. Public Finance Bank Loans In 2015: Issuers’ Liquidity Positions Helped To Support Ratings.”

Standard & Poor’s continues to stress the importance of loan disclosures in our written analyses and communications with issuers as direct purchase debt is often not subject to disclosure rules like rated securities.

We have determined, based solely on the developments described herein, that no rating actions are currently warranted. Only a rating committee may determine a rating action and, as these developments were not viewed as material to the ratings, neither they nor this report were reviewed by a rating committee.

The report is available to subscribers of RatingsDirect at www.globalcreditportal.com and at www.spcapitaliq.com. If you are not a RatingsDirect subscriber, you may purchase a copy of the report by calling (1) 212-438-7280 or sending an e-mail to [email protected]. Ratings information can also be found on Standard & Poor’s public Web site by using the Ratings search box located in the left column at www.standardandpoors.com. Members of the media may request a copy of this report by contacting the media representative provided.


Moody's Predicts Bright Future for U.S. P3 Market.

Although the U.S. public-private partnership market has been marked by slow growth and fragmentation, it is poised to become one of the world’s largest, predicted Moody’s Investors Service.

“New state and federal P3 resources and political and legislative support, combined with a strong underlying legal framework for contractual enforceability and a deep capital market ready to finance projects,” will help to drive this projected surge in P3s, the credit ratings agency said March 10.

The creation of the Build America Transportation Investment Center (BATIC), which serves as an information and coordination clearinghouse for state and local governments and project sponsors that wish to pursue P3s, is improving the outlook for this market, said Moody’s.

On the other hand, the FAST Act also cuts Transportation Infrastructure Finance and Innovation Act (TIFIA) funding by about 70 percent from 2015 levels although negative effects of this may be blunted by the fact that the law also allows TIFIA to keep uncommitted funds, Moody’s added.

A record number of availability-payment P3 agreements were finalized in 2015, including several that were negotiated by states that had never undertaken such projects, the credit ratings agency noted. Examples include the KentuckyWired broadband P3, the Ohio Portsmouth bypass, Pennsylvania’s Rapid Bridge Replacement Project, and Michigan’s Freeway Lighting Project.

“State-level P3 activity has risen over the last three years and nearly all P3 projects have been completed early or on time,” noted Moody’s Vice President and Senior Analyst John Medina.

However, many government agencies have much to learn about how to negotiate and conduct P3s, he warned.

“The need for more inter- and intra-government P3 best practice sharing remains key for the U.S. P3 market’s long-term development compared to other markets where infrastructure development and funding may be more centrally aligned,” Medina explained.

NCPPP

March 14, 2016


S&P’s Public Finance Podcast: The U.S. Healthcare Sector Outlook.

In this week’s Extra Credit, Managing Director Martin Arrick and Director David Peknay provide an overview of our recent report on the U.S. healthcare industry and our outlook for the segments within the sector, including for-profit and insurance companies.

Listen to the Podcast.

Mar. 11, 2016


The Tools We Need to Measure the Real Value of P3s.

A lot of deals never get off the ground because they appear to be too expensive. But we’re not looking at them the right way.

It’s no surprise that public-private partnerships (P3s) are a hot topic in the United States. Non-traditional approaches to infrastructure financing promise to help fiscally strapped state and local governments increase investment in public infrastructure, something everyone wants to happen.

But how exactly do P3s make good on this promise? Despite popular perceptions, P3s aren’t all about (or even mostly about) lowering construction costs and increasing operational efficiency. The really unique value of P3 arrangements arises from the way they can transfer a specific project funding risk, such as revenue volatility, from local taxpayers to private-sector investors who can bear such risk more efficiently.

“Less fiscal risk, more public infrastructure” is a compelling story. But despite the obvious need for much more investment in public infrastructure, intense interest among public-sector officials, and a huge amount of available private-sector capital, the development and adoption of P3s in the United States has been far slower than expected. Why?

The common theme of failed deals is not hard to find: sticker shock. Risk-transferring P3 transactions appear to be expensive compared to traditional alternatives, which erodes support and makes otherwise-surmountable issues fatal. But it is not substantively correct in many cases. It is actually a problem of measurement. If P3s are to fulfill their promise, we need better tools for measuring the value of what they are expected to deliver.

Risk-transferring P3s appear expensive because the existing ways of describing and evaluating infrastructure financing alternatives (such as the classic “value for money” analysis) focus on expected project-level costs but generally fail to adequately measure the value of funding risk transfer in the public sector’s specific fiscal context.

Such a one-sided analysis is akin to judging an insurance policy by adding up all the expected premium payments but ignoring the policyholder’s specific benefits of avoiding costly outcomes, such as personal bankruptcy, when an unexpected event occurs. Looked at this way, an insurance policy will at best appear to be a bad deal — and at worst an egregious waste of money that calls into question the purpose of the policy in the first place.

Inadequate measures of P3 value also impede risk-transferring product innovation. Despite private-sector infrastructure investors’ ability and motivation to develop innovative financing products, new infrastructure risk-sharing techniques won’t be pursued without a guide to their specific value to the public sector. This is true even where there is an intuitive understanding that risk transfer will be valuable to fiscally constrained governments.

Measuring the value of infrastructure risk transfer is not easy. It involves probabilistic modeling of uncertain factors and their interactions in both complex infrastructure projects and the public sector’s fiscal situation. A lot of data and math is required. But successful precedents in the private sector (most notably in financial portfolio management) show that a probability-based methodology can be the basis for practical and effective tools that could be widely used by real-world decision-makers.

A specialized tool for measuring the value of fiscal risk transfer that is accessible to non-technical users among public-sector decision-makers and stakeholders could directly address the problem that risk-transferring P3 transactions appear unnecessarily costly. With such a tool in place, the focus of P3 proposal development and evaluation would shift to optimizing the (now measurable) value of risk transfer for fiscally constrained governments, leading to faster product innovation, better deal-success ratios and higher levels of investment in public infrastructure.

Such a specialized tool for P3 risk transfer doesn’t exist — but it could. There’s already powerful off-the-shelf software, abundant fiscal data for U.S. state and local governments, and skillful and motivated people on all sides of the P3 equation. The tool should be designed first and foremost to protect the public sector from bad deals — and to do this in a way that is clear and transparent to a broad range of stakeholders. But it also must ensure that genuinely valuable P3 proposals get a fair hearing.

Given the scale of the challenge of improving America’s public infrastructure, developing better ways to correctly evaluate all of the public sector’s options is clearly worth the effort. Measurement of P3 value should be part of the solution, not the problem.

GOVERNING.COM

BY JOHN RYAN | MARCH 11, 2016


GASB Request for Research.

Gil Crain Memorial Research Grant

Since its formation in 1984, the Governmental Accounting Standards Board (GASB) has encouraged academics and other researchers to conduct studies that would be relevant to the GASB’s standards-setting activities. For more than 30 years, such research efforts have resulted in publishing their research in research briefs, journal articles, and occasionally in GASB research reports.

The GASB hopes to encourage more collaborative research efforts with academics by offering two $5,000 research grants, to be awarded by the end of June 2016.

To learn more, click here.


Experts to Convene to Discuss Federal Scoring Solutions.

Restrictive budgetary rules that make it difficult for the federal government to negotiate real estate leases and public-private partnerships will be explored in-depth during NCPPP’s Federal P3 Summit in Washington, D.C.

Federal scoring makes such projects very expensive for agencies to pursue because Appendix B of Circular A-11, issued by the Office of Management and Budget (OMB), treats as a capital lease any lease that ends in government ownership of the developed asset. An agency must record, or “score,” in its budget the entire cost of a capital lease the year the agency enters into it. Operating leases, on the other hand, can be scored year by year, explained Dorothy Robyn, former head of the U.S. General Services Administration’s Public Buildings Service in a Brookings Institution blog.

“OMB and the Congressional Budget Office (CBO) have gradually extended the reach of A-11 to preclude most public-private ventures aimed at financing federal acquisition of capital assets,” noted Robyn.

NCPPP will hold two sessions on federal scoring during the Summit. The first will provide an introduction to the issue and set the stage for the second session during which Robyn and several other experts will discuss the merits of potential solutions and the extent to which they are likely to be implemented.

The introductory session will be moderated by Sandy Hoe, Senior of Counsel at Covington & Burling LLP, and feature:

The second session, “Point/Counterpoint Debate on Federal Budget Scoring Issues,” to be moderated by George Schlossberg, Partner at Kutak Rock LLP, will feature views from Robyn and panelists:

To help develop solutions to the obstacles federal scoring imposes, NCPPP will use the discussions held during these sessions in a federal scoring research project it is conducting with the Urban Land Institute’s (ULI) Public Development Infrastructure Council, which is funding this effort. ULI also will discuss this issue during an expert’s roundtable at its spring meeting.

The Federal P3 Summit will be held March 17-18 at the FHI 360 Conference Center in Washington, D.C. For more information about this event and to register, visit the event website.

NCPPP

By March 4, 2016


MSRB: Muni Trading Volume Continues to Fall in 2015.

WASHINGTON — Municipal bond trading volume fell 13% during 2015 while the overall number of trades remained relatively stable, continuing a pattern that stretches back to 2007, according to data released Thursday by the Municipal Securities Rulemaking Board.

The 2015 level of $2.42 trillion in total par amount of bonds traded was down from about $2.77 trillion the year before and a significant decrease from the peak of $6.7 trillion in 2007. The MSRB’s data for the third quarter of 2015 showed the trading volume was the lowest it has been since at least 2005, when the self-regulator began recording market statistics.

The decrease can mostly be attributed to the continued fall of the total par amount traded for variable rate securities, the board said. The volume of variable rate trades dropped 40% year over year in 2015 while the par amount traded for fixed rate securities grew nearly 5% in 2015 when compared to the year before.

Despite the falling trading volume, the actual number of trades rose in 2015 to about 9.26 million from roughly 8.91 million in 2014. The number of trades has ranged between 8.91 million and about 10.6 million since 2007. The combination of lower trading volume and stable numbers of total trades suggests there has been a drop in average trade size over time.

The data also shows that customer trades, as a part of overall trading volume, has also slipped slightly over the last few years, falling to 77% in 2015 from 84% in 2011. Interdealer trades as a percentage of trading volume, in turn, grew every year during that span, rising to 24% of the volume in 2015 compared to only 16% in 2011.

Puerto Rico bonds and New Jersey transportation bonds topped the most traded bond lists. A Commonwealth of Puerto Rico bond with a 2035 maturity and an 8% coupon led with a trading volume of $7.48 billion in 2015 and a New Jersey State Transportation Fund Authority bond with a 2044 maturity and 4.25% coupon had the most number of trades, at 6,741.

The Fact Book also tracks the number of continuing disclosure documents issuers have submitted over the past few years. Overall disclosures declined about 6% in 2015 from 2014, but are still about 12% higher than they were in 2013, according to the board.

The large spike in disclosures in 2014 coincided with the Securities and Exchange Commission’s introduction of its Municipalities Continuing Disclosure Cooperation initiative in March of that year. The initiative allows issuers and underwriters to get more lenient settlements from the SEC for self-reporting any time during a five-year period that an issuer said it was in compliance with its continuing disclosure obligations, when it was not. Municipal market participants have credited MCDC with improving their continuing disclosure compliance.

While many of the breakdowns explaining the different financial documents that were submitted remained similar between 2014 and 2015, the number of filings to disclose a failure to provide annual financial information decreased 22% to 5,716 from 7,323 the year before.

Many of the document submissions for event notices also stayed relatively similar year over year, but the MSRB data shows there were 21 documents filed to disclose an adverse tax opinion or event affecting tax-exempt status compared to nine in 2014. There were also 33 fewer notices filed because of bankruptcies and receiverships and 53 fewer documents filed because of non-payment related defaults.

The MSRB’s Fact Book is compiled using information dealers and issuers submit throughout the year that is posted on the self-regulator’s EMMA system, the sole repository for required disclosures in the muni market.

THE BOND BUYER

BY JACK CASEY

MAR 3, 2016 3:14pm ET


Pension Fears Cloud U.S. Municipal Debt Market.

On the Boardwalk in Atlantic City, just across from the hot dog stands and thrill rides on the old Steel Pier, sits the Trump Taj Mahal. Opened in 1990, it went bust a year later. Two other casinos carrying the name of Donald Trump went the same way over the following years. The Taj — which failed again in 2014 — was sold last week to Carl Icahn after emerging from bankruptcy protection.

But Mr Trump — the frontrunner in the race for the Republicans’ pick for president — is not the only one to have struggled in this rundown gambling resort in the south of New Jersey. The city itself is on the verge of running out of money, laid low by years of duff investments, plunging property tax receipts and competition from a new crop of casinos across the north-east.

Serious trouble could still be averted. State governor Chris Christie — now a potential running mate for Mr Trump — could come up with a rescue package acceptable to the city before April, which is when cash flows turn negative, on Standard & Poor’s projections. But in the meantime, the fate of the city’s debt is weighing on America’s $3.7tn municipal bond market. Investors know that when it comes to the crunch, pensioners tend to do better than bondholders.

That was the case in Detroit, the biggest ever collapse three years ago, which inflicted losses on holders of its “general obligation” bonds. Such instruments are not attached to any particular stream of revenue but were nonetheless thought to be rock-solid, as they are backed by a full faith and credit pledge and the unlimited taxing authority of the city. Even so, investors in Detroit’s GO bonds took big hits as the city restructured its balance sheet — just as investors in other classes of bond did after the bankruptcies of Stockton, Vallejo and San Bernardino, all within the past few years.

The threat of more battles between retirees and bondholders is bothering Peter Hayes, who oversees $110bn of state and local debt as the head of the municipal bond group at BlackRock, the world’s biggest asset manager. Everyone is anxiously eyeing Chicago’s $20bn unfunded pension liability — in particular, he says, conscious of the mismatch between the short horizon of the typical term of political office and the very long horizon of pension obligations. Time and again, politicians have shown that they’d rather protect voters than investors.

Detroit “set a fairly dangerous precedent” for GO bondholders, he says. “Politics seemed to trump the rule of law.”

Some lobby groups are urging authorities to cut pensions benefits, as persistently low interest rates increase the present value of their future burdens. In Philadelphia, for example, a watchdog has urged the mayor, the city council, the pensions board and union groups to combine to put its $4.8bn pension fund on a firmer footing.

What credit rating agencies want to see from all municipalities is some kind of plan, says Jane Ridley, a senior director in the US public finance team at S&P in New York. It does not particularly matter what the plan looks like, or what kind of assumptions authorities are using. But a plan gives some comfort that they are not simply hoping that the problem goes away.

“Are they aware of it?” she asks. “What do the rising costs look like? What would they need to address over time to meet their obligations?”

Munis remain a haven, amid choppy fixed-income markets. There are still 336 triple-A American municipalities, on S&P’s count, from Acton Town in Massachusetts to Yorba Linda, California — all with solid economies, tight budgets, stable institutions and good liquidity. This week investors digested about $12bn of new issuance across the market, an unusually high amount, without much drama.

Even Chicago is still selling debt at reasonable rates. In January the city sold $500m of GO bonds with a 5 per cent coupon, yielding 229 basis points more than the benchmark rate for the best-rated borrowers. That was less than a 252 bps spread in a similar sale last July, shortly after Moody’s had downgraded the city’s credit rating to junk.

But a triple-C borrower like Atlantic City — which was rated single-A until 2012 — is a reminder of how quickly things can turn.

And when they do, investors are unlikely to emerge with the swagger of a Mr Trump.

“Stop saying I went bankrupt,” he tweeted last June. “I never went bankrupt but like many great business people have used the laws to corporate advantage — smart!”

Financial Times

by Ben McLannahan

Last updated: March 4, 2016 12:42 pm

[email protected]


Chapter 9 – Five Proposals for Meaningful Reform.

When the next recession occurs there probably will be other municipalities in severe fiscal distress that opt to file under chapter 9. Now is a good time for capital market participants to focus on changes to chapter 9 that address the lessons from the most recent round of municipal bankruptcies.

The most significant lesson is that chapter 9 is unclear in many respects such that judges, with little or no municipal experience, have the leverage to achieve settlements often unsatisfactory to the capital markets. Settlements are often agreed to as a means of avoiding the risk of creating bad legal precedent. To address the lack of clarity of chapter 9 and to root it in municipal realities, we suggest the following as the top five critical changes that should be made to protect the capital markets.

1. Restricted Funds Should Be Treated in the Same Manner as Special Revenue

In the municipal world, bonds may be payable from a specified revenue stream that may not be used for any other purpose or that must be used to pay the bonds before being used for any other purpose. The restricted revenue stream is typically deposited into a special fund on behalf of bondholders. Substantively the restricted use serves a similar function as a lien.

An undecided issue in chapter 9 is whether the owners of bonds payable from restricted funds have a property interest in these funds that will be protected in the event of a bankruptcy filing.

This issue was raised but not decided by the court in the Detroit bankruptcy. Chapter 9 should be amended to provide that bonds backed by restricted funds are protected in the same way as special revenue bonds. The same principles apply – the bondholders are taking the risk of a specified revenue stream and this risk should not be impacted by a bankruptcy filing.

2. Intercept Structures Should Be Immune from a Chapter 9 Filing

In municipal finance, bonds are often paid from monies due from a State to a municipality. These monies are intercepted and paid directly to the trustee on behalf of bondholders. A lien is typically not granted on these State payments, but the intent is to provide special protection to bondholders so that these credits are evaluated based on the likelihood of the State payments being made.

An open issue in chapter 9 is whether these State payments are property of the municipality. If they are property of the municipality, the automatic stay applies. This issue was litigated but not decided by the court in the Vallejo bankruptcy. Chapter 9 should be amended to provide that

State aid intercepts are not property of the municipality. This would allow bonds backed by these

State payments to continue to be paid during the bankruptcy case, thereby preserving the basic credit risk intended when these bonds were issued.

3. Special Revenue Bonds Should Not Be Subject to Cram Down

Another unresolved issue in chapter 9 is whether special revenue bonds may be crammed down.

This issue was litigated but not decided in the Detroit bankruptcy.

The cram down provisions allow a secured creditor class to be bound by a plan even if this class

does not vote in favor of the plan so long as at least one impaired class votes for the plan and the secured creditor receives treatment based on the court-determined value of the property securing the debt and/or an adequate rate of interest. A cram down could, therefore, result in the lowering of the principal amount of the bonds or a lowering of the interest rate.

Chapter 9 incorporates the chapter 11 cram down provisions. However, the structure and intent of special revenue bonds is that they not be impacted by a bankruptcy filing. This creates an ambiguity in the Code that should be rectified. Chapter 9 should be amended to provide explicitly that special revenue bonds and bonds payable from restricted funds cannot be crammed down.

4. The `Best Interests of Creditors’ Test Should Be Defined and Rooted in Municipal Realities

In chapter 11, a plan must satisfy the best interests of creditors test by providing each group of creditors, as well as creditors as a whole, with at least as great a recovery as would have occurred in the event of a hypothetical liquidation. The test sets a minimum bar for class and aggregate creditor recoveries.

Because municipalities cannot liquidate, the chapter 11 liquidation test does not work in a chapter 9. Consequently, courts have compared plan recoveries with recoveries that would have occurred in the event the case were hypothetically dismissed. But in doing so, several courts have held that a dismissal would lead to a death spiral, and therefore invariably conclude that the best interests of creditors test has been satisfied no matter what the level of class and aggregate recoveries. This interpretation of the test renders it ineffective to protect creditors.

To address this inadequacy, chapter 9 should be amended to provide that the best interests of creditors test means:

A. Since in any dismissal certain claims would have stronger legal rights under State law, a plan must provide that any unsecured class that benefits from a state constitutional or statutory provision requiring superior payment of such obligations will be treated materially better than other unsecured claims. Superior claims would include (i) general obligation bonds backed by full faith and credit with no statutory limit on the ability to raise taxes to provide payment, (ii) pension payments with constitutional protections requiring payment under all circumstances, and (iii) obligations provided with an explicit constitutional or statutory first priority of payment.

B. In order to maximize aggregate creditor recoveries in a manner reasonable under the circumstances, a plan must provide that (i) the number of municipal employees, as well as their salaries and benefits, are comparable to those in municipalities of similar size, wealth and geographic area, (ii) taxes are raised as high as possible without causing a counterproductive economic impact, and (iii) the municipality maximizes the value of assets used for a proprietary rather than a public purpose, including monetizing such assets.

5. The Unfair Discrimination Test Should be Objective and Straightforward

Similarly situated classes of creditors may be treated materially differently only if there is no unfair discrimination. Courts have varied in their views of the meaning of unfair discrimination.

The court in Detroit held that discrimination is not unfair so long as the disparity does not violate the moral conscience of the court. This standard is totally subjective.

Chapter 9 should be amended to provide for an objective definition of unfair discrimination.

Materially different treatment between similarly situated classes should be considered fair only if either:

A. The class provided the better treatment has contributed equivalent new value to the municipality.

B. State law provides for materially better treatment for the class receiving the superior treatment.

This definition would be objective and similar to that used by many courts in chapter 11. The definition would provide a continuity of expectation based on State constitutional and statutory provisions designed to protect designated creditors.

These five proposed changes to chapter 9 would clarify the treatment of creditors and provide clearer guidance for the expectations of market participants. All of the changes are consistent with basic principles of municipal finance and should be integrated into chapter 9.

THE BOND BUYER

DAVID DUBROW

MAR 3, 2016 10:49am ET

David Dubrow is a partner at Arent Fox LLP in New York.


State-By-State Trends In U.S. Public Finance, 2015.

While upgrades far outnumbered downgrades in U.S. public finance (USPF) in 2015, the positive movement was not spread equally across the country. Some states experienced significant upward movement, while others saw more downgrades, and the reasons for the rating changes in 2015 varied. These same patterns could repeat in 2016, but changes in the economic environment of certain states could alter the reasons for rating changes and the general trend in rating movement. (Watch the related CreditMatters TV segment titled, “Why U.S. Public Finance Rating Trends Could Vary By State This Year,” dated March 2, 2016.)

Overview

Continue reading.

02-Mar-2016


BlackRock, Citi Say Buy Munis as Yields Climb From 50-Year Low.

Just weeks removed from the lowest municipal-bond yields in 50 years, BlackRock Inc. and Citigroup Inc. are imploring investors to buy.

Their recommendation stems from a confluence of factors, ranging from depressed yield levels worldwide to an imbalance of supply and demand in the $3.7 trillion municipal market. Though 10-year yields have climbed in March in six of the past seven years, now might be the best chance to buy tax-exempt debt, according to Vikram Rai, head of muni strategy at Citigroup in New York.

“This year, we expect that the cheapness could be relatively short-lived and we strongly recommend that investors utilize this temporary cheapness as buying opportunities before yields plummet again,” Rai said in a Feb. 29 report. “This is not the time to sit on the sidelines.”

Fixed-income investors have had to re-calibrate their expectations in 2016 as China’s economic slowdown and plunging oil prices have buffeted global equity markets, spurring demand for the safest assets. In the U.S., yields have plunged even though the Federal Reserve raised its target for the first time since 2006. That’s made muni buyers wary of calling a bottom to rates.

BlackRock, the world’s largest money manager, shares Citi’s view of taking advantage of increased yields.

Supply is building in the coming weeks, making it tougher for states and cities to borrow at current levels. They may have to offer investors better deals.

“Seasonal weakness, when we see that, is often a good opportunity to buy at better value, so look for that coming up in the near-term,” said Peter Hayes, who oversees $110 billion of state and local debt as the head of BlackRock’s muni group.

Here are four charts that show what BlackRock and Citi see in the market.

Absolute Advantage

Benchmark 10-year muni yields have climbed from near-record lows, making them more appealing to fixed-income investors. At 1.76 percent, the Bloomberg index is the highest since January and up 0.2 percentage point from Feb. 11.

Before the yield increase, some individual investors were in “rate shock,” Rai said.

“It’s really nothing more than the market hitting resistance,” said Sean Carney, head of muni strategy at BlackRock. “It’s a pullback in a market that has come a long way and is going to assess the next move.”

Supply Glut

An increase in municipal-bond supply gave investors the opportunity to be more picky in their purchases, leading to higher yields. Long-term fixed-rate issuance reached $9.8 billion in the week through Feb. 26, the highest since November, data compiled by Bloomberg show.

“Some of the more recent deals have been met with a little bit more resistance,” Hayes said. “Supply is likely to pick up — especially given the fact that rates are so low.”

Crowded Market

State and local governments have scheduled about $15 billion of bond sales in the next 30 days, the largest slate since November, Bloomberg data show. The figure tends to underestimate the amount of offerings because some are announced just days in advance.

That’s a trend muni investors usually encounter. Issuance in March has exceeded that in January and February each year since 2012, Bloomberg data show. That contributes to benchmark yields typically increasing during the month.

What could offset that this year is if non-traditional muni investors consider the bonds with global yields near record lows, Rai said. While corporate debt seems cheap to state and local securities, munis benefit from the flight to safe assets that has pushed U.S. Treasury yields lower and 10-year debt from Japan and Switzerland to below-zero rates.
Relatively Cheap

The 1.76 percent yield on benchmark 10-year munis compares with 1.75 percent on similar-maturity Treasuries, Bloomberg data show. The ratio is a measure of relative value between the asset classes. It climbed to 101 percent on Monday, the highest since October, signaling that tax-free bonds are cheap relative to their federal counterparts.

Investors who don’t benefit from tax-exempt interest will occasionally cross over and add munis when their absolute yields increase. Over the past 10 years, the ratio has averaged 97.6 percent.
For an individual in the top federal income-tax bracket, the muni yield is equivalent to 3.1 percent on taxable securities.

Munis overall have returned 1.2 percent this year, compared with 3.2 percent for Treasuries, Bank of America Merrill Lynch data show. For tax-exempt debt, coupon payments have driven most of the gains, rather than a jump in bond prices.

The underperformance to Treasuries hasn’t yet turned muni mutual fund flows negative. Rather, they’ve seen money pour in for 21 straight weeks, the longest stretch since December 2014, Lipper US Fund Flows data show.

“We’re going to tend to underperform when rates fall, as they’re doing now, particularly in this flight to quality we’re seeing in U.S. rates,” Hayes said. “But when rates do rise, we tend to outperform.”

Bloomberg Business

by Brian Chappatta

February 29, 2016 — 9:00 PM PST Updated on March 1, 2016 — 5:48 AM PST


States Losing Ability to Borrow at Record Lows as Issuance Rises.

States from California to Massachusetts are paying the highest premiums in three months when selling bonds as a flurry of tax-exempt debt issuance is met with slowing inflows into municipal mutual funds.

Municipal issuers plan to sell $10.6 billion of long-term fixed-rate debt this week, more than any five-day period since Nov. 16, data compiled by Bloomberg show. Massachusetts sold $1.1 billion Thursday, in the second-biggest deal of the week.

“When the new issue guys start making calls, they don’t get as a receptive of a phone call as when the market’s running hot and when the funds are getting a ton of cash,” said Matt Dalton, chief executive officer of Rye Brook, New York-based Belle Haven Investments, which oversees $4 billion of municipal bonds.

The spread, or extra yield, investors demand on Massachusetts debt above AAA rated bonds is 0.22 percentage point, or 0.065 percentage point more than the three-month average, according to data compiled by Bloomberg. Last week, California spreads reached a three-month high of 0.31 percentage point.

Yield premiums on state general-obligation bonds are rising as investors pay closer attention to growing pension deficits and retiree health care liabilities, according to Bob DiMella, co-head of MacKay Municipal Managers at the investment advisory firm MacKay Shields LLC.

U.S. state pensions had 74 percent of assets required to meet obligations to retirees in fiscal 2015, down from 77 percent in the prior year, Wilshire Consulting said Tuesday. On top of that, new government accounting standards may reveal that state and local governments that previously addressed pension funding still face risks or remain underfunded.

Negative Outlook

Massachusetts, which ranks second behind Connecticut for the highest per capita income, had its credit-rating outlook changed to negative by Standard & Poor’s in November because the state was drawing down reserves even as the economy was recovering from the Great Recession. Reserves have declined as spending has outpaced revenue. S&P rates Massachusetts’ general obligation bonds AA+, the second-highest investment grade.

Massachusetts is projecting reserves of $1.35 billion for the fiscal year ending June 30, about $220 million less than the previous year, according to S&P. The state has also suspended transfers of excess capital gains tax revenue to a budget stabilization fund.

“In general, we expect states to set aside during good times, extra revenues into a budget stabilization fund for use during the downturn,” said S&P analyst David Hitchcock “The concern is here, they’re having strong growth in revenue and they’re not building up reserves for the bad times.”

Fund Flows

In February, municipal bond mutual funds netted $4.8 billion, a $200 million decline from the previous month, according to Lipper US Fund Flow data. Money has flowed to muni mutual funds for 21 straight weeks.
“Over the month of February that money has been placed so things are slowing down a little bit, which has caused spreads to widen,” Dalton said. “There’s still cash and cash is still coming in, but it’s not piling up like it was,” Dalton said.

In a Wednesday order period for individual investors, Massachusetts sold at least $160 million of the bonds, said Assistant Treasurer Sue Perez. The commonwealth was expecting retail orders of $120 million to $150 million, she said.

The higher premiums were reflected in the prices set Thursday after mutual funds and other big buyers submitted orders. The 10-year bonds were sold for yields of 2.08 percent, or 0.32 percentage point more than top-rated bonds with the same maturity, according to data compiled by Bloomberg. Thirty-year callable bonds were priced to yield 3.02 percent.

Supply next will be lighter than initially anticipated, she said. As of Wednesday, states and local governments plan $6.4 billion in long-term bond sales, according to data compiled by Bloomberg.

“That may actually work to our favor,” said Perez.

Massachusetts Governor Charlie Baker, a Republican, proposed a $39.6 billion budget in January that deposits $206 million of excess capital gains tax revenue into the budget stabilization fund, a positive development, according to S&P. The amount is $150 million less than the $356 million that would have been deposited under a state formula.

“It wouldn’t be the full amount but it would be at least an increase that they haven’t seen for three years,” Hitchcock said.

Massachusetts’ economy, anchored by higher education, health-care and technology sectors, is performing better than the nation as a whole. The state’s unemployment rate was 4.7 percent in 2015 compared with 5 percent for the U.S.

Even so, the commonwealth is burdened by a growing debt service and pension costs. The pension fund had 61 percent of assets required to meet obligations to retirees in 2015 compared with 78.6 percent in 2008, according to S&P.

Bloomberg Business

by Martin Z Braun

March 2, 2016 — 9:00 PM PST Updated on March 3, 2016 — 11:59 AM PST


Bloomberg Brief Weekly Video - 03/03

Taylor Riggs, a contributor to Bloomberg Briefs, talks with reporter Joe Mysak about this week’s municipal market news.

Watch the video.

March 3, 2016


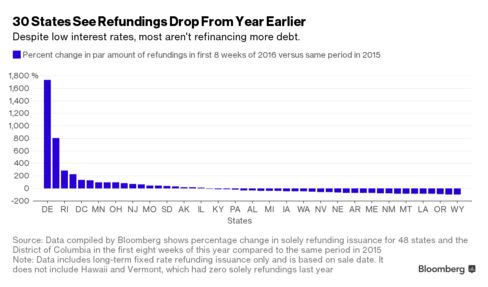
Municipalities Risk Missing Refinancing Window as Issuance Slows.

State and local governments in 30 U.S. states borrowed less for the sole purpose of replacing higher-cost debt than they did during the same period in 2015, causing them to miss out on an unexpected persistence of cheap money that may not last. They were slow to take advantage of interest rates that touched five-decade lows in February amid volatility in financial markets, only to edge back up as stocks rallied.


“2016 has produced something of a surprise for a lot of bankers, and I think it takes a while to crank up the machinery to do the refundings,” said James Dearborn, who oversees $29.5 billion as head of municipal bonds in Boston at Columbia Threadneedle Investments. “Maybe what we’re seeing is just that delay from the outset of the year.”

Local governments raced to refinance last year before the Federal Reserve increased borrowing costs for the first time since 2006, easing away from the near zero interest rates that had been in place since the worst of the credit crisis. After the Fed’s initial jump in December, turmoil in the global equity and credit markets has dashed most forecasts for higher rates this year. Investors now project a 10 percent probability the central bank will tighten monetary policy at its March 16 meeting, down from 50 percent at the end of 2015, according to pricing in interest-rate futures markets.

The slowdown in bond sales follows a years-long push by states and cities to cut costs because of the financial effects of the recession, which left officials hesitant to run up new debts. As a result, the $3.7 trillion municipal market is smaller than it was at the end of 2010, according to Fed data.


While issuance climbed in the first eight months of 2015, bond sales dropped each month since November compared with a year earlier, according to data compiled by Bloomberg. Municipalities sold about $27 billion of bonds for the sole purpose of refinancing during the first eight weeks of this year, compared with about $32.5 billion at the start of 2015, according to data compiled by Bloomberg.

There are about $15 billion of bond sales scheduled over the next 30 days, the most since November, Bloomberg data show. The actual amount may be even higher as some deals are made public only days ahead of time. The governments may have missed out on the best time to borrow: Yields on top-rated 10-year bonds have climbed to 1.77 percent from as little as 1.57 percent on Feb. 11, according to Bloomberg indexes.


Analysts and investors predict that the pace may pick up. Phil Fischer, head of municipal research at Bank of America Merrill Lynch, forecasts that there will be about $440 billion of municipal bonds issued this year, up from about $403 billion in 2015.

“We’re expecting a pretty hefty year of issuance,” Fischer said. “We’ve got more bonds to issue and rates are even lower now than they were last year.”

Issuance should be higher now, given how low rates are and the demand from investors for new securities, according to Dan Solender, head of municipals at in Jersey City, New Jersey for Lord Abbett & Co., which manages $18 billion of the debt.

“Going forward, if it’s in the money to do the refunding, you’d expect them to happen because the demand is pretty strong in the market,” he said. “And there’s plenty of room for more supply.”

Bloomberg Business

by Elizabeth Campbell

March 1, 2016 — 9:01 PM PST Updated on March 2, 2016 — 5:47 AM PST


Buying Cigarettes With Gas Money Keeps Tobacco-Bond Rally Aflame.

Lower-for-longer oil prices might mean higher-for-longer prices on municipal tobacco bonds.

Tobacco securities, which are repaid from legal-settlement money that states and localities receive from cigarette companies, have been a top-performer over the past two years. That’s because — for the first time in a decade — Americans aren’t giving up smoking. Instead, as gasoline costs plummet to the lowest level since 2009 along with oil prices, they’re spending their savings on cigarettes. And the more the companies sell, the more governments get.

High-yield tobacco debt has gained 2.8 percent in 2016, compared with 1.5 percent for all speculative-grade obligations and 1.1 percent for munis as a whole, Barclays Plc data show. Some securities are at the highest prices since 2013 after the segment of the market posted double-digit returns in each of the last two years.

“One of the benefits of low energy prices is when people go and buy their cigarettes, instead of getting the no-frills brand, they can actually buy the major manufacturers, which is good for our tobacco bonds,” said Jim Schwartz, the head municipal credit analyst at BlackRock Inc., which oversees $110 billion of state and local debt.

Across the U.S. tobacco industry, cigarette shipment volumes were little changed in 2015 compared with a year earlier, according to regulatory filings from Reynolds American Inc. The company, along with Lorillard Inc. and Philip Morris USA, agreed in a 1998 settlement to make annual payments to states in perpetuity to settle liabilities for health-care costs tied to smoking.

Reynolds, the maker of Camel and Pall Mall cigarettes, shook up the tobacco industry last year when it paid $25 billion to acquire Lorillard, whose biggest product is the Newport menthol line. With the new brand, Reynolds’s shipment volume grew 17 percent year-over-year. In a conference call, Debra Crew, president of R.J. Reynolds Tobacco, cited lower gasoline prices as a reason for higher sales.

The resilience of cigarette purchases is a departure from the trend over the past decade, when tobacco companies saw demand decline in the face of anti-smoking campaigns, higher taxes and the growth of e-cigarettes. From 2007 to 2014, shipments fell an average of 4.7 percent annually, according to the National Association of Attorneys General. The 0.1 percent decline last year was the least since 2006.

Tobacco debt has rarely had a bad day in 2016, gaining in 32 of 41 trading sessions, according to data from S&P Dow Jones Indices.

“The market is catching up to how large of an impact near-term consumption declines can have to long-term bond valuations,” said David Hammer, who oversees about $40 billion as co-head of the muni portfolio team at Pacific Investment Management Co.

The largest single tobacco bond, a Ohio obligation with a June 2047 maturity, climbed to an average 90.4 cents on the dollar on March 1, the highest since May 2013, data compiled by Bloomberg show. That’s equivalent to a 6.6 percent tax-free yield. The debt is rated six steps below investment grade by Moody’s Investors Service and Standard & Poor’s.

Most tobacco securities are considered junk because when governments first sold them more than a decade ago to get advances on their legal settlements, they didn’t anticipate how quickly Americans would give up smoking. Moody’s projects that a 4 percent annual decline in cigarette shipments would cause 80 percent of the bonds to default.

“We continue to use a more severe consumption decline scenario than what we’ve experienced historically as our base case,” said Hammer, whose high-yield municipal fund has outperformed 99 percent of peers in the past year. The top three holdings are tobacco securities. “But we have acknowledged the recent trend that consumption declines have slowed, which makes a big difference on tobacco bonds as a whole.”

The bonds are different than most in the $3.7 trillion municipal market because they’ll continue to pay in perpetuity, even if there’s not enough money to make full payments and they default. Tobacco securities are also among the most frequently traded because sometimes taxable buyers will step in and purchase the obligations if they get too cheap.

That probably hasn’t been the case lately, because the taxable high-yield market has been dragged down by energy companies, making corporate debt cheap relative to municipal tobacco bonds.

“If you’re a corporate high-yield buyer, it’s the most expensive you’ve seen them since the financial crisis,” said Guy Davidson, director of municipal fixed-income in New York at AllianceBernstein Holding LP, which oversees about $32 billion of state and local debt. “I’d bet most of the buyers in the last year have been muni buyers and the sellers have been largely taxable ones.”

With Puerto Rico tied up in a restructuring battle, speculative-grade muni investors have few alternatives to buy, meaning tobacco bonds could continue to climb, Davidson said. He helps run a $2.3 billion high-yield fund that has four of its five largest holdings in tobacco. It beat 95 percent of peers in the past year.

Individuals have poured money into high-yield municipal funds for 21 straight weeks, adding $4.2 billion over the period, Lipper US Fund Flows data show.

It also helps that gasoline remains below $2 a gallon and the national unemployment rate is the lowest since February 2008. Neither metric shows signs of changing soon.

“People have more money in their pockets and they seem to be buying cigarettes,” Davidson said. “We think tobacco bonds are still attractive. We wouldn’t underweight them, even though they’ve had a good run.”

Bloomberg Business

by Brian Chappatta

March 3, 2016 — 9:01 PM PST Updated on March 4, 2016 — 4:48 AM PST


Fitch: January Air Traffic Should Lift Most U.S. Airports.

Fitch Ratings-New York-02 March 2016: US airports will likely see benefits from the continued increases in air traffic that were indicated by January’s air traffic results, Fitch Ratings says. However, even with solid overall growth that follows 2015’s impressive gains, a few air carriers are lagging the others, which may cause their shared hubs to underperform compared with other US airports. We expect some of the carriers’ key airports to be at some near-term risk to maintain their recent growth given their relative tightness in expanding carrier capacity as well as capital development at their respective terminals and airfields.

The five largest US airlines reported that their January traffic and capacity numbers rose despite a northeast blizzard that cancelled an estimated 10,000 flights and closed airports from the Carolinas through New England. The median traffic growth rate rose 3.7% compared with January 2015.

In our view, January traffic numbers can be a leading indicator of annual momentum. Both economic conditions and carrier profitability can cause some deviation. Fitch expects 3.0%-3.5% passenger growth at US airports in 2016, following a nearly 5% gain in 2015. We expect major market airports to lead while performance at smaller airports and secondary hubs will see mixed results.

JetBlue and Southwest Airlines reported top growth consistent with prior periods, indicating that airports like Logan International Airport in Boston, Orlando International Airport, Fort Lauderdale-Hollywood International Airport and Tampa international Airport will benefit.

In contrast, growth at United Airlines and American Airlines was lower than that of the other major carriers in January, as it was in all of 2014 and 2015. Chicago O’Hare International Airport is unique in that it is a big hub for both carriers but is benefiting from infrastructure investments at the airfield to limit delays, increasing its attractiveness to travelers. O’Hare has other carriers serving the market that should help it rise to even higher levels this year. Newark Liberty International Airport, George Bush Intercontinental Airport, Dallas/Fort Worth International Airport and Charlotte Douglas International Airport also have United and American near their top.


Fitch: Flint, Chicago Lead Lawsuits Pressure Water Sector.

Fitch Ratings-New York-04 March 2016: Lawsuits filed against the city of Flint, MI and the city of Chicago could have a broad, long-term impact on the entire US water sector, Fitch Ratings says. Utilities are stepping up education efforts to bolster public confidence while also evaluating their existing treatment protocols to ensure ongoing water quality. Significant investment in service line replacement also may be forthcoming over the near term, particularly if the Environmental Protection Agency materially alters existing rules.

Various lawsuits filed against Flint and certain government officials allege that the water residents were using was unsafe. The city had changed water sources and the lawsuits state that the newer source had higher corrosive properties that eroded the pipes, leading to highly elevated lead levels in the water. Separately, certain Chicago residents filed suit against the city within the last several days alleging that repairs by Chicago to its water system allowed dangerous levels of lead to enter the drinking water supply and that the city did not sufficiently notify residents that they may have been exposed.

The EPA currently regulates drinking water exposure to lead based on its Lead and Copper Rule, which seeks to minimize lead in drinking water primarily through corrosion control of lead pipes. If corrosion control is not effective the rule can require water quality monitoring and treatment, corrosion control treatment, the removal of lead lines and public education. The EPA is considering strengthening the rule sometime later this year or next. In light of these lawsuits and the heightened public focus on possible lead contamination, Fitch expects any proposed rule revisions will likely move the industry toward removing all lead service lines.

Reprioritizing and accelerating lead pipe replacement would add significant additional capital needs to the sector and could compete with other critical infrastructure projects, including developing sufficient long-term water supplies and replacing aging infrastructure components other than lead lines. Some sources estimate over 6 million lead service lines exist across the US. Many of these are located in the Northeast, Midwest and older urban areas. We believe the capital costs to replace these lines could exceed $275 billion. The EPA’s latest survey estimated the entire sector needs $385 billion in water infrastructure improvements through 2030 and this estimate includes the costs to only partially replace lead pipes. Either level of capital cost would likely be manageable for the sector as a whole if it is spread out over a time frame like the one in the EPA survey. However, implementation over a shorter time span may create stress for individual credits.


RFC: GASB Research Projects.

Every year, the Governmental Accounting Standards Board (GASB) reaches out to poll Governmental Accounting Standards Advisory Council (GASAC) members (e.g., NFMA) about prioritizing their large volume of research projects.

NFMA gets to select six high priority and six medium priority research projects from the list on Attachment D.  A description of each GASB research project is in Attachment A.

If you wish to submit your vote for any GASB research project as a high/medium priority project, email your choice to Gil Southwell at [email protected] by 3/25/2016.

National Federation of Municipal Analysts


S&P: Rating Structurally Enhanced Debt Issued By Regulated Utilities And Transportation Infrastructure Businesses.

1. Standard & Poor’s Ratings Services is updating its criteria for assigning issue credit ratings to structurally enhanced debt (SED) issued by regulated utilities and transportation infrastructure businesses. This update follows our “Request for Comment: Rating Structurally Enhanced Debt Issued By Regulated Utilities And Transportation Infrastructure Businesses,” published on Feb. 27, 2015. These criteria are related to the criteria “Methodology: Holding Companies That Own Corporate Securitizations And Structurally Enhanced Debt Transactions,” published on Feb. 24, 2016.

2. We define SED as debt that 1) is issued by a financing group that is delinked from its parent company (see chart 2), and 2) includes structural enhancements designed to reduce the likelihood that the financing group (including the related operating company) may default. For an operating company that experiences a moderate degree of underperformance, the enhancements provide a set credit remedy period (see glossary of terms) during which the company can take steps to stabilize its credit quality, or creditors can sell the company’s shares while it retains significant value. SED structures lack postinsolvency protection, unlike structures such as corporate securitizations.

3. The criteria partially supersede our “Methodology For Considering Pre-Insolvency Structural Protections In Europe,” published on Dec. 13, 2012, on RatingsDirect. It relates to the more general criteria articles “Principles Of Credit Ratings” published on Feb. 16, 2011, and “Corporate Methodology,” published on Nov. 19, 2013. The criteria explain how Standard & Poor’s applies its corporate methodology to SED and analyzes its specific features.

Continue reading.

24-Feb-2016


Finding the Express Lane to a Successful P3.

Managed-lane projects are springing up all over. There are some key considerations to making public-private partnerships work for them.

Even with the enactment in December of the new five-year federal transportation law, the Highway Trust Fund will remain underfunded to meet our needs as many heavily travelled corridors continue to deteriorate at a rapid pace. Public authorities will continue to look for new ways to manage highway congestion, make the best use of limited capacity, and pay for rehabilitation and expansion of existing roadway infrastructure.

“Managed lane” projects refer to toll roads where the rates motorists pay vary depending on the level of traffic: the more traffic, the higher the tolls. Drivers choose to either pay the tolls or stay in the adjacent free lanes. Public-private partnerships (P3s) have become an important tool to help meet many of these projects’ technical and financial challenges. But P3s have challenges of their own that sponsors of these kinds of projects will need to deal with.

A dozen managed-lane P3s have emerged across the country — including projects in Colorado, Florida, North Carolina and Texas — since the first one, the Capital Beltway Express Lanes project in northern Virginia, got underway in 2008, and several other jurisdictions are contemplating the use of P3s to deliver managed-lane projects.

Managed-lane projects are technically demanding, as they typically involve building or reconstructing busy highway corridors in densely-populated urban centers. They are also complicated in that they can require integration of active traffic management, variable-rate tolling, high occupancy vehicle enforcement and transit vehicles — or a blend of these — to improve overall traffic flow. These projects not only include the construction of new lanes but also the conversion of existing free or HOV lanes.

Historically, variations of the managed-lane concept have been attempted using conventional design-bid-build procurements financed with traditional techniques, such as tax-exempt bonds or toll revenue bonds, and paid for with associated toll revenues. Even using these conventional, well-understood project delivery methods, managed-lane projects are complex, and a P3 approach can take on added commercial and financial dimensions that can be even more difficult to navigate. To maximize the chances for success, there are three common factors that public project sponsors should consider:

• Establish a clear decision framework: The decision to deliver a managed-lane project as a P3 is often assessed using a value-for-money framework, which evaluates whether the public sponsor receives better value on a risk-adjusted basis for the life of the project through the P3 alternative than through a more traditional project-delivery and financing model. Having a clear decision framework that assesses risk factors such as financial feasibility, operations and maintenance, and design and construction is critically important. Such a framework supports defensible, well-informed decisions and allows public officials to communicate a project’s benefits with confidence.

• Create innovative structures to fill the funding gap: All large infrastructure projects depend on a reliable funding plan — a particular challenge for managed-lane P3s, which tend to be among the largest and most costly highway projects in the market. Most of these projects are tolled, and the uncertainty of forecasting traffic demand and toll revenue makes their funding plans more difficult to analyze and structure.

To address this challenge, successful managed-lanes project funding plans must balance three major elements: payment mechanisms for private developers (that is, whether they get paid based on how many cars use the tolled lanes or a set amount each year depending on their performance in managing and maintaining the road); financial structuring (whether the public sponsor guarantees the amount of toll revenue) and tolling policies (such as whether HOVs ride free in the toll lanes and how tolls are adjusted over time). An approach that takes into account all of those elements will help sponsors to better address funding gaps.

• Incentivize high-performance infrastructure: One advantage of P3 structures is that commercial incentives for private-sector innovations can drive down costs, accelerate project completion and improve overall asset performance (the condition of the facility and its ability to function as intended) and corridor throughput (how many vehicles pass through the facility over time) . P3 contracts typically define the required performance standards for the private developer, and their payments are contingent on meeting those standards. P3s typically include contractual mechanisms that require the private developer to maintain a defined level of throughput or be subject to financial penalties. Private developers are strongly motivated to achieve these objectives when their own capital is at risk.

Ultimately when officials consider whether a managed-lane project should be developed as a P3 transaction, project owners must know what questions to ask in search of striking a correct balance between the public interest and a project’s benefits to developers and investors. Finding this balance is not easy, but the right blend of private-sector creativity, innovation and risk transfer can deliver successful solutions.

GOVERNING.COM

BY ED CROOKS | FEBRUARY 25, 2016

Ed Crooks leads KPMG’s Water and Wastewater Public-Private Partnerships activities in the United States. The views expressed are his alone and do not necessarily represent those of KPMG.


Moody's: Governments Well Positioned to Handle P3 Financial Obligations.

Using public-private partnerships to develop large public projects has had a “limited impact” on governments’ credit profiles, Moody’s Investors Service concluded.

Most governments “have proved resilient” in meeting both negotiated financial obligations — such as making availability payments — and potential contingencies, the credit rating agency said in a press release announcing a new report on its findings (paywall). A Moody’s representative offers several reasons for this finding.

“Funding for PPP projects is often spread over a long period of time. Fiscal commitments are often small in scale relative to the size of a government’s balance sheet and revenue sources,” explained Kathrin Heitmann, an analyst in Moody’s Project Finance and Infrastructure team.

The United Kingdom, Canada and Australia have the most experience conducting P3s and have developed strong secondary and refinancing markets and legal frameworks to support P3s, Moody’s pointed out.

The United States, on the other hand, has been slower to adopt the procurement method, in part because of the ready availability of municipal bond financing for large infrastructure projects. Moody’s estimates, for example, that only 0.5 percent of California’s net tax-supported debt is associated with P3s. In Florida the amount is 11.4 percent and in triple-A rated Indiana, about 24 percent, reported Reuters. As a result, developers view the United States as the world’s largest virtually untapped P3 market, noted the news agency.

Countries whose credit profiles are most likely to be affected by real or potential P3 financial obligations are those that are struggling through economic downturns or “have low creditworthiness,” reported Moody’s.

The ratings agency acknowledged that its findings are not comprehensive because the financial details of P3s that have been negotiated are not always disclosed fully.

“Additional reporting provided by some governments beyond mandatory reporting requirements enhances transparency and facilitates our assessment of both contractual and contingent PPP payment obligations,” said Heitmann.

By NCPPP

February 25, 2016


S&P’s Public Finance Podcast: (The Not-For-Profit Health Care Outlook And Our Rating Action On North Dakota)

In this week’s Extra Credit, Senior Director Kevin Holloran discusses the rationale behind our 2016 outlook for the not-for-profit health care sector and Associate Director Carol Spain addresses questions concerning our recent rating action on North Dakota.

Listen to the Podcast.

Feb. 26, 2016


S&P: U.S. Not-For-Profit Health Care Outlook Remains Stable In 2016 On Sector Recovery.

Standard & Poor’s Ratings Services’ outlook on the U.S. not-for-profit health care sector remains stable despite industry pressures (see “U.S. Not-For-Profit Health Care Sector Outlook Revised To Stable From Negative, Though Uncertainties Persist,” Sept. 9, 2015), reflecting operational improvements driven by the Affordable Care Act’s (ACA) Medicaid expansion, through a noted boost in volumes, revenues, and improved payor mix; management initiatives that have delivered on their early promise to improve performance; increasing balance sheet flexibility with generally higher levels of unrestricted reserves as compared to a few years ago; and continued operational benefits from recent merger and acquisition (M&A) activity.

Overview

Continue reading.

25-Feb-2016


Rhode Island's New Route for Funding Bridge Repairs: Truck Tolls.

Rhode Island has the highest percentage of structurally deficient bridges in the country — 23 percent. Now, it’s taking a novel approach to paying for their repair: Truck-only tolls on major bridges throughout the state.

Rhode Island lawmakers adopted the plan earlier this month, and Gov. Gina Raimondo promptly signed off on it. The agency estimates that tractor trailers cause 70 percent of the damage to the state’s roads every year, but currently account for just 20 percent of the revenue to pay for that infrastructure.

Overcoming opposition from truckers, the new law authorizes tolls of up to $20 on large commercial trucks for a statewide trip on Interstate 95. The Rhode Island Department of Transportation (RIDOT) anticipates that once it starts collecting tolls over the next two years, they’ll raise $45 million a year — a 10 percent increase to the agency’s budget.

That money, combined with $420 million worth of bonding, would pay for repairs or replacement of 650 bridges in the next decade. That would bring the percentage of structurally deficient bridges to under 10 percent, as required by federal law, according to RIDOT spokesman Charles St. Martin.

“Trucks are the vehicles that impose the greatest amount of damage on the highways,” said Patrick Jones, the head of the International Bridge, Tunnel and Turnpike Association, an industry group. “In fact, when you’re building the highways, you’re building them to handle heavy trucks.”

Rhode Island’s approach is unique in the United States, Jones said. It is “probably the only state that is imposing tolls only on trucks, not on all vehicles,” he said. “However, if you look at the entire world, it’s not uncommon.” Germany and Switzerland, for example, have nationwide truck tolls.

Raimondo, who originally pushed a plan with even higher tolls on trucks last year, argued that Rhode Island was virtually alone among Northeastern states in not tolling the interstate. Connecticut, which removed its tolls following a deadly 1983 crash at a toll plaza, is the only other state between Maryland and Maine that doesn’t use tolls. Although, lawmakers there are reconsidering that stance.

Trucking groups fought the proposal vigorously. “Our strategy has been since day one, no tolls,” Rhode Island Trucking Association president Chris Maxwell told Providence’s WPRI. “We’re not down at the statehouse to cut any deals or make nice with anybody. From day one, [we’ve been] against tolls.”

The state trucking group suggested last year that raising Rhode Island’s diesel tax and truck registration fees would be better ways of raising money.

Stephanie Kane, a spokeswoman for the Alliance for Toll-Free Interstates, said the new tolls have already prompted some companies to consider leaving Rhode Island. “While the governor heralds RhodeWorks as a jobs booster, the reality is that it harms Rhode Island businesses and will cost Rhode Island jobs,” she said.

The American Trucking Associations also warned Raimondo that her administration’s plan to prevent trucks from leaving highways to avoid tolls could run afoul of federal regulations. Those rules require states to let trucks have easy access to food, fuel, repairs and rest, an association lawyer wrote.

Federal law also normally prevents states from tolling existing interstates without adding new capacity. Rhode Island’s tolling program takes advantage of one of the exceptions to that law: States can put tolls on a non-tolled bridge if they replace or repair that bridge. Each of Rhode Island’s 14 proposed tolling sites is on a bridge or overpass.

The tolls would all be collected electronically using E-ZPass transponders. RIDOT anticipates that it will contract with a company to design, build, operate and maintain the tolling operations. The agency expects the cost of running the program will only take up 5 percent of the revenues. “This application of new technology has made it feasible for the DOT to implement tolls on many bridges that were uneconomical in the past,” St. Martin said.

Rhode Island’s new tolls are part of a larger effort, called RhodeWorks, to shore up the state’s crumbling bridges. It would include massive new projects, like the completion of a $170 million replacement of the viaduct carrying I-95 through Providence, as well as preventive maintenance for hundreds of bridges.

One of the biggest elements of the plan is rebuilding an interchange of two major highways on Providence’s west side, which means replacing 11 bridges. The project has been on the books for 30 years and could cost as much as $500 million — more than the whole RhodeWorks program. The state hopes to win federal grants to cover much of the cost.

New federal funding from Fixing America’s Surface Transportation (FAST) Act, which Congress passed late last year, will also help Rhode Island’s bridge-building effort. Increased federal funding helped the state cut in half the amount of bonding it planned to use for RhodeWorks. That, in turn, reduced the amount of interest the state will pay by 65 percent.

GOVERNING.COM

BY DANIEL C. VOCK | FEBRUARY 23, 2016


Bloomberg Brief: Riggs on Increasing Healthcare Bonds (Audio).

Bloomberg Brief’s Taylor Riggs discusses the rise in health-care bonds from states and municipalities as they try to keep up with rising health costs.

Listen.

February 22, 2016 — 5:09 AM PST


New York Leads Refinancing Wave as Muni Yields Touch Decades Low.

The era of rock-bottom interest rates is sticking around for American states and cities, prompting a fresh wave of municipal-bond sales.

New York City Tuesday sold general-obligation debt for the first time since July to pay off higher-cost securities. The $800 million offering is the biggest tax-exempt sale this week and is set to be followed by refinancing deals from Los Angeles’s schools, the Kentucky building commission and North Carolina, according to data compiled by Bloomberg.

Just two months after the Federal Reserve took its first step back from the near-zero interest rates in place since the credit crisis, borrowing costs in the $3.7 trillion municipal market have slipped back near five-decade lows. With investors seeking havens from equity-market turmoil, 20-year muni yields are holding at 3.27 percent, matching the level reached in December 2012 for the lowest since 1965, according to the Bond Buyer’s index.

“If rates stay here we’ll get a lot of new issuance and a lot of refundings,” said Phil Fischer, Bank of America Merrill Lynch’s head of municipal research in New York. “Money is very cheap.”

New York’s bonds priced at a top yield of 3.09 percent for those maturing in 19 years, according to data compiled by Bloomberg. Ten-year bonds were issued for yields of 2.09 percent, 0.43 percentage point more than AAA-rated municipal bonds of the same maturity.

State and local governments have long taken advantage of low borrowing costs to refinance, with many rushing to do so last year as the Fed moved toward its first rate increase since 2006. Municipalities issued about $420 billion of long- and short-term debt in 2015, the most since 2012.

The pace in 2016 has lagged the same period a year earlier: About $45.4 billion of municipal bonds have been issued this year, down from $50.2 billion in 2015, Bloomberg data show. In both years, about half of the proceeds were used exclusively for refinancing. Before Tuesday, the slide for New York governments had been more pronounced, slipping to $3.5 billion from $4.2 billion.

The continuation of low rates could foster an increase in securities offerings. Yields on top-rated tax-exempt bonds maturing in 10 years reached as little as 1.57 percent on Feb. 11, the lowest since late 2012.

The city’s sale comes after it refinanced $750 million of general-obligation bonds in July, which officials estimate will save about $109 million. The Los Angeles Unified School District is set to sell $575 million of refinancing debt next week, with another $551 million planned by the Kentucky’s building agency and $330 million by North Carolina.

For New York, the interest savings have added to its financial gains, with growing sales and income-tax collections helping the city build $5 billion in reserves. The New York City economy, larger than all but four U.S. states, added 213,000 jobs in 2014 and 2015, pushing the unemployment rate to 4.9 percent.

While the financial sector accounts for 10.9 percent of New York City’s employment and 20 percent of its wages, the economy continues to diversify, thanks to the higher education, health-care and technology industries.

New York’s fiscal strength has led investors to accept lower yields to hold its bonds. The spread, or extra interest they demand relative to AAA rated bonds, dropped to 0.29 percentage point in trading Tuesday, near the 26-month low hit last month, according to Bloomberg indexes.

Moody’s Investors Service rates New York’s general obligation bonds Aa2, its third-highest investment grade. Standard & Poor’s gives the bonds a comparable AA rating.

The latest sale should do well, said Matt Dalton, chief executive officer of Rye Brook, New York-based Belle Haven Investments, which oversees about $4 billion of municipal bonds, including New York’s general-obligation debt. New York received $151 million of orders from individual investors on Monday, according Eric Sumberg, a spokesman for Comptroller Scott Stringer.

Municipal bond mutual funds have had 19 straight weeks of in-flows, including about $1.4 billion two weeks ago, according to Investment Company Institute data.

“Retail investors want to balk because they don’t like the interest rate environment, but they have so much cash they don’t have much choice,” Dalton said. “Munis still make sense on an after-tax basis.”

Bloomberg Business

by Martin Z Braun

February 22, 2016 — 9:01 PM PST Updated on February 23, 2016 — 12:57 PM PST


Puerto Rico Risks Dangerous Precedent by Protecting Pensions.

A suggestion from a U.S. Treasury official to protect Puerto Rico’s pension payments while also seeking cuts from all bondholders may be viewed as the latest sign that politicians favor retirees over investors in cases of municipal distress.

Treasury Counselor Antonio Weiss said in prepared testimony Thursday that a failure to ensure payments from Puerto Rico’s pension system, which has more than 330,000 beneficiaries and is underfunded by $44 billion, would harm the commonwealth’s residents and damage its economy. Meanwhile, “all creditors must be at the table” to restructure the island’s liabilities to an affordable level, he said.

It could “set a dangerous precedent,” said Peter Hayes, head of munis at BlackRock Inc., which oversees $110 billion of the debt. “Pensions are clearly down the capital structure in terms of hierarchy and repayment. So the political side of it is boosting them higher than bondholders.”

Weiss said in Washington that there was a difference between protecting pensions and saying that they “should be prioritized above everything else.” He said all stakeholders should receive fair and equitable treatment.

Political Priorities

The suggestion to shield Puerto Rico’s pensions, combined with bankruptcies in Detroit and Stockton, California, show that the politics around retiree benefits can often muddy the outlook for repayment assumed by bond investors. Constitutionally protected general obligations would recover about 72 percent under a plan from the commonwealth released earlier this month. Other securities would get less.

In Stockton, the California Public Employees’ Retirement System was protected from cuts while some bondholders received cents on the dollar. In Detroit, the city’s pensions got more than twice what creditors who loaned the city money for those funds received. General obligation bondholders settled for less than full value, even though the $3.7 trillion municipal market has long believed that such debt is sacrosanct.

Moody’s Investors Service said Thursday in a report that recovery rates for bondholders have generally been lower than for retirees in municipal bankruptcies. Of the six large bankruptcies cited in the report, four of them paid pensioners 100 percent of what they were owed.

Generally, to fund a pension plan, “you raise taxes and you pay for it, or you have to make cuts if you don’t want to raise taxes,” Hayes said in an interview at BlackRock’s New York headquarters. “We’re seeing this political will to make pensioners whole and ignore the other two options.”

Ryan Deadline

Puerto Rico’s benchmark general obligations with an 8 percent coupon and maturing in 2035 traded at an average 71 cents on the dollar, the highest price since Feb. 5, data compiled by Bloomberg show. They’ve been little changed in 2016 as many investors are entrenched in their positions ahead of a restructuring.

Republican Representative Mick Mulvaney from South Carolina also brought up the risk of a “dangerous precedent” in potentially favoring pensioners at the expense of bondholders during a Thursday hearing of the House Financial Services Committee’s oversight and investigations group.

“That doesn’t strike me as fair,” he said.

Congress is considering whether to inject the federal government into a more central role in a crisis that’s escalated since Governor Alejandro Garcia Padilla in June said the government can’t afford to pay its debt.

Puerto Rico has already defaulted on some securities and has warned that it may halt payments as soon as May without a solution. House Speaker Paul Ryan directed Republican committee chiefs to come up with a plan by the end of March.

Bloomberg Business

by Brian Chappatta

February 25, 2016 — 10:42 AM PST Updated on February 25, 2016 — 1:52 PM PST


Bloomberg Brief Weekly Video - 02/25

Taylor Riggs, a contributor to Bloomberg Briefs, talks with reporter Joe Mysak about this week’s municipal market news.

Watch the video.

February 25, 2016


Moody's: Global Changes in Economy, Technology, and Finance Transforming Environment for Higher Education.

New York, February 23, 2016 — The global higher education sector is undergoing significant transition, with growing demand, increasing competition, and evolving funding models, Moody’s Investors Service says in a new report. The strength of enterprise risk management and strategic positioning will drive the financial health of individual universities as they adapt to this changing environment.

“Demand will continue to grow based on the benefits of advanced education. Increasing desire for lifelong learning expands the pool of students. At the same time, globalization and new delivery models drive increased competition for students, faculty, research funding and philanthropy,” Moody’s Associate Managing Director Susan Fitzgerald says in “Global Higher Education Faces Period of Significant Transition.” She adds, “While risk increases during transition periods, the sector overall is expected to be resilient.”

Due to the significant growth in demand for education, government funding will be unable to keep pace, particularly amid competing governmental budgetary priorities. This will shape how higher education is funded globally, with students bearing a greater burden of costs. There will also be continued expansion and change in the types of student loans offered.

Amid the global evolution of higher education, changes to regulatory frameworks and oversight mechanisms will intensify and accelerate. Public university funding will become increasingly tied to public policy priorities.

Over time, there will be an increase in mergers and restructurings, with more universities pursuing these arrangements to achieve economies of scale and contain expenses.

Moody’s says most mergers of public universities will be driven at the governmental level, rather than by individual universities. Merged entities can benefit from increased enrollment, size and programmatic diversity, but simultaneously face risks as they address the structural challenges that contributed to the merger. Some private colleges lacking brand recognition and scale will close in an increasingly competitive environment.

Beyond seeking to enroll more international students, universities are expanding their brand footprint, either by directly establishing branch campuses outside their home state or country, or partnering with universities in other countries. This can aid revenue diversification and result in a growing pipeline of students at the home campus, Moody’s says.

Additionally, students will seek out not only an affordable university, but one with flexible alternatives, including online learning. Online education will become a more accepted and mainstream strategy for universities across regions and programs, and will provide universities with alternative revenue streams and new branding opportunities.

Rising fixed costs are a credit challenge for many universities, particularly against a constrained revenue environment. These costs include new infrastructure costs as universities absorb debt service and facilities operating costs previously covered by their associated governments, as well as rising regulatory and compliance costs. With an aging university workforce in many countries, pension and other post-employment benefit costs will be an increasing burden for universities globally.

The report is available to Moody’s subscribers here.


Treasury Plan for Puerto Rico Favors Pensions Over Bondholders.

WASHINGTON — If it’s up to the Treasury Department, public employees in Puerto Rico who were promised pensions could be better off than investors who bought the island’s bonds.

A broad plan being put forward by the Treasury Department to ease Puerto Rico’s financial crisis would put pension payments to retirees ahead of payments to bondholders — a move that some experts fear could rattle the larger municipal bond market.

The proposal was being driven by evidence that Puerto Rico’s pension system is nearly out of money, leaving retirees who are dependent on it financially vulnerable.

“The major problem is, the entire pension system is close to being depleted,” said Antonio Weiss, counselor to Jacob J. Lew, the Treasury secretary. “But 330,000 people depend on it. It’s unfunded, and they have to be protected.”

Shielding retirees from pension cuts, the thinking goes, would not only protect thousands of older residents on the island, but it might also encourage younger retirees to stay there, rather than move to the United States mainland in search of new jobs and incomes.

Out-migration is considered a prime cause of Puerto Rico’s financial tailspin, because it shrinks the island’s economy, leaving fewer people and fewer dollars to support the crushing debt.

Puerto Rico is said to have about $72 billion of financial debt outstanding, most of it in the form of municipal bonds. By some estimates, it has incurred an additional $43 billion in unfunded pension obligations.

But deciding that pensioners’ interests should be put above those of bondholders — if a choice must be made — is not without certain risks.

Some public-finance experts say they fear that if Puerto Rico can renege on promises to pay debts to investors, while sparing retirees, other municipalities might try to do the same, casting a pall over the larger market in municipal bonds, where American towns and cities have gone for decades to get the money they need to build roads, schools and other public works.

If Puerto Rico gets special treatment, “you have huge contagion risk to the entire municipal market,” Andrew N. Rosenberg, a partner at the law firm Paul, Weiss, Rifkind, Wharton & Garrison, said at a recent gathering of creditor representatives.

Treasury officials said such concerns were unfounded. The framework they are proposing would be designed only for distressed United States territories, like Puerto Rico, and could not be used by states or municipalities on the mainland.

Officials pointed to a report by an investment firm, Nuveen Asset Management, which said, “We believe most institutional investors understand Puerto Rico’s unique situation and the coming debt restructuring will not create widespread credit implications.”

Still, moving public pensions to the top of the stack would infuriate at least some bondholders — especially those who paid close to face value for their bonds years ago, when they were still rated investment grade, and who had expected to hold them to maturity and get all their principal back.

Although the bondholders have often been portrayed as deep-pocketed vultures since Puerto Rico’s debt crisis began, many of them are small investors, themselves trying to save for a comfortable retirement.

“Most Puerto Rican debt is held by individuals,” said Thomas Moers Mayer, a lawyer representing two large mutual fund companies, Franklin Advisers and OppenheimerFunds, which together own about $10 billion in Puerto Rican debt securities. “They are mostly over 65, and they mostly have incomes of less than $100,000 a year. They are not vulture funds. They are your friends and neighbors.”

Some Republican senators — notably Charles E. Grassley of Iowa and Orrin G. Hatch of Utah — whose constituents are among the bondholders, have expressed similar views. Puerto Rico’s debt is unusually widely held because it offered above average yields and interest that was exempt from federal, state and local taxes, no matter where the buyer lived.

Treasury officials have said they are willing to work with Congress to find a suitable way of handling the different categories of creditors.

Financial help for Puerto Rico will be the subject of a hearing on Thursday by the House Committee on Natural Resources. Mr. Weiss is scheduled to be the sole witness.

Any rescue plan would need congressional approval and various committees in the House and Senate are weighing ways to help the island reduce its debt and better manage its economy.

Paul D. Ryan, the Republican speaker of the House, has set a deadline of March 30 for a House version of a bill. A version of Treasury’s plan was outlined in a draft bill presented to a Senate committee; it has not been voted on.

The draft, obtained by The New York Times, also calls for a five-member “fiscal reform assistance council” appointed by the president to hold the island to meaningful budgeting, disclosure and fiscal reform practices. The board would have the power to make across-the-board budget cuts if necessary.

Members of Congress, especially Republicans, have expressed concern about whether Puerto Rico has the wherewithal to manage its future finances, even if it gets help in the short term. Credit markets have also been reluctant to invest further in Puerto Rico’s bonds without some assurances that the island’s finances will be better managed in the years to come.

The idea of an oversight board has rankled residents, however, who say it has overtones of colonialism.

The part of the proposal that gives priority to pensioners has received little attention. Currently, Puerto Rico’s laws and Constitution give top priority to general-obligation bonds — the type backed by the government’s “good faith, credit and taxing power.”

Puerto Rico is not unique in this respect; for decades, the general-obligation bonds of all the states have been marketed as virtually default-proof, safe enough for widows and orphans. The concept was developed after the Civil War, as a way to rebuild investor trust after a number of notorious bond defaults.

Other bonds carry with them varying degrees of legal repayment security. Puerto Rico’s debt is extraordinarily complex, but in general, its bonds can be ranked in a hierarchy of eight levels, with general-obligation bonds at the top. The ranking is described in an analysis of the debt by the Center for a New Economy, a nonpartisan research group in San Juan.

Public workers’ pensions, the center found, fall on a second hierarchy altogether, which sets priorities for the government’s operational disbursements. Here again, however, payments due on general-obligation bonds come first, followed by payments due on legally binding contracts. Outlays for pensions come third.

That means that under existing law in Puerto Rico, if there is not enough money to pay both general-obligation bonds and public retirees’ pensions, the money would go to bondholders.

But the Treasury’s proposed restructuring framework would change that. It would require that the restructuring plan “not unduly impair the claims of any class of pensioners.”

General-obligation bondholders, on the other hand, would get such protection only “if feasible,” according to the draft that outlined the plan.

This new legal framework is being created because Puerto Rico, as a United States territory, has no access to bankruptcy laws, where complicated claims by creditors can be worked out in a court under the supervision of a bankruptcy judge.

Puerto Rico has already defaulted on some of its bonds. More payments are due in May and June. Bonds are now nearly impossible to sell, and members of Congress, especially Democrats, as well as financial experts say the island’s troubles will become increasingly enormous if some kind of restructuring framework is not approved soon.

THE NEW YORK TIMES

By MARY WILLIAMS WALSH

FEB. 24, 2016


GASB Outlook E-Newsletter Q1, 2016.

Read the Newsletter.


Public-Private Partnerships Have Limited Impact on Government Debt - Moody's.

Public-private partnerships have had a limited impact on government debt profiles around the globe, including in the U.S. states of California, Florida and Indiana, Moody’s Investors Service said in a report published on Monday.

The market for leveraging private dollars to build public projects is far more mature in the U.K., Canada and Australia than it is in the United States. Construction firms have been eyeing the United States as the largest untapped market for such projects globally.

Obligations from such so-called PPP, or P3, projects make up only about 0.5 percent of the total net tax-supported debt in California, for example.

In Florida, that number is 11.4 percent, and for triple-A rated Indiana, it is 24.2 percent, Moody’s said.

“Funding for PPP projects is often spread over a long period of time,” Moody’s analyst Kathrin Heitmann said in a statement. “Fiscal commitments are often small in scale relative to the size of a government’s balance sheet and revenue sources.”

The U.S. market has been slow to develop, largely because state and local governments can use low-interest municipal bonds to build bridges, schools, water treatment facilities and other infrastructure.

Even so, several massive U.S. transportation projects underway have P3 components, including California’s $68 billion high-speed rail and Illinois’ $14 billion South Suburban Airport near Chicago. P3s are also being used and considered more often for universities and public buildings like courthouses.

The contracts can also be long, complicated and sometimes risky. Kentucky’s $324 million P3 for statewide high-speed internet access faces a 39 percent shortfall in the annual revenue it needs to make bond payments, state officials said in January, according to WDRB News in Louisville.

P3 payment obligation risks can also stress the credit profile of procuring governments, especially in economic downturns or for governments with poor creditworthiness, Moody’s said.

So far around the world, however, “the credit strength of most public sector entities has proved resilient to contractual and contingent PPP risks,” it said.

Moody’s report was constrained by its ability to capture some P3 obligations in its review of debt because not all contractual payment obligations are disclosed, it said.

The report was released in conjunction with the 2016 Institute of International Finance’s G20 summit in Shanghai.

Reuters

(Reporting by Hilary Russ; Editing by Dan Grebler)

Mon Feb 22, 2016


Mintz Levin: Department Of Energy Provides Major Funding Opportunities.

The start of the new year has brought with it numerous opportunities for energy tech funding from the Department of Energy. Hundreds of millions of dollars have been or are being given out to companies and research institutions across the country – opportunities stretch a wide variety of focus areas, from solar energy storage to grid modernization. It’s evident that energy and environment is a top priority for the Obama administration in its final year in office, and this is good news for those companies on the cutting edge of energy technology. For details on several of the DOE’s funding initiatives and its particularly substantial efforts on grid modernization in particular, read on.

One of the most significant recent DOE funding efforts is its new Grid Modernization Multi-Year Program Plan. Alongside the plan comes an award of up to $220 million over three years to support research and development in advanced storage systems, clean energy integration, standards and test procedures, and a number of other key grid modernization areas. The DOE has already invested more than $4.5 billion through the Recovery Act stimulus funding over the past few years. This most recent round of grid mod funding will support 88 innovative grid technology projects led by 14 of DOE’s National Labs, in coordination with public and private-sector partners. These projects will seek to solve challenges posed by the integration of conventional and renewable sources with energy and smart buildings, all while ensuring the grid is secure against threats like cyber-attacks and climate change. For more info on the labs and projects that will be funded by the DOE award, click here.

Other recently announced DOE funding opportunities include the following:

$58 million to advance fuel-efficient vehicle technologies, with which the DOE will solicit projects across vehicle technologies like energy storage, electric drive systems, and advanced combustion.

$21 million to lower solar energy deployment barriers, money that is intended to help states take advantage of falling solar prices while also supporting research on solar energy innovation and technology adoption patterns.

$18 million to develop solar energy storage solutions, money that will fund six new projects across the US that will enable the development and demonstration of integrated, scalable, and cost-effective solar tech that incorporate energy storage power to American homes after the sun sets or when clouds are overhead.

$11.3 million to develop flexible biomass-to-hydrocarbon biofuels conversion pathways that can be modified to produce advanced fuels and/or products based on other factors like market demand.

The content of this article is intended to provide a general guide to the subject matter. Specialist advice should be sought about your specific circumstances.

Article by Thomas R. Burton III

Last Updated: February 12 2016

Mintz, Levin, Cohn, Ferris, Glovsky and Popeo, P.C.


Making Transportation Finance History with a Green Muni Bond.

We’ve made tremendous strides up the high road to a clean energy economy over the past decade, thanks not just to new car performance standards and the Clean Power Plan but also to historic investments made in the much-maligned American Reinvestment and Recovery (Recovery Act). The building momentum is palpable and inspiring.

And much more investment is needed. Credible estimates claim that trillions of dollars will need to drive us forward to this brighter future. And this is where environmental finance can fill the gap. What is environmental finance? As guru Michael Curley sums up, “The goal of environmental finance is to bring the greatest environmental good to the largest number of people at the lowest possible cost.” (for this and much other wisdom see his textbook on finance policy). To do this job, finance experts have a toolbox. The Recovery Act used a couple of tools, most notably grant-making and tax incentives. Fortunately, there’s also a multi-trillion dollar global bond marketplace.

In order to help attract investors in this market, NRDC is proud to be part of the Green City Bond Campaign (organized by the Climate Bonds Initiative) to help with the certification and issuance of bonds to finance new infrastructure, including clean transportation projects. Green city bonds are similar to municipal bonds, except that they are labeled “green,” their proceeds go to green investments and issuers “track and report on the use of proceeds to ensure green compliance.” (see the nifty primer on green city bonds here). This is an exciting marketplace for financing sustainability, as you can see from this graph drawn from the latest Climate Bonds Initiative (for more info go to the two-page update itself):

Even better news is that 2016 started off with a bang, as New York City’s Metropolitan Transit Authority (MTA, the nation’s largest public transportation agency) issued their first-ever green bond. As the Climate Bonds Initiative noted in its press release quoting my colleague Doug Sims last week, this is also the first U.S. muni bond certified as Low Carbon Transport based on new criteria and the largest certified green bond so far at $500 million.

Proceeds from bond sales go to capital investments in electrified rail, which provides millions of rides to New Yorkers every day. This is an important part of New York’s clean transportation future, with subway ridership trending upward about 11 percent from 2009-2014 alone to more than an eye-popping 1.7 billion rides a year. Issuing this historic green bond to support this growth serves multiple purposes as described in the Climate Bonds Initiative’s primer – it diversifies the investor base for rail, helps inform and involve residents in the future of rail in New York, and opens up new a collaboration between New York City agencies which might lead to other innovative initiatives.

Now that MTA has blazed the trail for green bonds, other transit agencies should seriously consider using this tool for leveraging public investments. There are trillions of dollars at play in the bond marketplace, and investors, cities and the environment deserve more clean transportation investment opportunities.

Deron Lovaas’s Blog

Switchboard is the staff blog of the Natural Resources Defense Council, the nation’s most effective environmental group. For more about our work, including in-depth policy documents, action alerts and ways you can contribute, visit NRDC.org.

Posted February 17, 2016


What’s Holding P3s Back?

Chris Hamel, managing director head of municipal finance at RBC Capital Markets, hosted the webinar: Why Haven’t Public-Private Partnerships Caught on for Infrastructure Financing in the U.S.? In it Hamel addressed what he said was the core infrastructure needs for the U.S.: more funding.

Public-Private Partnerships

Hamel said he believes that through an increased use of public-private partnerships (P3) the U.S. would be able to breakdown greater funding barriers. He says that P3s often mean something different to everyone — comparing the process to six blind men all describing an elephant.

“The municipal government can finance infrastructure cheaper than the private sector because of the roll of prevision tax exemption on their debt. While this may not be the only factor that affects the analysis of the union execution vs. P3, it is an important one that frankly often prevails,” said Hamel.

Hamel feels there are three suggested elements for the U.S. to develop its own unique approach to P3s:

Policy Questions and Problems that Arise

“It comes down to what are we all comfortable with in public and private funding? With the events surrounding the water in Flint, Michigan, would it have done better being handled in the private sector?”

Hamel relates the Internet to a private sector that, in a sense, most are comfortable with. A different example, which may draw different opinions is the public sector gaining revenue through tolls, while in the private sector the naming rights to a bridge (or other structure) are sold to gain revenue.

Another problem Hamel sees is that private sector innovation can have unintended consequences for the state and local government. In the example of the Phoenix airport, Sky Harbor, a great deal of revenue is generated by the airports transportation — but with new transportation apps gaining popularity, Sky Harbor loses that revenue.

“How will the airport re-seize the revenue taken by Uber and Lyft?”

Hamel believes that the key to making P3s and solving the U.S.’s infrastructure challenge is gained through collaboration.

BY MAILE BUCHER ON FEB 18, 2016


Cleared for Takeoff: Airports and the P3 Opportunity.

As their potential for value creation gains recognition, airport public-private partnerships are picking up momentum.

This year marks the 20th anniversary of legislation that created the Federal Aviation Administration’s Airport Privatization Pilot Program, designed to allow access to sources of private capital for airport improvement and development projects. What is the state of airport public-private partnerships (P3s) in the U.S.? And what do local government officials need to know when considering airport P3s?

It’s clear that airport P3s are gaining some momentum, as evidenced by major projects in San Juan, Puerto Rico, and in New York City, along with other initiatives around the country.

In February 2013, a consortium known as Aerostar Airport Holdings closed a 40-year concession and renovation deal for San Juan International Airport. Puerto Rico received $615 million upfront and revenue sharing in exchange for a long-term lease. What has happened since then? The operational handover to Aerostar was executed smoothly without any labor disputes or operational disruptions, and all airport employees who wanted to continue working were retained. Aerostar recently completed a $148 million renovation that enhanced airport baggage handling, energy efficiency, parking, and food, beverage and other store offerings.

And last May, the Port Authority of New York and New Jersey selected the consortium of LaGuardia Gateway Partners (LGP) for a $3.6 billion central terminal redevelopment project at LaGuardia Airport. By using a P3 model, the Port Authority felt that it would be able to complete the project more quickly, cause less disruption to airlines and transfer certain risks of cost overruns to the private sector.

There are other ongoing airport P3 initiatives to watch. In Denver, for example, the city and county recently issued an RFP to hire a “strategic program development advisor” for a project to create more space for revenue-generating shops and restaurants in the Great Hall of Denver International Airport’s Jeppesen Terminal. And in Austin, Texas, the City Council authorized negotiations with Highstar Capital to lease 30 acres, including the South Terminal, at Austin-Bergstrom International Airport.

While these projects indicate growing interest in airport P3s in this country, the U.S. airport P3 market is still in a relatively undeveloped stage. Globally, by contrast, approximately 40 of the biggest 100 airports are fully or partially privately owned and/or operated, an indication that greater private-sector involvement is seen as valuable.

So as investors and private airport operators evaluate opportunities across the United States, what do they generally look for? First, they want to see a vibrant regional economic environment characterized by a growing population and employment base along with the likelihood of continuing GDP expansion. Also critical to potential investors is a large and stable amount of “origin and destination” traffic. O&D traffic — as opposed to hub/connection traffic — tends to reflect the essentiality of an airport to the region it serves.

For public officials exploring airport P3 projects, the questions are the same as for any transaction: “What am I getting?” and “What am I giving?” On the positive side, a P3 can create savings for airlines; generate upfront and periodic payments that can be used for non-airport purposes; bring greater commercial discipline via a comprehensive business plan and global relationships; and transfer risk to the private sector. And a P3 can bring more sources of creativity from both the public and private domains to solving infrastructure problems.

On the other side of the ledger, in a P3 a public authority is likely to have to cede some direct control over a project to the private sector; typically must agree to contractual provisions that commit future public funds regardless of actual revenues; and in some cases incur higher financing costs related to capital projects.

Whatever the pros and cons, it’s clear that airport P3s are slowly gaining acceptance across the U.S. as evidence of their value creation becomes better understood. The FAA privatization program has significant unused capacity. These unused slots represent an opportunity for public authorities that want to drive more economic development through their airports.

GOVERNING.COM

BY ANDREW DEYE | FEBRUARY 17, 2016


The Transparency That Public Pensions Need.

Pension investments are increasingly complex, but disclosure standards have not kept pace.

The stock market’s recent volatility is a continuation of the bumpy ride investors have experienced since the Great Recession. Such swings used to have little direct effect on public pension plans, but that has changed.

That’s because over the past four decades public pensions, in hopes of boosting investment returns, have shifted funds away from fixed-income investments such as government and high-quality corporate bonds. Today they hold, on average, about half of their assets in stocks and another quarter in alternative investments such as private equity, real estate and hedge funds. Between 2006 and 2013, the percentage of their funds invested in alternative assets more than doubled.

Not surprisingly, the collective returns of public fund investments over the last few years have been volatile, ranging from a high of 21 percent in fiscal year 2011 to a low of 1 percent in fiscal 2013. Returns for calendar 2015 are expected to be essentially flat.

Rules governing disclosure and transparency haven’t kept pace with these trends. While some individual funds and states have made changes, more work must be done to increase transparency and present a clear picture of funds’ bottom-line performance and costs.

Alternative investments can be complex. Most, including private equity and real estate, can be challenging to accurately value because there is no public exchange. They also often come with higher management costs. The total cost of managing pension assets has increased by more than 30 percent over the past decade, reducing returns on alternatives by as much as 10 to 20 percent for some plans.

Current disclosure standards were designed for much simpler investments and do not provide enough transparency for these complex and costly alternatives. Beneficiaries, taxpayers and policymakers need better information about the investment performance of public pension plans because investment returns account for an estimated 60 percent of the money paid out in the form of pension benefits.

Insufficient transparency affects the ability to discern how much is being paid in fees and the resulting impact on investment returns. Current accounting standards allow public pension plans to report investment returns without deducting the cost of fees paid to investment managers, known as “gross of fees.” More than a quarter of the largest plans take this route. Some additional costs, such as carried interest and some performance fees, also can go unreported.

There are some exceptions. One of the few plans to comprehensively report performance fees is the Missouri State Employees’ Retirement System. In 2014, the plan reported that performance fees paid to investment managers accounted for about half of its overall fees.

And last July the nation’s largest public retirement plan, the California Public Employees’ Retirement System (CalPERS), raised the bar on investment-fee transparency by announcing that it would disclose the full amount it pays to invest in private equity. In November, CalPERS’ new policy of providing additional reporting on carried interest for private equity and other performance fees showed that external investment partners realized $700 million from profit-sharing agreements in fiscal 2015 — information the public would not have had without the new reporting policy.

Movement toward stronger reporting and greater transparency on the costs associated with alternative investments appears to be gaining momentum. The Institutional Limited Partners Association’s Fee Transparency Initiative, a widely supported industry effort to establish comprehensive standards for fee and expense reporting among institutional investors and fund managers, is advocating total fee reporting by private equity managers and their investors. And in a recent letter to the Securities and Exchange Commission, 13 state and municipal treasurers and comptrollers — many of them members of the Fee Transparency Initiative — appealed for industrywide standards on private equity fee disclosure, including carried interest.

There’s no one-size-fits-all approach to successful investing, but there is a uniform need for full disclosure on investment performance and fees. This will help ensure that risks, returns and costs are balanced in ways that follow best practices and that public pension plans accurately disclose the fees that are paid.

State pension plans are entrusted with $3 trillion in public funds and face the challenge of a $1 trillion gap in the amount needed to pay for pension promises. With the dramatic shift toward more complex alternative investments, government workers and taxpayers deserve more complete information on both the cost of managing pension investments and the bottom-line results of these riskier investment strategies.

GOVERNING.COM

BY SUSAN K. URAHN | FEBRUARY 16, 2016


In Snow Removal, a Model for Change.

St. Paul took an unusual path to improving a vital public service, one that holds promise for other city operations.

Clearing roads after a snowfall is not a new problem for cities in northern climes. But government is infamously prone to institutional inertia, and substantial improvement in such routine city services can be slow. After the particularly difficult winter of 2013-2014, St. Paul, Minn., Mayor Chris Coleman decided that the city needed a new perspective on snow removal to reach best-in-class status. The city’s approach to achieving this holds lessons for governments everywhere.

As many government officials have learned, excellence in delivering the most basic and essential public services is crucial to bringing the public on board with more ambitious, visionary goals. “If your people aren’t convinced that you know how to plow a street, it’s difficult for them to embrace your larger vision of how to modernize the city,” Coleman says.

Snow removal in St. Paul is the responsibility of the Department of Public Works (DPW), the city’s largest agency. To both streamline its organizational structure and improve how DPW delivers services, the mayor’s office reached out in August 2014 to a nonprofit called Civic Consulting MN to explore a collaborative, inclusive — and free — model of outside consultation.

The traditional model for management consulting in the public sector is tactical. Teams of external consultants diagnose a problem, prescribe a solution, present a bill for their services and then depart — leaving the hard work of implementing their recommendations to government leaders. Dave MacCallum, who leads Civic Consulting MN, explained that the model it has been developing since 2014 is different, not only pairing pro bono consultants with leaders in municipal government but also seeing the process of change through to completion.

Cities across the country have experimented with models incorporating volunteer help from leading civic and business experts. But approaches that work in the private sector do not always translate well to public problems. The success of such programs depends on the background of the loaned executive and the willingness of the bureaucracy to cooperate. In St. Paul, many of these issues were resolved by working through Civic Consulting MN, a skilled intermediary.

Though snow removal was the original charge, the partnership focused on several issues across the Department of Public Works; in order to make improvements in one area, organizational change was required throughout. And the innovation work had to be done on top of the department’ daily operations, so time was in short supply. Scott Cordes, St Paul’s director of innovation and an instrumental driver of the partnership, describes the project as remarkable in its speed of completion, which he attributes to thorough buy-in at all levels.

At the outset, Civic Consulting MN connected private-sector human resources experts with DPW leadership to design a team-based model for internal improvement. Together, they established several working groups that included newer employees, experienced public servants, department managers and Civic Consulting MN partners. DPW Director Kathy Lantry says this team-based model was effective in pairing fresh, external perspectives with institutional knowledge to generate smart, efficient plans for restructuring.

The lesson here is that outside experts can be effective in spurring structural innovation only if they source creative ideas from existing staff. For innovation to be successful, it must be paralleled by a shift in internal culture. The DPW staff participated in the changes from ideation to execution, ensuring that the new shape of the department would immediately be a good fit.

Snow removal, as a result, is a much more efficient operation in St. Paul than before, and the public has taken notice. In a recent snow emergency, for example, the city needed to tow only half as many cars compared to similar events, the result of better communication with the public as to where they can and can’t park during a snowstorm. Joe Spah, the city’s director of street maintenance, says DPW is now using data to track what trucks are on the road, where they are going, when they are pre-treating streets and how weather forecasts should inform executive decisions.

Mayor Coleman hopes this ethos, which pairs best-in-class operations with structural change, will infuse the rest of the city’s operations: “It’s going to be a great platform to take across the city into other areas,” he says. Indeed, this partnership models a perspective on managing change to which cities everywhere should aspire.

GOVERNING.COM

BY STEPHEN GOLDSMITH | FEBRUARY 17, 2016

Craig Campbell, a research assistant at the Ash Center for Democratic Governance and Innovation at the Harvard Kennedy School, contributed research and writing for this column.


Credit FAQ: How Standard & Poor's Approaches Rating the Growing Number of North American Light Rail Transit Projects.

Government agencies across North America are turning to the public-private partnership (P3) financing model to deliver new passenger light rail transit infrastructure, especially in Canada, where P3s are a tried and tested model with over 100 social accommodation projects such as hospitals successfully deployed across the provinces.

Continue reading.

Feb. 19, 2016


U.S. Public Finance Records Nearly Twice As Many Upgrades As Downgrades In 2015, Says S&P Report.

SAN FRANCISCO (Standard & Poor’s) Feb. 16, 2016–Standard & Poor’s Ratings Services upgraded more ratings in U.S. public finance (USPF) than it downgraded in 2015, the fourth consecutive year with positive rating movement, according to “U.S. Public Finance Records Nearly Twice As Many Upgrades As Downgrades In 2015,” published today on RatingsDirect.

“The fourth quarter was the 13th in a row in which upgrades outnumbered downgrades in USPF, extending the longest quarterly streak of upgrades outpacing downgrades since the first quarter of 2001,” said Larry Witte, a senior director in Standard & Poor’s Global Fixed Income Research Group. “The experience in 2015 continues that of most of the past 15 years: There were more downgrades in just two years, 2003 and 2011. The latter was an anomaly because most of the downgrades were in the housing sector, which had about 1,200 ratings downgraded after the U.S. sovereign rating was downgraded in August 2011.”

The report is available to subscribers of RatingsDirect at www.globalcreditportal.com and at www.spcapitaliq.com. If you are not a RatingsDirect subscriber, you may purchase a copy of the report by calling (1) 212-438-7280 or sending an e-mail to [email protected].

Ratings information can also be found on Standard & Poor’s public Web site by using the Ratings search box located in the left column at www.standardandpoors.com. Members of the media may request a copy of this
report by contacting the media representative provided.

Global Fixed Income Research: Lawrence R Witte, CFA, Senior Director, San Francisco (1) 415-371-5037;
[email protected]

Media Contact: Michelle James, New York +1 212 438 5054;
[email protected]


New Stadium? Teams Now Want the Whole Neighborhood.

Traditionally, when sports teams tried to convince cities to pay hundreds of millions to build new stadiums, they tended to make lofty promises about benefits to the local economy, that new businesses and residences would rise to serve the throngs of fans. Time and again we’ve seen these promises fall short — ” ‘downtown catalysts’ that failed to catalyze,” as Neil DeMause put it in the Nation.

Now teams are taking matters into their own hands — and, of course, they will reap the benefits.

Craig Edwards of Fangraphs has tracked the pattern of MLB teams developing the land near their ballparks to open up new revenue streams. The Atlanta Braves’ plan to move to the suburbs of Cobb County included $400 million of mixed-use facilities, with the team controlling the development. After suffering years of delays due to a bad economy, the St. Louis Cardinals in 2014 finally completed the first phase of their development, Ballpark Village, featuring bars, restaurants and the team’s hall of fame. The Chicago Cubs have planned a $575 million mixed-use complex called the 1060 Project, which will include a hotel, fitness club and office and retail space.

It’s not just baseball. SportsBusiness Journal’s David Broughton put together a comprehensive list of more than 30 mixed-use developments around stadiums that to some extent directly involve team ownership. These included the joint proposal by the San Diego Chargers and Oakland Raiders for a stadium in Carson City, California, and the plan to develop the St. Louis riverfront for the Rams — both now obsolete with the Rams’ pending move to Los Angeles. Their proposed stadium project in Inglewood will include “a 6,000-seat performance venue, 890,000 square feet of retail, 780,000 square feet of office space, 2,500 new residential units, a 300-room hotel and 25 acres of public parks,” as well as a campus for the NFL’s western expansion of its media arm.

Many of these projects profiled by SBJ are part of future stadium plans, but among those currently active are L.A. Live, a complex next to the Staples Center, home of the NBA’s Clippers and Lakers and the NHL’s Kings, that includes two luxury hotels, 13 restaurants, and the Grammy Museum. There’s Xfinity Live, an entertainment district anchored by Citizens Bank Park, Lincoln Financial Field and the Wells Fargo Center in Philadelphia, developed by Comcast, which owns the Flyers. And the New England Patriots have Patriot Place, a 1.3 million-square-foot development including a movie theater, bowling alley and outpatient health care center.

As Edwards notes, it’s difficult to tell just what kind of impact these mixed-use developments have on teams’ financials in terms of mandated revenue sharing. For baseball specifically, he uses MLB’s approach to team-owned television networks — whose revenues aren’t subject to revenue sharing outside of television rights fees, which the league sets at “fair market value” — to guess the same would be true for land development. “With this risk, team owners can reap great rewards,” Edwards writes.

Those rewards are further bolstered by the usual subsidies, exemptions and abatements that cities and states concede to teams, as demonstrated starkly in the case of the Milwaukee Bucks. Already a controversial plan given Wisconsin governor Scott Walker’s simultaneous cutting of the state university system budget by $250 million, the stadium proposal gives the team nearly full control to develop a “sports and entertainment district” without having to pay property taxes on “parking lots, garages, restaurants, parks, concession facilities, entertainment facilities, transportation facilities and other functionally related or auxiliary facilities or structures.”

The traditional fleecing of America’s cities by sports franchises used to involve only tax breaks and funding to build privately owned stadiums, whose concession sales, signage fees and other revenue flowed directly to the teams. Now, by controlling the mixed-use developments surrounding the ballparks, owners have found a new way to profit off the generosity of local municipalities — even when stadiums are publicly owned, as will be the case with the new Bucks arena. They’ve just shifted their money-making strategy a few blocks over.

This column does not necessarily reflect the opinion of the editorial board or Bloomberg LP and its owners.

Bloomberg View

By Kavitha A. Davidson

26 FEB 16, 2016 8:10 AM EST

To contact the author of this story:
Kavitha A. Davidson at [email protected]

To contact the editor responsible for this story:
Tobin Harshaw at [email protected]


Muni Bonds Undone by Lehman Collapse Test Latest Market Turmoil.

As investors demand higher premiums to buy debt sold by financial firms, two Alabama utility districts are selling about $1.7 billion of bonds backed by decades-long natural gas trades with Goldman Sachs Group Inc. and Royal Bank of Canada.

The sales by the Lower Alabama Gas District and the Black Belt Energy Gas District will test whether the fears of a worldwide economic slowdown are seeping into a niche of the municipal market, where utilities borrow to buy fuel from banks that’s delivered years later. With investors demanding the most extra yield in 31 months to hold bank bonds, Wells Capital Management and Barclays Plc say concern about financial turmoil could lead to losses on the gas debt, which carries the same ratings as the financial firms involved.

“Recently the muni market has woken up a little bit to what’s going on in the corporate market,” said Lyle Fitterer, the head of tax-exempt debt at Wells Capital Management, which oversees $39 billion of municipal bonds. “You’re seeing people lighten up on some stuff or a little bit more nervous about corporate-backed deals in the muni market.”

Municipal utilities have issued more than $30 billion of tax-exempt bonds to buy gas under long-term contracts, according to data compiled by Bloomberg. The bonds are paid back with revenue the utilities bring in when the fuel is resold. In return for their commitment, the utilities receive a discount from the prevailing market price, which has tumbled about 42 percent since May.

Banks also benefit: They get the proceeds of the bond issue and pay it back over time through the delivery of gas. The bonds typically carry the ratings of the lowest-ranked corporate entities involved because of the risk investors won’t be repaid if the delivery contracts aren’t fulfilled.

That’s happened before. After Lehman Brothers Holdings Inc. collapsed during the 2008 credit crisis, more than $700 million of bonds issued by Main Street Natural Gas Inc. of Kennesaw, Georgia, defaulted as a result. Bondholders have recouped about 77 cents on the dollar.

The Lower Alabama district, which buys long-term natural gas for about 10,000 customers in southern Alabama, plans to sell $675 million of the fixed-rate debt as soon as this week. The bonds are rated A3 by Moody’s Investors Service, its seventh-highest investment grade, based on Goldman Sachs’s standing. Goldman Sachs guarantees that its subsidiary J. Aron & Co. will supply the gas.

Black Belt plans to issue $1 billion of such bonds next week in the biggest prepaid gas issue since 2012. The “Black Belt” is a region in Alabama known for its fertile, black topsoil and, before the Civil War, cotton plantations worked by African-American slaves.

The Black Belt bonds, which will be issued in fixed and floating rates, are rated Aa3 by Moody’s, it’s fourth-highest investment grade, because of RBC. Black Belt will sell the gas it purchases to districts in Alabama, Tennessee, Georgia and South Carolina.

“There’s a lot of demand,” said Joann Hempel, a Moody’s analyst. “These are a great opportunity for them to, one, lock down some supply and number two, they get this supply of gas at a discount to market prices.”

Albert Bean, a board member of the Lower Alabama district and co-general manager and chief operating officer of Black Belt, didn’t return calls seeking comment. John Norman, a managing director at Municipal Capital Markets Group Inc., which is advising both districts, declined to comment.

Tiffany Galvin, a Goldman Sachs spokeswoman, and Elisa Barsotti, a spokeswoman for RBC, declined to comment.

Time To Sell

On Feb. 1, Wells Capital sold $7.3 million of prepaid gas bonds issued by a San Antonio public corporation because spreads in the municipal market — or the difference in yield between benchmark and lower-rated securities — hadn’t widened as much as those in the corporate market, said Fitterer.

The debt maturing in 2025, which is backed by Goldman, traded at a yield of 2.55 percent, or about 0.9 percentage point more than top-rated bonds of the same maturity. Goldman Sachs corporate bonds maturing in 2022 traded on Feb. 16 at 3.29 percent, about 2.07 percentage point more than benchmark bonds.

“We sold because of where spreads were in our market relative to what’s been going on in the corporate market,” Fitterer said. “There was a buyer around and spreads actually moved quite a bit tighter.”
Municipal gas bonds are at risk of being affected by widening financial-sector credit spreads, which increased by as much as 90 basis points this year, Barclays municipal strategist Mikhail Foux wrote last week. He said the municipal debt is currently relatively expensive, with the yields the closest in more than a year to similarly rated bonds.

“While U.S. banks have not sold off in the same manner as their European counterparts, we think the sector could face near-term stress,” Foux wrote. “We recommend being cautious on this muni sub-sector in the near term. However, if yields adjust meaningfully higher, we would view it as a buying opportunity.”

Bloomberg Business

by Martin Z Braun

February 17, 2016 — 9:01 PM PST Updated on February 18, 2016 — 2:42 PM PST


Muni Yields at 50-Year Lows Make Buyers Wary of Calling Bottom.

Some of the biggest municipal-bond buyers have stopped trying to call the market’s peak.

Just 38 months after tax-exempt yields touched the lowest since 1965, they’re back at that level following a rally in the safest assets as investors seek havens from the global financial turmoil. For BlackRock Inc., Nuveen Asset Management and Vanguard Group Inc., which combined oversee some 10 percent of the $3.7 trillion municipal market, the plan is to keep buying — and avoiding large bets one way or another on where interest rates move next.

“Calling rates is not easy — you have a flight to quality going on, and trying to call that turning point is oftentimes difficult,” said Chris Alwine, head of muni funds in Malvern, Pennsylvania, at Vanguard, which oversees $155 billion of the debt. “That’s really the debate going on in munis right now: You’re dealing with macro forces that are forcing rates lower, and then muni factors indicate there’s some vulnerability in the market. When we put that all together, we’re positioned more neutrally.”

China’s economic slowdown and plunging oil prices have buffeted global equity markets, sending the Standard & Poor’s 500 Index down by more than 7 percent this year. Seeking to avoid stock-market losses, individuals have poured $4.7 billion into mutual funds focused on state and local-government debt this year, extending a 19-week stretch of inflows, Lipper US Fund Flows data show.

The yield on a Bond Buyer index of 20-year municipal general-obligation bonds fell last week to 3.27 percent, matching rates reached in December 2012 for the lowest since 1965. Top-rated 10-year munis yield 1.6 percent, just above the low hit in late 2012, according to data compiled by Bloomberg.

With investors shunning risk, not all securities have benefited equally from the rally. The yield difference between 10-year bonds rated BBB, the lowest tier of investment-grade ranks, and AAA debt last week reached 1.06 percentage points, the widest since November, Bloomberg data show. The spread between A rated revenue bonds and top-rated debt hit 0.64 percentage point, the widest since August 2014.

“We have to focus on relative value analysis because we cannot predict the absolute value,” said John Miller, co-head of fixed income in Chicago at Nuveen, which manages more than $100 billion of munis. “We can’t sit back and say we don’t buy bonds unless they yield more than” a certain amount.

Bets on higher interest rates from the Federal Reserve this year mostly have been thrown out the window, two months after the central bank raised its target for the first time since 2006. Bond traders are pricing in a 40 percent chance that the Fed will raise rates by year-end, futures indicate. Just months ago, the major debate was over how many times the central bank would raise borrowing costs this year.

One threat to the recent price gains is the prospect that sales of new bonds may increase. Issuance in March has exceeded that in January and February each year since 2012, Bloomberg data show. Because of that trend, benchmark 10-year yields have increased during the month in six of the past seven years.

“We’re being pulled lower in yield by Treasuries, the question is do we get pushed higher in muni rates in terms of issuance?” said Peter Hayes, head of munis at BlackRock, the world’s largest money manager, which oversees $110 billion of the debt. He said the company is slowing muni purchases until supply picks up.

Alwine, Hayes, Miller and their peers can’t afford to wait around too long with money flowing into their funds and the broad market. Individuals have added $6.8 billion to muni funds since the Fed lifted interest rates on Dec. 16, the Lipper data show. Since then, benchmark 10-year muni yields have declined by almost half a percentage point.

“Investors are more comfortable now with the fact that rates aren’t going to spike up significantly,” Hayes said. “They realize they need to get invested. There’s an opportunity cost of sitting in cash too long.”

Bloomberg Business

by Brian Chappatta

February 16, 2016 — 9:01 PM PST Updated on February 17, 2016 — 5:58 AM PST


SIFMA Releases Electronic Bond Trading Platform Report For U.S. Corporate and Municipal Securities.

New York, NY, February 17, 2016 – SIFMA today released the results of its survey of electronic bond trading platforms for U.S. corporate and municipal securities. The survey results highlight a fixed income market structure that is evolving and adapting given regulatory and market constraints, and reflects a significant market focus on electronic trading as an emerging part of fixed income market structure. At this stage, the survey revealed that the platforms have primarily focused on the corporate bond market which has approximately $8 trillion outstanding and over $1.4 trillion issued in each of the last three years. Platforms have deployed innovative solutions to improve pre-trade price transparency as well as address various dimensions of the liquidity challenges in fixed income markets.

“Fixed income electronic trading platforms are investing in new technologies and finding innovative and creative ways in which to both aid price discovery and to enhance access to market liquidity,” said Randy Snook, executive vice president, business policies and practices at SIFMA. “This report is intended to provide useful information to market participants about the existing and a number of emerging electronic trading platforms and trade execution protocols, as increased competition among the players shapes this space. The information from this survey will help to inform a constructive dialogue around fixed income market structure with both market participants and policy makers.”

The survey provides profiles of electronic bond trading platforms and includes information on the target markets, trading protocols, technology interfaces, planned enhancements and related capabilities. It is provided to give stakeholders a greater understanding of the changing electronic trading marketplace.

Key takeaways include:

The report is available here.

Release Date: February 17, 2016
Contact: Katrina Cavalli, 212.313.1181, [email protected]


Obama's Last Budget: The Breakdown for States and Localities.

The president’s budget outlines ambitious spending proposals in health care and infrastructure — though their likelihood of passing is slim.

Every budget is about winners and losers. In that regard, President Obama’s final budget is a $4 trillion mixed bag for states and localities.

Many of his proposed initiatives would benefit urban areas, which won him praise from some but criticism from others who say such help would come at the expense of rural America.

Looking at the big picture, the proposed budget maintains the agreement reached last year that helped states and localities by lifting automatic cuts on discretionary spending, which are known as sequestration cuts. The budget also outlines ambitious spending proposals in health care and infrastructure — two key financial pressure points for state and local governments.

But getting such proposals through Congress looks tough, if not impossible. The president’s fiscal 2017 budget, unveiled on Tuesday, would pay for many new spending initiatives by imposing new taxes on the wealthy, as well as putting a new $10.25 per barrel tax on crude oil.

In a rare move, neither the Senate nor House budget committees have asked Shaun Donovan, the director of the Office of Management and Budget (OMB), to testify about the package. Other committees will hold hearings for agency budget requests, but the House and Senate are crafting their own proposals without apparent regard for what OMB might have to say.

Still, Obama’s spending plan will likely shape the debate in Congress to some extent this year. As the congressional spending season gets underway, it will provide a blueprint for approaching many domestic programs.

Here are some of the main budget policies that would impact states, cities and counties:

Health Care
States would see some financial relief under Obama’s proposal, which sends new money directly to them.

The budget calls for $1.1 billion over two years to combat opioid abuse, including $920 million to help states provide medication-assisted treatment. It also calls for $90 million to help states expand programs to prevent prescription drug overdoses, particularly in the rural areas that have been hit hardest by the epidemic.

The budget would also extend the period in which the federal government will pay 100 percent of the cost of providing Medicaid coverage to individuals made eligible by the Affordable Care Act. The grace period would temporarily ease, or at least delay, the rising health-care costs many states are facing.

Water
The budget would provide $267 million in funding for water security initiatives, helping states in the South and West deal with a historic drought. Obama’s proposal would also fund a national research center to study ways of making desalination — the process that makes seawater drinkable — more affordable and efficient so it could be used on a larger scale. Another program would give money to the U.S. Geological Survey to help develop real-time water data so consumers and utilities can monitor their usage and learn how to consume less.

But Oklahoma Sen. Jim Inhofe, a Republican who chairs the Senate Environment and Public Works Committee, chastised the president for collectively cutting more than $257 million from state revolving loan fund accounts. In a statement issued Tuesday, Inhofe accused the president of putting “cities and rural communities and their basic infrastructure needs at the bottom of his priority list.”

Transportation and Roads
Driverless cars are the future, according to this budget anyway. Obama is calling for a $4 billion investment over the next decade for the testing of self-driving cars because of their potential to reduce pollution, traffic and accidents.

Meanwhile, the proposed $10-per-barrel fee on oil would help pay for $300 billion in new infrastructure investments. That idea was first floated last week, but Republicans have already panned it, saying the oil fee would be passed down to consumers and burden them with higher taxes.

The budget also strives for a regional approach to transportation. It would let metro areas get $10 billion worth of annual federal transportation money directly, rather than having it flow almost exclusively through states.

Tax Reform
The budget includes some staples from prior budgets, including a business tax overhaul that would clamp down on companies dodging U.S. taxes by sheltering profits in international holdings.

The president’s plan also calls for a new, partial tax on municipal bond interest — a proposal fiercely fought by state and local government associations because it would likely lead to higher interest rates.

Obama is also promoting the idea of America Fast Forward Transportation Bonds, which would be a taxable municipal bond that would encourage more private investment in public infrastructure. Kenneth E. Bentsen, Jr., the president and CEO of the Securities Industry and Financial Markets Association, applauded the Fast Forward Bonds, but he said eliminating muni bonds’ tax-free status would ultimately discourage investment in infrastructure projects and stifle job creation.

Agriculture
Obama has again looked to crop insurance and other farm subsidy programs for cuts, potentially saving $18 billion over 10 years. But the cuts stand little chance of passing into law. House Agriculture Committee Chairman K. Michael Conaway, a Texas Republican, immediately fired off a statement saying Obama’s plan deals “a severe blow to America’s farmers and ranchers who have already suffered a 56 percent drop in net farm income over the past two years.”

Homelessness
Sticking with his goal to end family homelessness by the end of the decade, Obama calls for $11 billion to help families find permanent housing. That includes expanding the rapid rehousing and Housing Choice Vouchers programs that help families find affordable housing. Still, many have criticized the administration for not going far enough to restore significant cuts these programs suffered under sequestration.

GOVERNING.COM

BY LIZ FARMER | FEBRUARY 9, 2016


Visible Hand.

With Neighborly, Jase Wilson meshes crowdfunding and bond markets to change how cities are built.

For someone who has devoted his life to helping cities, Jase Wilson MA ’08 grew up in a decidedly small town. Maryville, Missouri, has a population of 12,000 people, with civic life revolving around “farms, factories, and football.” Its one claim to fame is that it is the birthplace of Dale Carnegie, the promoter of American self-improvement, and Wilson followed in his footsteps as a self-taught whiz kid. “Most kids have a social life or play sports; I was in my bedroom taking apart computers and figuring out how circuit boards fit together,” he says.

His diligence earned him a free ride to attend engineering school. But during a visit to the University of Missouri at Kansas City, he happened on a pamphlet about “Urban Planning and Design.” After a 20-minute conversation with the department head, he was hooked on cities — structures as intricate as the most complex circuit board. “Cities are the sum of all other endeavors,” Wilson says. “They are co-created by the wants and desires of all the people inhabiting them. There are so many forces at work.”

Understanding those forces — and harnessing those desires — has become Wilson’s life work, culminating four years ago in the creation of Neighborly, a “community investment platform” that seeks to apply small-town values to big-city development. When fully up and running, it will allow citizens to directly fund community projects, from skate parks to elementary schools. If public finance may not seem sexy, consider this: much of the urban infrastructure we see daily — schools, highways, bridges, hospitals, water and sewer systems, and public housing — is funded through municipal bonds. It’s a $3.7 trillion market, with some $1 billion changing hands daily, and yet the ordinary citizen has little say about how it operates.

“If people knew they could invest in a street or school down the street, they would do that in a heartbeat,” contends Wilson. “They don’t because the market has been made very, very complicated by a handful of global banks who make a profit off making it as complicated as it can be.” These banks buy bonds in large blocks, too expensive for the average consumer, and resell them to brokers and large institutional investors, who may then resell them again as shares in bond funds for which they can charge large commissions.

Neighborly, by contrast, would take a page from Kickstarter by allowing citizens to buy a single bond, for an amount as low as a few hundred dollars, directly from a municipality. At the same time, it would enable cities to fund projects that communities want without having to appeal to the fickle interests of the bond markets. “We see a world in which anyone can invest in anywhere, and places can borrow money to finance the things they want and need directly from the community,” Wilson says.

Wilson has long worked to use technology to make cities run better. As a grad student in MIT’s Department of Urban Studies and Planning (DUSP), he went beyond the urban design training of his undergraduate education to think big about how cities function. “DUSP offered a far broader range of perspective on how cities evolve from the collective imagination, and how they both solve and exacerbate complex social problems,” he says. Case in point: the frustrations he heard while sitting in on meetings of low-income community groups in the Boston area. “Listening to their conversations about trying to put together money for various ideas that would help elevate their community, and seeing how they were on the losing end of an uneven distribution of tax dollars, made a big impression on me,” he says.

After graduation, Wilson focused on a company he founded to develop open-source software for cities to communicate with and gather data from citizens. His introduction to public finance was in 2011, when he was invited to speak at a conference at DUSP on urban planning and technology organized by Robert Goodspeed PhD ’13, where another speaker showed an example of a park that had recently been built through crowdfunding in the United Kingdom. “That MIT conference planted a seed,” he says.

Wilson began thinking more deeply about how crowdfunding could be harnessed on a larger scale. “Even after 10 years of studying cities, I was in the dark in terms of how cities were funded,” he admits. “There was always this sense that there was this weird invisible force that guides the shape of what we build.” A few weeks later, he sat down with Patrick Hosty, a municipal bond trader in Kansas City, and the lightbulb went off. They began putting together a plan for a platform that would combine crowdfunding and bond markets.

The idea of borrowing from individuals to fund civic projects goes back to the Medicis of Renaissance Italy, but the municipal bond is a distinctly American invention, starting in the 1800s when a group of citizens passed the hat to finance construction of a canal in New York, giving themselves IOU’s for repayment. Neighborly seeks to return the market to those roots, by creating a platform in which individuals can search for localities or interests, such as education or the environment, in which they would like to invest.

Municipal bonds are generally seen as low-risk investments and have the benefit of being tax-free, giving them a leg up on mutual funds and stocks. “A municipal bond with a 5 percent return could be the equivalent of another investment yielding 7.5 percent, and an order of magnitude less risky,” Wilson says. Just as important, however, the platform provides investors with projects to which they can feel personally connected. “You know exactly what you just built, because you can reach out and touch it,” Wilson says. “That’s different than putting money in a stock or corporation.”

As proof of demand, he points to a bond offering by Denver last August, in which it crowdfunded $12 million, in increments of $500, of $550 million to improve city roads and buildings. The bonds sold out in 16 minutes. So far, Neighborly has conducted a test project in a small school district in California, buying $2 million of a $20 million offering and selling it in $500 shares to early investors.

After struggling to raise seed funding for his company in Kansas City, Wilson reluctantly moved it to San Francisco last year. The move paid off; in September, Neighborly announced that it had raised $5.5 million from Silicon Valley venture capitalist Joe Lonsdale and actor-turned-investor Ashton Kutcher, who made Neighborly one of the first investments of his VC firm Sound Ventures.

In the first part of 2016, the company plans to roll out bonds for several other school projects in the Bay Area, where there is interest by Silicon Valley investors both in giving back to the community and finding tax-free havens for their money. But Wilson is hardly stopping there. “Eventually we want to be interplanetary. Mars will require many projects to get off the ground.”

Celestial bodies aside, Wilson is hoping that Neighborly can be an investment win-win, giving people a chance to build up their cities while keeping money in their communities. “It feels so good to jump out of bed every morning and know you are building this thing that’s in the service of civic visionaries,” says Wilson, “taking the decision making out of the hands of that invisible force and putting it back into the service of people.”

MIT News

Michael Blanding | School of Architecture and Planning

February 8, 2016


Meet the Canadian Who Developed a Ranking System for All 3,141 U.S. Counties.

John McLean said he developed an interest a few years back when he became aware of the information gaps that existed in the U.S. municipal bond market.

If nothing else the numbers are staggering — two million data points.

But that’s the outcome when you set out to the build the first of its kind in the U.S., a ranking system based on social and economic factors for all of the 3,141 counties in that country.

In all, the rankings, compiled in Canada, are based on 36 data inputs. There’s information on demographics; environment (including data on climate change and declarations of disaster); home ownership; real estate taxes; social indicators (including education and crime levels) and personal infrastructure (such as levels of police and teaching.) That information came from more than a dozen different government or government-related sources.

Known officially as The American County Review (ACRe), the work represents more than eight months of toil by John McLean, who for the past 23 years had focused his attention on bond analytics, bond pricing and developing bond indexes, initially at Scotia Capital and most recently with the Toronto Stock Exchange.

“There are 36 different measurements used for each county. We roll those up on an equal weight basis, and that’s how you get the top ranking within the state and [then] in the nation,” said McLean who developed the product to assist individuals and institutions make important living and investment decisions.

McLean, who has filed a patent on his work, called the past eight months a “labour of love.” He said he developed an interest a few years back when he became aware of the information gaps that existed in the U.S. municipal bond market. The muni-market is huge – almost US$4 trillion outstanding – with many issues being done on a tax-exempt basis.

“It seemed that ratings on municipal bonds were often assigned but never reviewed or updated,” said McLean, who then set out to develop a unique and non-arbitrary risk assessment of issuers at the county level. (Apart from county government issuers, school boards, redevelopment agencies, school districts, and publicly owned airports and seaports also issue.)

News that the rating agencies “may not be on top of their game, and may not be doing their best,” surprised McLean. “I always thought there was a better way, an easier way and a more frequent way to measure than [that done by the] rating agencies which is very subjective.”

In other words, he would target the U.S. municipal market by developing a better model, by providing better services but do it in a manner that is transparent and open.

“By looking at all the different economic and social factors, that are not interpretative, you get a good picture of what’s going on,” he said. Such information could be used for both individuals and corporations to make decisions.

“It works both ways,” said McLean. “It’s not just a case of attracting attention in investment because you are ranked high. You are trying to get more information into the hands of people who make those decisions.”

So who is going to purchase McLean’s product? The data providers — Thomson Reuters and Bloomberg — are a possibility as are commercial real estate investors; muni-bond issuers, investors and ratings agencies. Another possibility is to use the information to develop so-called Smart Beta bond indexes. Meantime users can obtain a free look at some data on the website www.acredata.com.

So what are the three top ranked counties with above 100,000 populations? Hamilton (Ind.); Sumter (Fla.) and Weld (Col.).

Financial Post

Barry Critchley | February 9, 2016 | Last Updated: Feb 10 12:39 PM ET

[email protected]


Fox Rothschild: Lower Oil Prices Lead To Significant Public Finance Issues.

For months, I have been telling people that while we all love paying less at the pump for our gasoline, lower oil prices will have significant consequences in the broader economy. North Dakota’s budget process this week provides a prime example.

On Monday, North Dakota Governor Jack Dalrymple ordered most state agencies to cut their budgets by a little more than 4% in an effort to cover a $1 billion revenue shortfall that the Williston Herald characterizes as “unprecedented.” The consensus opinion is that the decreased revenues from the production and sale of oil in the state, stemming from lower oil prices, is responsible for the bulk of the revenue deficit.

North Dakota’s state agencies will have to make their budget cuts by February 17, and those cuts are said to be the largest in raw dollars in the state’s history. Furthermore, the state is planning to draw $497.6 million from the state’s Budget Stabilization Fund, leaving only around $75 million “in the rainy day fund for what [the Governor] called the ‘unlikely event’ that the July revenue forecast would be even worse.”

In addition, some North Dakota officials have speculated aloud that the budget shortfall will put pressure on the legislature to tap into the state’s $3.5 billion trust fund for oil taxes.

There can be no doubt that the budget cuts for state agencies are going to have material impacts on some of the state’s services and we fear that those affected often are the one most dependent on those services. There also is no doubt that North Dakota is not the first state or local government struggling with decreased revenues as a result of lower oil and natural gas prices; nor will it be the last.

Lower prices for consumers are nice but we all should be aware of the unpleasant consequences associated with lower commodity prices. Lower prices don’t just mean lower profits for oil and gas companies, but also raise material concerns for real people. We think the industry should do a better job of making people aware of those issues.

The content of this article is intended to provide a general guide to the subject matter. Specialist advice should be sought about your specific circumstances.

Article by Jack R. Luellen

Fox Rothschild LLP

Last Updated: February 7, 2016


NABL: President Releases FY 2017 Budget Proposals.

On February 9, 2016, President Obama released his fiscal year (FY) 2017 budget proposals. The budget proposes an increase in the Internal Revenue Service (IRS) budget, including funds earmarked for enforcement, although the budget documents mention enforcement areas outside of tax-exempt bonds, such as transnational organized crime and the Foreign Account Tax Compliance Act. The budget also proposes increases to the U.S. Securities and Exchange Commission (SEC) budget, with a goal of doubling the SEC budget in five years. The budget also includes the Administration’s proposal from late last year to give all territories and their subdivisions, including Puerto Rico, access to bankruptcy. The tax policy proposals in the budget are substantially the same as the proposals included in last year’s budget.

The President again proposed to limit to 28 percent the benefit of certain tax preferences, including tax-exempt interest.

The President also again proposed a new category of private activity bond, Qualified Public Infrastructure Bonds (QPIBs). QPIBs would be available for certain governmentally-owned exempt facilities and would not be subject to volume cap or the alternative minimum tax. QPIBs would expand the safe-harbor for governmental ownership to allow for greater private business use to encourage public-private partnerships.

The President has also re-proposed a new direct-pay bond program, America Fast Forward (AFF) bonds. As before, the permissible uses would include nearly all of the current uses of tax-exempt bonds, such as private activity bonds and short-term capital needs, and would also include the new QPIBs. However, while AFF bonds could be used for current refundings, they could not be used for advance refundings. As with last year’s proposal, AFF bonds would be exempt from sequestration and the credit rate for AFF bonds would be 28 percent.

The other bond-related proposals in the budget include:

A description of the proposals is contained in the Treasury Department’s Green Book, which is available here.


S&P’s Public Finance Podcast (How Flint’s Water Crisis Affects Michigan and Our Outlook for the Water-Sewer Sector).

In this week’s Extra Credit, Associate Director Carol Spain discusses Flint’s water crisis and its potential implications for the state of Michigan, and Senior Director Ted Chapman explains our revised U.S. municipal water-sewer criteria and the outlook for the sector.

Listen to the Podcast.

Feb. 8, 2016


S&P’s Public Finance Podcast (U.S. Not-For-Profit Cultural Institutions and the Commonwealth of Massachusetts’s Budget).

In this week’s Extra Credit, Director Charlene Butterfield provides an overview of our recent report on cultural institutions and our outlook for the sector, and Senior Director Dave Hitchcock explains why we view the Massachusetts budget proposal as a step in the positive direction.

Listen to the Podcast.

Feb. 12, 2016


S&P: The Supreme Court Stay Of The Clean Power Plan Adds Uncertainty But Has No Immediate Rating Impact.

On Tuesday, Feb. 9, the U.S. Supreme Court temporarily halted the Environmental Protection Agency’s (EPA) implementation of the Clean Power Plan (CPP) while an appeals court considers various challenges to the plan, which aims to dramatically reduce greenhouse gas emissions in the U.S. Given that oral arguments in the key lawsuit will not occur until early June, it’s likely that the EPA will not be permitted to continue implementing the CPP until 2017, under a new U.S. president and EPA administrator.

That said, the temporary stay does not actually negate the CPP, nor does it shed much light, in our opinion, on whether or not the Supreme Court (and any lower courts) may overturn it. It strictly provides the Court (and the industry, by extension) more time to react to the rule prior to implementation, without bearing any of the economic impacts of implementation. However, some legal observers believe the stay could signal judicial concerns about the structure of the CPP, despite the EPA’s established authority to regulate carbon emissions.

Continue reading.

12-Feb-2016


S&P Continues to Monitor the Credit Quality of U.S. Public Power and Cooperative Utilities With Carbon Exposure.

NEW YORK (Standard & Poor’s) Feb. 12, 2016–Standard & Poor’s Ratings Services today said that the U.S. Supreme Court’s Feb. 9, stay of the implementation of the Environmental Protection Agency’s (EPA) Clean Power Plan (CPP) is unlikely to affect the ratings on those public power and electric cooperative utilitiesthat would need to reduce carbon emissions to comply with the regulation.

In what many have categorized as an extraordinary order, the Supreme Court stayed the implementation of the EPA’s regulation pending proceedings in the Court of Appeals for the D.C. Circuit. The circuit court will assess the merits of plaintiffs’ efforts to invalidate the CPP. The Supreme Court’s order, containing fewer than 150 words, did not indicate the rationale underlying its decision.

The EPA finalized its CPP carbon emission regulations in August 2015. The CPP calls for reducing U.S. power plants’ carbon dioxide emissions 32% by 2030 relative to 2012 benchmarks. Compared with the national reduction target of 32%, each state has individual mandates that vary greatly. The state-by-state standards reflect significant regional differences in the mix of fuels their utilities use to generate electricity. The rule directs states to file initial implementation plans by Sept. 6, 2016, and final plans by September 2018. States failing to meet these milestones will be subject to federally designed implementation plans.

If the Supreme Court’s stay postpones the state implementation plans’ September 2016 delivery date, it might also defer the rule’s financial impacts on utilities. With or without a delay, we do not view the rule’s financial pressures as imminent because the regulations do not require utilities to meet interim compliance goals until 2022. The rule’s pathway to a 32% national reduction in carbon emissions includes interim reduction targets spanning 2022-2029.

Standard & Poor’s is unable to predict the outcome of the legal proceedings challenging the CPP and will continue to monitor those proceedings to discern their impact. As we noted in our commentary, “The EPA’s Clean Power Plan Is Not An Immediate Credit Threat To U.S. Public Power And Co-Op Utilities, But Uncertainties Remain” (published Oct. 20, 2015, on RatingsDirect), we believe that the EPA’s carbon emissions rules will not lead to lower ratings during our two-year outlook horizon.

Standard & Poor’s Ratings Services, part of McGraw Hill Financial (NYSE: MHFI), is the world’s leading provider of independent credit risk research and benchmarks. We publish more than a million credit ratings on debt issued by sovereign, municipal, corporate and financial sector entities. With over 1,400 credit analysts in 26 countries, and more than 150 years’ experience of assessing credit risk, we offer a unique combination of global coverage and local insight. Our research and opinions about relative credit risk provide market participants with information and independent benchmarks that help to support the growth of transparent, liquid debt markets worldwide.

We have determined, based solely on the developments described herein, that no rating actions are currently warranted. Only a rating committee may determine a rating action and, as these developments were not viewed as material to the ratings, neither they nor this report were reviewed by a rating committee.


Contradictory Pension Reports.

Two groups published studies this week looking at whether traditional pensions or 401(k) plans are better for teachers and came up with … exactly opposite conclusions.The University of California at Berkeley looked at the state’s teacher pension system (CalSTRS) and found that for the “vast majority” of California teachers (six out of seven), a defined-benefit pension provides more secure retirement income than a 401(k)-style plan.

The study also concluded that pensions reduce teacher turnover, “which is better for students, reduces costly and time-consuming training, and increases teacher effectiveness.” It portrayed 401(k) and cash balance plans as bad for teachers because they place more risk on the retiree as their final benefit is not defined. Such plans also decrease the incentive for early and mid-career teachers to stay on the job, the report said.

Separately, TeacherPensions.org ran an analysis of teacher pensions in Illinois. It found that traditional pensions are not a good deal for teachers because they disproportionately favor those who stick around for 30 or 35 years, “at the expense of everyone else. The state plan assumes, and depends upon, the fact that the majority of teachers will not stay long enough to collect full benefits.” The report recommends considering other retirement plan options, such as the 401(k)-type plan offered to full-time staff at Illinois’ state universities.

Maybe this seeming contradiction isn’t that great a surprise. Consider the sources. It’s worth pointing out that TeacherPensions.org produces lots of reports that spell out the shortcomings of traditional pensions, while the Berkeley study was funded by CalSTRS.

Still, one lesson worth thinking about is that no two pension plans are alike. A key difference between the plans in Illinois and California is the so-called withdrawal penalty, which occurs when a teacher quits and opts out of the retirement system before reaching retirement age.

All states let teachers withdraw at least the automatic contributions taken from their paychecks, sometimes with interest — as is the case with California teachers. But Illinois has one of the most punitive withdrawal policies of any public retirement plan in the country. Illinois teachers who withdraw early don’t even get all their own contributions back in full. The state charges withdrawal tax, meaning they only get 89 cents back for each dollar taken out of their paychecks. No wonder the TeacherPensions.org authors conclude these pensions are a bad deal for most teachers.

GOVERNING.COM

BY LIZ FARMER | FEBRUARY 12, 2016


Rethinking the Game Plan for Stadium Bonds.

Is a 30-year bond realistic when the economic lives of stadiums are proving to be much shorter?

In the world of sports stadiums, 20 is the new 30.

Stadiums are typically financed through bonds that take 30 years to pay off. But their useful life isn’t always that long.

Just take last month’s announcement that the St. Louis Rams would be decamping to Los Angeles, leaving behind its 20-something football stadium for a shiny new one. The St. Louis Regional Convention and Sports Complex Authority is still paying off a portion of the $259 million in bonds it issued to build the Rams a new stadium when they moved from L.A. in 1995.

It’s not the only issuer paying off 30-year debt for a project that didn’t make it the full life of the bond. In Georgia, the Atlanta Falcons are moving to a new stadium next year even though the Georgia Dome is less than 25 years old. The San Antonio Spurs left the Alamodome in 2003, just 10 years after it was built.

With twice as many new stadiums being built over the next three years compared to the last few, it begs the question: Is a 30-year bond still realistic when the economic lives of stadiums are proving to be much shorter?

The basic answer, according to municipal analysts, is that it depends on the terms of the stadium deal. The St. Louis deal to woo the Rams away from L.A. is now regarded as one of the worst deals in football. That’s because in its leasing agreement with the team, St. Louis said its then-brand new Edward Jones Dome would remain in the top 25 percent of NFL stadiums. That meant the city had to pay for renovations to ensure the stadium operated at a “first-class standard.”

When the stadium fell out of the top quartile, that kicked off a legal battle between the team and city over what investments were necessary to bring it back into compliance. An arbiter sided with the Rams, but the city’s convention authority still refused to pay. As a result, the team’s lease converted to a year-to-year one, which ultimately spelled the end of the team’s tenure in St. Louis.

Giving a team that much leverage over a city is uncommon today, said Tamara Lowin, director of research at Belle Haven Investments. “The Rams deal is one of the reasons there are now requirements that teams stay as long as the bond is outstanding,” she said. If they don’t stay, these so-called non-relocation agreements force teams to pay hefty penalties.

Over the past two decades, governments have gotten more savvy in their negotiations with professional sports teams in other ways, too. Officials have been less inclined to foot the entire bill for stadiums when they see team owners benefitting from luxury suites and other high-price add-ons that increase the team’s valuation and put more money in owners’ pockets.

Meanwhile, a host of economic studies have shed doubt on the argument that sports facilities increase economic value for host cities. “All those factors made people on the public side say, ‘Do we really think this is a great investment?’” said Wells Fargo Securities Analyst Randy Gerardes.

Publicly financed football stadiums are an especially troublesome investment because of their sheer acreage and large seating capacity. It’s difficult to find uses for the infrastructure beyond the NFL season — although many stadium authorities have gotten better in recent years at eking revenue out of them. For example, pro stadiums now host college football rivalry games, international exhibition soccer matches and the occasional live concert with a pop star big enough to fill 70,000 to 90,000 seats.

But there are few meaningful uses of stadiums after their pro sports teams leave. In Houston, officials were able to repurpose the Astrodome for rodeos and concerts for several years until it was shut down in 2008 because of fire code violations. “Some publicly owned stadiums that have lost their professional sports team tenants have been effectively repurposed for collegiate or local use, yet these tend to be older assets with little to no debt outstanding [which lowers the facility’s operating costs],” said a recent Moody’s Investors Service analysis.

These are the kind of factors state and local officials are considering as the next round of stadium building kicks off. Most of these projects are likely to be a combination of public and private financing as publicly funded stadiums are no longer palatable.

For municipalities and states issuing bonds for these types of projects, Gerardes says a 30-year life is still reasonable — as long as the government installs safeguards to protect the stadium’s economic livelihood for the life of the bond. “I think that’s really how you’re going to get comfortable with this phenomenon,” he says. “You need to make it pretty iron-clad that the team has a big disincentive to move.”

GOVERNING.COM

BY LIZ FARMER | FEBRUARY 11, 2016


New York’s Subways Court Millennials With First Green Bonds.

The busiest U.S. mass transit agency, which carries 8.5 million people on a given weekday, wants to change that by joining a growing marketing push among local governments to pitch bonds to investors who are looking to do well by doing good. It’s planning to issue $500 million of so-called green bonds next week, the first time it’s offering securities certified for projects that help curb the pace of global warming.

“It’s a way to easily publicize programs they they’re doing that may fall under the public radar,” said Rob Fernandez, director of environmental, social and governance research at Boston-based Breckinridge Capital Advisors, which manages $24 billion. “The other benefit is that it’s seen to broaden their investor base.”

U.S. state and local governments have issued about $7.5 billion of green bonds since 2010, according to data compiled by Bloomberg. The designation is helping borrowers in the $3.7 trillion market appeal to buyers who use social factors such as the environment, education and health care to guide their decisions.

Last year, Columbia Threadneedle Investments, a unit of Ameriprise Financial Inc., started a U.S. Social Bond Fund, mainly composed of tax-exempt debt. TIAA-CREFF Financial Services and Calvert Investments have social and green-bond funds, respectively, though most of their holdings are taxable securities.

Green bonds are issued by development banks, such as the World Bank, municipalities, utilities and corporations. Eligible projects fall into eight broad categories, including renewable energy, clean transportation and sustainable water management.

That makes them applicable to the municipal market, which has financed public works for years without the acknowledgment of an environmentalist brand. In 2014, state and local governments spent $320 billion on transportation and water infrastructure, three times more than the federal government, according to the Congressional Budget Office.

The people who seem most interested in social-impact investing are millennials and women, said James Dearborn, head of tax-exempt securities at Columbia Threadneedle. Its bond fund owned $250,000 MTA debt as of Sept. 30 2015.

“As the baby boom generation ages and begins to pass away, then we end up with a wealth transfer that takes place and a lot of people who will be getting the wealth of the baby boomers will be women, who outlive men generally, and millennials,” said Dearborn, who declined to comment on whether he’d buy any of the transit agency’s bonds next week.

“Obviously mass transit is about reducing the carbon foot print — fewer cars on the road, more people in trains and buses and light rail,” he said. “Also, if you look at the generalized ridership of mass transit, by and large you’re supporting lower-income individuals whose only means of transportation is public transportation.”

Seattle’s transit agency, the Central Puget Sound Regional Transit Authority, issued about $940 million of green bonds in August, the largest-ever green muni issue. Proceeds were used to expand Seattle’s light-rail system and refinance higher-cost debt.

Says Who?

To comply with green bond principles, issuers need to show to non-profit standards setters like the London-based Climate Bonds Initiative how they determined the projects were eligible, ensure bond proceeds are spent on the designated projects and provide annual reports on the impact of the investments. Some issuers also hire outside consultants to review project selection and evaluation.

The MTA’s bonds, backed by system-wide revenue, will be certified under standards set by the Climate Bonds Initiative. The transportation agency hired Sustainalytics, an Amsterdam-based firm, to verify compliance with the guidelines.

“The certification process is a voluntary verification initiative which allows the MTA to demonstrate to the investor market, the users of the MTA’s transit and commuter systems and other stakeholders that the series 2016A bonds meet international standards for climate integrity, management of proceeds and transparency,” the MTA said in a preliminary bond offering statement.

The MTA’s subways, trains, and buses help reduce carbon emissions by getting commuters off the road. Two-thirds of New York state’s 19.7 million people live and work in the region it serves. The transit agency estimates it allows the region to avoid 17 million metric tons of carbon emissions, compared with the 2 million it produces to run the system.

“By leaving their cars at home and embracing mass transit, New Yorkers play a dramatic role in reducing carbon emissions,” MTA Chief Executive Officer Thomas Prendergast said in a statement.

While a green designation may help generate more demand by attracting environmentally-conscious investors, there’s no clear evidence that it lowers borrowing costs, said Vikram Puppala, an associate director at Sustainalytics.

“The formal green bond market allows investors who are already interested in investing in this product to identify them and be confident that the money is actually going to green projects,” he said.

Bloomberg Business

by Martin Z Braun

February 10, 2016 — 1:01 PM PST Updated on February 11, 2016 — 8:24 AM PST


Texas `Dirt' Bonds Make Comeback With Fewer Investor Protections.

Westlake, Texas, carved out a special district to borrow $26.2 million last year for a developer to lay the groundwork for a “European style village” with residential villas, hotels and a wedding chapel around an 8.3-acre lake.

The debt for the new community some 35 miles (56 kilometers) northwest of Dallas is part of a small but growing niche of the $9 billion Texas dirt-bond market that’s not bound by regulations that since the 1980s have protected buyers from the risks of a property-market crash. A record $211 million was raised last year by selling the public-improvement district debt, which allows developers to borrow before a project begins, making them akin to the securities issued in other states that defaulted during the last real estate crash.

“The risk to bondholders would be higher” in a housing-market rout, said Lisa Washburn, a managing director for Municipal Market Analytics in Concord, Massachusetts.

Following an influx of new residents that caused the population to swell by more than 1,000 a day, Texas’s local governments have been stepping up sales of municipal bonds that help transform vacant tracts into newly-minted homes and commercial developments. The flood of debt has paid for water lines, roads, parks and other infrastructure needed to keep up with the booming Texas economy, which has started to cool as the drop in oil prices ripples through the energy industry.


The real estate district bonds are paid off by a property tax, which is covered by residents after they move in. That can pose a risk to investors if the houses sit vacant, the developer doesn’t complete the project or it can’t meet the tax bills until they’re sold.

Most of the bonds issued for such developments in Texas have been through municipal-utility districts, which have faced heightened regulations since the housing crash of the 1980s pushed many to default. The 800 districts are regulated by the Texas Commission on Environmental Quality, require that developers make minimum investments before bonds can be sold, and have broad power to levy property taxes.

That’s provided security to bondholders. None of those districts missed debt-service payments in 2012 or 2016, years when Florida and Colorado borrowers had defaults rates from 1 percent to 15 percent, according to Municipal Market Analytics.

The public-improvement district bonds, which raise money for the same purposes, aren’t covered by those regulations. And their use has been on the rise: While only about $500 million have been issued since the structure was authorized by Texas lawmakers in the 1980s, $311 million of that was in the past two years. About a dozen districts sold them in 2015.

The securities tend to have lower credit ratings than their more heavily regulated counterparts or no ratings at all. While more than 60 percent of municipal-utility districts are in Moody’s Investors Service’s single-A rating category, most of the public-improvement district debt sold last year wasn’t ranked, according to Bloomberg data. Borrowers frequently forgo ratings if they’re unlikely to qualify for an investment grade.

Many public-improvement bonds issued last year were for suburbs ringing the Dallas-Fort Worth area, where rapid job growth has been driving housing starts and price gains to the highest level in a decade.

Shrinking Inventory

That area’s real estate market has been resilient despite the oil industry’s contraction. Last year, the inventory of houses for sale shrank 9 percent in north Texas after declining about 12 percent the year before, according to North Texas Real Estate Information Systems. In November, Dallas home prices were up 9.4 percent from a year earlier, according to the S&P/Case-Shiller index.

In Westlake, where Fidelity Investments is the largest employer with more than 5,000 workers, developers of the 85-acre Solana Public Improvement District are using the proceeds of the January 2015 sale for infrastructure needed to build homes and commercial buildings. That initial work will be done by August, said Sarah Dodd, spokeswoman for Centurion American Development Group, a developer.

When finished in a decade, Westlake Entrada, as it’s known, is slated to include 322 single-family villas and condos at prices ranging from $360,000 to $995,000, according to bond documents. Plans also include two hotels, restaurants, retail and office sites and an amphitheater, chapel and events center.

Dodd, the spokeswoman, said the risk to bondholders is mitigated by a “stringent” review of proposed districts by the local-government officials that establish them. “Due diligence is very comprehensive,” she said.

The arrangement allows the development to be built in a “way that doesn’t burden existing taxpayers,” said Amanda DeGan, Westlake’s assistant town manager.

The securities have offered high yields at a time when interest rates are holding near half-century lows. In November, the Jackson Ridge Public Improvement District in Aubrey, north of Dallas, sold $10.2 million of unrated bonds maturing in 2040 at a yield of 8.25 percent, more than twice as much as top-rated bonds. The Bayside Public Improvement District in Rowlett, another suburb of the city, is scheduled to sell $13.5 million of the debt next week.

The debt lets cities and counties to fund development without the cost. But some investors are hesitant to take on the risk that they may not be repaid if the housing market doesn’t hold up.

“It’s a legal structure that’s not dependable,” said Doug Benton, senior municipal credit manager for Cavanal Hill Investment Management, which manages about $6 billion. The firm doesn’t invest in public improvement district bonds. “The pledge is weaker.”

Bloomberg Business

by Darrell Preston

February 9, 2016 — 9:01 PM PST Updated on February 10, 2016 — 9:52 AM PST


Unlikely Beneficiary of Cheap Gas Turns Out to Be Highway Bonds.

Americans are paying less at the pump and more at the toll booth, making municipal bonds for highway projects one of the rare winners from the oil-market crash.

Tax-exempt toll-road and turnpike securities have gained 1.8 percent this year, outpacing the 1.6 percent return for the broad $3.7 trillion market, Bank of America Merrill Lynch data show. That’s extending a five-year run of out-performance for the bonds, the longest streak since the data begin in 2005.

The slide in gasoline prices is adding fuel to the rally in the muni-market niche, where state and local governments have sold $109 billion of debt tied to roads, bridges and tunnels that charge a fee. With more drivers hitting the road, the finances are looking brighter: In December, Moody’s Investors Service assigned a positive outlook to toll roads for the first time.


“If oil prices are low for a couple of years, it’s a great time to take advantage of some of these energy-dependent sectors like tollways,” said Justin Hoogendoorn, a managing director in Chicago at Piper Jaffray Cos., which recommends adding the securities. “We’re definitely seeing their revenues improve and it’s translating to tighter spreads.”

The cost of a barrel of oil has been cut by more than half since June, sending gasoline down to about $1.70 a gallon, the lowest since the depths of the recession seven years ago. That pushed the number of Americans traveling more than 50 miles (80 kilometers) above 100 million, a record, from Dec. 23 to Jan. 3, with 91 percent driving to their destination, according to a projection from the American Automobile Association.

Traffic will grow by a median 3 percent for the 45 toll roads rated by Moody’s, the company said in a December report. It raised its outlook on the segment to positive, citing a forecast of 5 to 6 percent increase in revenue this year, once toll increases are included.

Some have done even better than that. Collections at the Harris County Toll Road Authority in Texas soared by 12.9 percent in the 2015 fiscal year, while the Florida Department of Transportation’s turnpike revenue jumped 10.7 percent and the Pennsylvania Turnpike Commission saw a 7.8 percent increase, according to data compiled by Piper Jaffray. The three are among the 15 largest issuers of tollway securities, data compiled by Bloomberg show.

The securities offer higher relative yields as interest rates in the municipal market hold near the lowest since the 1960s. Harris County’s bonds due in 2034 traded Feb. 10 at a 2.55 percent yield, about 0.3 percentage point more than benchmark munis, Bloomberg data show. They were first sold in October for a yield of 3.08 percent, some 0.4 percentage point more than AAA debt. Harris County had more than $2 billion of highway debt outstanding at the end of August, according to bond documents.

“The fundamentals of some of the toll roads are improving — you’ve seen some spread compression, but we still think there’s some value there,” said Burt Mulford, a manager of tax-exempt funds in St. Petersburg, Florida, at Eagle Asset Management, which oversees $2.5 billion of state and local debt. “There’s more volatility in the revenue stream on toll roads because it’s based on economic conditions.”

Crude-oil futures on the New York Mercantile Exchange have plunged as supply worldwide exceeds slowing global demand. The price for a barrel has dropped about 26 percent this year to just over $27, holding near the lowest since 2003.

While a boon for toll roads, the slide from $100 a barrel in mid-2014 has wreaked havoc on budgets in states that count on oil-related revenue. Alaska, Wyoming, New Mexico, Louisiana, Texas and North Dakota are among the most-dependent on the energy industry, according to a report last month from Standard & Poor’s.

In Alaska, which last month lost its AAA rating from S&P, the state will collect only a third of the $5.2 billion of revenue initially expected for the fiscal year ending June 30. It may have to institute a personal income tax for the first time in 35 years to balance its budget.

Investors should sell bonds backed by municipalities that count on oil until public officials figure out how to combat the price decline, according to Hoogendoorn at Piper Jaffray. The extended drop suggests that the supply-demand imbalance isn’t a fleeting phenomenon, he said.

“Tollways are non-essential, and obviously you can have varying traffic,” Hoogendoorn said. “But ultimately, we’re going to drive, and with low gas prices, we’re going to drive quite a bit more.”

Bloomberg Business

by Brian Chappatta

February 11, 2016 — 9:01 PM PST Updated on February 12, 2016 — 4:09 AM PST


Replay: Exposure Draft U.S. Local Tax-Supported Ratings.

Senior Fitch analysts discussed the proposed criteria addition to our US local tax-supported ratings.

Listen.


Muni ‘Junk’ Is Seen as Treasure.

As concerns about interest rates, the economy and oil prices spooked junk-bond investors in the fourth quarter, one area of the risky debt market emerged as a relative flight to safety: municipal high-yield bonds.

Since October, nearly $300 million has flowed into the $1.9 billion Market Vectors High-Yield Municipal Index ETF (HYD), according to ETF.com. At the same time, $2.6 billion left the two largest high-yield corporate-debt ETFs.

HYD has a 4.3% yield—5.1% to 7.1% when the effect of reduced taxes are considered—and a 0.35% expense ratio. To get that yield, investors have to swallow exposure to lower-rated municipal credits, including the Chicago Board of Education, Puerto Rico, Jefferson County, Ala., and tobacco bonds across many states.

“Municipal yields are competitive for a risk profile that is fundamentally different” from corporates, says Jeff Weniger, senior strategist at BMO Private Bank in Chicago. “There may be long-term problems in a few areas,” he says, but corporate defaults, in comparison, can cascade across industries, regardless of location.

While 25% of HYD’s portfolio includes investment-grade bonds, nearly all of the holdings are revenue bonds, which depend on specific tolls or fees.

Moreover, HYD’s modified duration is 9.3 years, compared with 4.7 years for iShares National AMT-Free Muni Bond ETF (MUB), which invests only in investment-grade muni bonds. That means HYD is more sensitive to short-term interest-rate changes.

THE WALL STREET JOURNAL

By ARI I. WEINBERG

Updated Feb. 7, 2016 10:09 p.m. ET

Mr. Weinberg is a writer in Connecticut. He can be reached at [email protected].


GASB Issues Guidance on Blending Certain Component Units Into Financial Statements.

Norwalk, CT, February 11, 2016 — The Governmental Accounting Standards Board (GASB) today issued GASB Statement No. 80, Blending Requirements for Certain Component Units. The Statement is intended to provide clarity about how certain component units incorporated as not-for-profit corporations should be presented in the financial statements of the primary state or local government.

Statement 80 clarifies the display requirements in GASB Statement No. 14, The Financial Reporting Entity, by requiring these component units to be blended into the primary state or local government’s financial statements in a manner similar to a department or activity of the primary government. The guidance addresses diversity in practice regarding the presentation of not-for-profit corporations in which the primary government is the sole corporate member.

While this Statement applies to a limited number of governmental units, such as public hospitals, it is meant to enhance the comparability of financial statements among those units and improve the value of this information for users of state and local government financial statements.

The requirements of the Statement are effective for reporting periods beginning after June 15, 2016, with earlier application encouraged.


GASB Board Meeting Highlights.

Meetings of the GASB were held at the GASB offices in Norwalk, Connecticut on January 5–6 in accordance with the notice of meetings published in advance of the meetings. The minutes of the December teleconferences were formally approved at the January 5 meeting. The following topics were discussed: Leases; Blending Requirements for Certain Component Units; Irrevocable Split-Interest Agreements; Financial Reporting Model Reexamination; Debt Extinguishment Issues; and Implementation Guidance—Update.

Leases

The Board reviewed a preballot draft of the proposed Exposure Draft, Leases, and provided clarifying edits on the draft document. The Board tentatively decided that the Exposure Draft should propose that only governments whose principal ongoing operations consist of leasing assets to other entities be required to disclose future lease payments that are included in the lease receivable, showing principal and interest separately.

Blending Requirements for Certain Component Units

The Board reviewed a preballot draft of a final Statement, Blending Requirements for Certain Component Units, and provided clarifying edits on the draft document.

Irrevocable Split-Interest Agreements

The Board continued redeliberations and reviewed a draft text of the Standards section of a final Statement. The Board provided clarifying edits on the draft Standards section.
The Board also discussed respondent feedback requesting that the Board delay this project until the reexamination of Statement No. 33, Accounting and Financial Reporting for Nonexchange Transactions, and tentatively decided to proceed towards issuance of a final Statement.

Financial Reporting Model Reexamination

The Board continued discussion of three general approaches to the recognition of elements of financial statements and presentation for governmental fund financial statements. The three approaches discussed by the Board include near-term financial resources, near-term financial resources with current-period operating liabilities, and working capital (formerly referred to as short-term accrual). For each approach, the Board discussed the relationship with the objectives of financial reporting, messages conveyed by financial statements, recognition concepts, potential benefits and challenges, recognition of specific transactions, and pre-agenda research. After the discussion, the Board tentatively decided to further develop the near-term financial resources approach, working capital approach, and a working capital approach with a variation to recognition of post-employment benefits and compensated absences. The Board also tentatively decided to further explore the following four presentation alternatives for resources flows: statement of revenues, expenditures, and changes in fund balances (current format); cash flows statement categories; recurring transactions separated from one-time and limited-time transactions; and short-term (or current) activities separated from long-term activities.

Debt Extinguishment Issues

The Board discussed the scope of the project and tentatively decided that it should include consideration of (a) whether the use of solely existing resources placed into an irrevocable trust to retire a bond warrants defeasance accounting as provided in Statement No. 7, Advance Refundings Resulting in Defeasance of Debt, (b) the deferral treatment of the difference between the reacquisition price and the net carrying amount of the debt when existing resources are used in conjunction with refunding bond proceeds and when only existing resources are placed into an irrevocable trust to retire bonds, (c) disclosure requirements related to items (a) and (b), and (d) the treatment of prepaid insurance related to a refunded bond.

Implementation Guidance—Update

The Board considered issues raised by respondents to the Exposure Draft, Implementation Guide 20XX-XX. The Board considered modifications to some proposed questions in response to these issues. The Board did not object to the proposed modifications and provided other suggestions to clarify the content of the materials. The Board tentatively decided to exclude from the Implementation Guide proposed Questions 4.69 and 5.37.


GASB Proposes to Establish a Single Approach for Reporting Leases of State and Local Governments.

Norwalk, CT—February 8, 2016 — The Governmental Accounting Standards Board (GASB) today issued a proposal to establish a single approach for state and local governments to report leases based on the principle that leases are financings of the right to use an underlying asset. Limited exceptions are provided in the draft guidance, including short-term leases (12 months or less) and financed purchases.

The proposed Statement would provide guidance for lease contracts for nonfinancial assets—including vehicles, heavy equipment, and buildings—but exclude grants, donated assets, and leases of intangible assets (such as patents and software licenses).

Under the Exposure Draft, Leases, a lessee government would be required to recognize a lease liability and an intangible asset representing its right to use the leased asset. A lessor government would be required to recognize a lease receivable and a deferred inflow of resources.

A lessee also would report the following in its financial statements:

A lessor also would report the following in its financial statements:

“This proposal would more closely align the accounting and financial reporting for leases with the substance of these arrangements,” said GASB Chair David A. Vaudt. “Establishing a single model for reporting governmental leasing agreements should result in greater transparency and usefulness for financial statement users and reduced complexity in application for state and local government preparers and auditors.”

Other issues addressed in the Exposure Draft include accounting for lease terminations and modifications, sale-leaseback transactions, nonlease components embedded in lease contracts (such as service agreements), and related-party leases.

The Exposure Draft — and a high-level GASB in Focus overview — is available on the GASB website, www.gasb.org. Stakeholders are encouraged to review and provide comments by May 31, 2016. The GASB will host a public hearing on the Exposure Draft on June 29, 2016. Additional details, including instructions for registering to participate or observe, are highlighted in the document.


EPA’s Financial Technical Assistance Designed to Spur Community Water Infrastructure Projects.

The U.S. Environmental Protection Agency (EPA) is providing funding and guidance to communities to help them develop effective investment strategies, which can include various types of partnerships, to improve their drinking water and wastewater management infrastructure.

Through its WaterCARE program, EPA will spend a total of $500,000 to provide 10 communities with financial and technical support which will include assistance in developing rates, revenue and affordability analyses, asset management practices, water efficiency studies, resiliency assessments, and financing and funding options.

The communities that were chosen to receive this assistance have populations of less than 100,000 with below-average median household incomes, face public health challenges, and/or are able to undertake water infrastructure projects. The results of successful projects will be shared with other communities that have similar water infrastructure development needs.

The WaterCARE program participants are:

The WaterCARE program is one of several initiatives being conducted by EPA’s Water Infrastructure and Resiliency Finance Center, “which works with on-the-ground partners to provide financial technical assistance to communities,” EPA explained.

The Clean Water State Revolving Fund (CWSRF) program, for example, is a federal-state partnership that provides communities a permanent, independent source of low-cost financing for a range of water quality infrastructure projects, which can be conducted through P3s. In connection with this, the center is launching a State Revolving Fund Peer-to-Peer Learning Program with the Council of Infrastructure Financing Authorities and engaging in other SRF outreach on state-of-the-art practices.

The center is conducting a Water Infrastructure Public-Private Partnership and Public-Public Partnership Study and local government training with the University of North Carolina Environmental Finance Center and West Coast Exchange.

The center is also working with its partners to promote the use of new tools such as EPA Region 3’s “Community-Based Public-Private Partnerships (CBP3) Guide for Local Governments,” which helps communities explore alternative market-based tools, P3s and other funding sources to build and maintain integrated green stormwater infrastructure.

NCPPP

By Editor

February 4, 2016


How Oil States Are Dealing With Sinking Prices and Revenue.

Oil prices are now at their lowest level in 12 years — below $30 a barrel. That’s great news for consumers, but not for the states that depend on oil tax revenues.

The falling price of oil, which has declined more than 60 percent since June 2014, has some states scrambling. With no end in sight, states that are more dependent on the industry simply can’t replace the revenue by withdrawing from their substantial rainy day funds.

Oil, natural gas and mining account for about 10 percent or more of gross domestic product in eight states: Alaska, Louisiana, New Mexico, North Dakota, Oklahoma, Texas, West Virginia and Wyoming. Last year, total tax revenues in the eight states declined by 3.2 percent, according to a new analysis by the Nelson A. Rockefeller Institute of Government. In contrast, the remaining 42 states reported a 6.5 percent increase in total tax revenues.

Although most of these states tend to budget conservatively, the good years for oil had an impact on their finances.

“As oil went up in price, so did budgets and spending,” said Roy Eappen of Wells Fargo Securities. “I think now they’re realizing — if they didn’t before — that they can’t assume oil is going to bounce back.”

As these states consider changes to address the revenue shortage, their potential solutions vary widely — from a complete financial overhaul to minor budget tweaks.

The Poster Child: Alaska

Alaska’s situation is the most precarious because it’s the only state that directly funnels much of its oil revenue into its operating budget. Until recently, high oil revenues paid for up to 90 percent of the state’s operating costs and allowed Alaska to beef up its rainy day reserves to about $17 billion — enough to cover more than two full years of state expenses.

But in 2015, the state withdrew $2.8 billion from its rainy day savings to close a budget gap. This year’s budget relies on a $3.4 billion withdrawal despite cutting about $1 billion in spending. In the past year, the state’s total tax revenue has dropped by two-thirds. Last month, Standard & Poor’s downgraded the state’s credit rating from a top-rated AAA to AA+ and warned it could be downgraded again.

In response, Gov. Bill Walker has proposed completely revamping Alaska’s revenue system. His fiscal 2017 budget, which starts July 1, includes the state’s first income tax in more than three decades. While small — about 1.5 percent for most Alaskans — the tax likely won’t be popular with residents.

Walker’s budget proposal would also restructure the state’s $47 billion Permanent Fund, a low-risk investment fund that’s fed by about one-quarter of the state’s oil revenue and pays an annual dividend to residents. The state would seize the fund, increase the amount of oil revenue going toward it by half and put the fund’s investment earnings toward future operating budgets. The other half of oil revenue would be used for residents’ dividends. This year’s payments were about $2,000; under Walker’s proposal, payments would likely be cut to $1,000.

Looking Long in Louisiana

In Louisiana, the drop in oil prices has merely exacerbated the state’s longstanding structural budget issues. Many say the state’s budget imbalance started during its building boom and revenue surge following Hurricane Katrina in 2005. Instead of socking the money away in a rainy day fund, the state cut income taxes. Between that and the economic downturn, the state has struggled to meet revenue expectations ever since.

The previous administration tended to rely on one-time fixes to balance the budget. But that approach won’t work for Gov. John Bel Edwards, who just inherited an estimated $750 million shortfall in the current fiscal year, which ends June 30. Next year’s shortfall is projected to be up to $1.9 billion.

Edwards recently announced across-the-board cuts to address the current budget gap and has asked lawmakers to consider long-term solutions for next year’s budget, including raising the tobacco tax and reducing business tax credits and personal income tax deductions.

Cuts, Cuts, Cuts

Like Alaska and Louisiana, Oklahoma and West Virginia are considering spending cuts to address the oil shortfalls. But unlike them, they aren’t considering longer term solutions. The governor in West Virginia made across-the-board cuts of 4 percent for most state agencies to address a $250 million-plus gap. While officials in Oklahoma already made across-the-board spending cuts for the current fiscal year and are eyeing more cuts to close a projected $900 million gap in fiscal 2017.

A Local Problem, Too

In North Dakota and Texas, some of the biggest pressure is localized.

Williston, N.D., the epicenter of the state’s boom since the discovery of the Bakken Shale deposit in 2009, is seeing signs of an economic slowdown. Still, slowing down from warp speed is relative. For example, Williston only recently lost its top ranking in the state for the amount of sales tax it collected. For the first time in four years, Fargo — which has more than five times the population of Williston — collected more sales taxes than the boomtown.

West Texas began feeling the slowdown in oil production last year. So far, lower oil prices and weaker production have caused property tax values to drop 6 percent compared with a year ago. “Layoffs have caused weaker consumer spending, which is impacting sales tax revenues,” according to a Moody’s Investors Service analysis.

Still, the state governments are also feeling the slowdown and making adjustments.

North Dakota Gov. Jack Dalrymple on Monday ordered state agencies to cut their budgets 4 percent to offset the projected shortfall of more than $1 billion. North Dakota is the second most dependent state on oil revenue, after Alaska, but it has taken steps to buffer itself from that volatility. For example, North Dakota caps the flow of severance tax revenue — the tax imposed on the production of oil and minerals — into the general fund to about 4.4 percent. Excess funds get diverted to local governments and special funds.

In Texas, total tax collections declined 6 percent in just the first four months of fiscal 2016. Texas diverts much of the oil revenue into its rainy day fund. Still, Texas Comptroller Glenn Hegar cut the state’s revenue expectation in October by 2.3 percent to $110.4 billion over its current two-year budget cycle. But Wells Fargo’s Eappen notes that Heger also set the budget well below what the real revenues have been. This “created an additional cushion against oil price revenue shocks, even beyond the downward revenue adjustment in October,” said Eappen.

Then There’s New Mexico and Wyoming

New Mexico is considering withdrawing from its rainy day fund to fill a $145 million hole in this year’s budget. Lawmakers are also reconsidering a $230 million spending increase in Gov. Susana Martinez’s fiscal 2017 budget. Wyoming’s governor, on the other hand, is setting aside unspent appropriations from this year to plug in next year’s estimated shortfall of $150 million.

GOVERNING.COM

BY LIZ FARMER | FEBRUARY 4, 2016


Kansas Lawmakers Scrutinize KU’s Out-of-State Bond Issue.

The University of Kansas borrowed $330 million to build facilities without the approval of the Kansas Legislature.

KU used a Wisconsin agency to issue $326.9 million in bonds last month, setting up a private corporation to serve as the debtor so it would not have to seek legislative permission.

University officials say they followed the law.

But House Speaker Ray Merrick, R-Stilwell, criticized the arrangement as “circumventing legislative oversight and escaping the public view.”

House Republicans are drafting legislation to prevent state universities from making similar arrangements in the future.

“Kansas taxpayers deserve for their elected representatives to be involved in substantial financial deals to make certain there is transparency and accountability wherever state assets are involved,” Merrick said in an e-mail.

Lawmakers have expressed concern that students will be forced to pay off the debt through tuition increases, a fear that KU officials say is unfounded.

The $326.9 million in bonds was issued on behalf of the KU Campus Development Corporation, a nonprofit corporation the university established in October that is led by KU chancellor Bernadette Gray-Little and other high-level university administrators. Another $56 million was collected from premiums that investors paid for the bonds.

The money will be used to finance the construction of a science building, a dormitory, a student union and other facilities on the university’s Lawrence campus as part of a revitalization plan. Maryland-based Edgemoor Infrastructure and Real Estate will design and build the facilities for $350 million.

To pay for the project, KU relied on the Public Finance Authority in Wisconsin to issue the bonds during the first week of January – instead of the Kansas Development Finance Authority, the agency that typically handles Kansas bond issues. A bond issue by the finance authority would have required legislative approval; going out of state to borrow money did not.

Structuring the bonds this way “protects the state from liability for that debt,” said Tim Caboni, KU’s vice chancellor for public affairs.

The corporation will have to pay back the bonds over 30 years at a 3.76 percent interest rate. It will get that money from KU, which will lease the newly constructed buildings from the corporation at a cost of $21.85 million a year.

‘They rushed’

Rep. Mark Hutton, R-Wichita, said he and other lawmakers had raised concerns about the project in recent months. The university issued the bonds in the first week of January, shortly before lawmakers returned for the session.

“I would maintain that they rushed to do the project before we gaveled in for session, because they knew we were going to raise those issues and try to block the project,” Hutton said. “We have not been given adequate information to be able to justify or validate whether the need is there or not.”

Caboni said the university tried to issue the bonds through the state finance authority. The agency said that would have required legislative approval.

Although the state finance authority was required to get legislative approval, the university was not, Caboni said. He added that state law “says if we’re not using state funds, there’s no requirement to get approval of the Legislature. So, No. 1, we followed the law. There was no need for legislative approval.”

The university chose to issue the bonds through a Wisconsin agency instead so that the new residential facility can open in time for the 2017 fall semester, Caboni said. He added that the university has a great need for more bed space.

“We know the Legislature has said to us over and over again ‘Don’t come to us and ask for investment. We don’t have the funds to do that right now,’ ” Caboni said, noting that the governor and other policymakers have challenged the university to act more like a business in recent years. “We were creative. We operated like a business, and we did what institutions across the nation have done: partnered with a private entity and bundled projects together to get a great deal for the families and students of the University of Kansas and for the state of Kansas.”

Moody’s Investor Services downgraded the university’s credit outlook from stable to negative in December, citing the risks of the large capital expansion financed through bonds.

Tuition concerns

Hutton expressed concern that the university would rely on student tuition to pay off the bonds.

“This is $22 million a year in debt service that the university is going to have to come up with. They’ve made it clear they’re not asking for money from us. So where it’s coming from?” Hutton said. “It’s going to come from students. We asked them in Joint Committee (on State Building Construction) if they had any studies as to how the impact of this debt would be on tuition, and they said they had done no studies on that.”

Caboni disputed the notion that the bonds would cause tuition to increase. He said some of the projects paid for by the bonds will be self-financing, such as the new dorm and parking garage.

Caboni said tuition would go to cover some of the cost of paying off the bonds but that it would come from expected enrollment increases by international students rather than a tuition increase.

About $6.4 million of the annual cost is expected to be covered by nonresident enrollment growth, according to the university. The remaining cost will be covered by revenue generated by the facilities, operational savings and an $18.70 per semester student fee that was passed by the Student Senate to finance the construction of the student union, the university said.

“Look, I know there’s been some suggestion that this will raise tuition at the university. What really drives tuition (is that) … the per-student subsidy by the state is down 40 percent since 2000. That’s the main driver of tuition increases. It’s not this project. We have a $1.2 billion budget, of which $20 million is going to pay off these bonds,” Caboni said. “If we can’t make our budget, that means we’ve got bigger problems – not as an institution but as a state. Because what that means is the small percentage of our budget which we get from the state will have cratered.”

Hutton called KU’s bypassing of the Legislature a “slap in the face to every legislator.”

“If this is such a great project, if this is going to enhance KU and the regents universities so much that it’s worth all this to go through, then surely you trust it enough to bring it to the Legislature,” Hutton said.

Regents OK project

The project received approval from the Kansas Board of Regents in December.

Rep. Ron Ryckman, R-Olathe, House budget committee chairman, said lawmakers had raised concerns about the cost of the project at a November meeting of the Joint Legislative Budget Committee. He said the Board of Regents was supposed to get answers to lawmakers’ questions before the bonds were approved, but that did not happen.

Breeze Richardson, spokeswoman for the regents, said in an e-mail that her office was “unaware of any requests that were not met. The Board Office has confirmed with the University of Kansas, following the meeting of the Legislative Budget Committee on Monday, November 9, all questions asked of the University were answered.”

Meeting notes taken by Ryckman’s staff show the committee raised numerous concerns that were to receive further clarification – about the cost of the project, whether the state and students would be liable for the debt and that, unlike a typical public-private partnership, the corporation formed by the university would be bringing no capital to the project. Ryckman and his staff said those concerns were not addressed.

The KU bond sale comes at a time when lawmakers have called for more oversight of the state’s finances in the wake of financing arrangements made by the Brownback administration.

“It’s the same thing. It’s all one thing to me,” Ryckman said. “More accountability, more oversight, more structure.”

Hutton said the House speaker has tapped him to write a bill to prevent state universities and state agencies from circumventing the Legislature on bond issues in the future. He hopes to introduce legislation this week.

Passing legislation to prevent state universities from doing this in the future would be an “awful message to be sending to the national business community that actually is looking at this project as an innovation,” Caboni said. “The way the university has done this has made us a national leader in the relationship between universities and private entities.”

THE WICHITA EAGLE

BY BRYAN LOWRY

FEB 1, 2016

[email protected]


S&P: Looking Toward U.S. Public Finance Ratings and Markets in 2016.

U.S. public finance (USPF) enters 2016 after year of growing credit strength and higher volume in 2015. It is likely that ratings in the sector will continue their upward movement, but volume should decline after a year of heavy refunding drove the first eight months of 2015 to a record pace that dissipated in the last third of the year. Data from Thomson-Reuters indicate that volume increased to $398 billion in 2015 from $334 billion in 2014, growing 19%. Throughout 2015, Standard & Poor’s upgraded about 1,100 ratings while downgrading approximately 570. This trend was consistent, as upgrades outpaced downgrades in each quarter of 2015. That trend should continue, although it is likely Puerto Rico will cause the number of defaults in U.S. Public Finance (USPF) to spike, perhaps to record numbers.

Continue reading.

27-Jan-2016


S&P Video: A Big Picture Look at What Lies Ahead for U.S. Public Finance.

We believe it’s likely that U.S. public finance ratings will continue their upward movement this year, but volume could well decline. Upgrades outpaced downgrades in each quarter of 2015. That trend should continue, although it is likely Puerto Rico will cause the number of defaults in the sector to spike. In this CreditMatters TV segment, Senior Director Larry Witte explains what lies ahead.

Watch the video.

Jan. 27, 2016


S&P: In The U.S. Merchant Power Space, A Stable Business Climate Has Become An Oddity.

Being stranded is something U.S. independent power producers and merchant generators are familiar with these days. In earlier, more hopeful times, the sector had heralded the advent of energy efficiency, distributed generation, and proliferating renewables as progressive developments for the electric power industry.

Continue reading.

Feb. 2, 2016


Standard & Poor's Maintains Its Focus On Direct Loans After Evaluating $15.8 Billion In 2014.

Providing a precise measure of the U.S. public finance direct bank loan market is challenging for a variety of reasons—but primarily because bank loans are not explicitly required to be disclosed because they are not securities.

Continue reading.

Jan. 27, 2015


Advocates Say Climate Right for Resilience Ratings.

BOSTON — Climate experts and municipal issuers see the capital markets — investors with more than $70 trillion in assets under management — as valued financing streams for resilience and green projects.

Transparent carrot-and-stick bond rating criteria along resiliency lines would help, they say.

“Now is the time to be pushing infrastructure projects,” South Miami, Fla., Mayor Philip Stoddard, an aquatic scientist, said in an interview. “By the time sea levels are rising, no one’s going to loan us money.”

Quirky weather is in the national headlines more frequently. As August began, and just as President Obama unveiled a major climate-change plan, severe flooding hit Tampa, Fla.; wildfires struck Northern California; a tornado touched down in Michigan; and severe thunderstorms knocked out power in parts of southern New England.

Bond rating agencies are increasingly studying the ramifications of environmental and climate developments such as the far-reaching Obama proposal, earthquakes, and hydraulic fracturing to extract natural gas and oil deposits from shale rock.

Recently, climate experts met at Standard & Poor’s in New York to discuss rating incentives as proactive steps to obtain capital and insurance more cheaply, avoid downgrades and minimize the cost of debt service to taxpayers.

“We regularly publish extensive research on the implications of environmental and climate-related risks for entities that we rate, and our evaluation of environmental, social and governance risks is a key part of our ratings methodology,” S&P said in a statement. “We continue to review the relevance of climate risk for creditworthiness and how we assess and present it as a risk factor in our analysis.”

A spokesman said S&P welcomes feedback from market participants on climate change and their role in the ratings process, and that its current climate-change related research goes back 10 years but has intensified over the last three.

S&P on Wednesday issued a report on the increase of fracking-related earthquakes in the Midwest, and what it sees as potential credit consequences for municipalities in that region.

“Resilient financing projects need to be started now to protect public health and property,” said Alan Rubin, a storm financing expert and managing director at Tigress Financial Partners.

Rubin, nicknamed the “Hurricane Czar,” helped design and underwrite the catastrophe fund for hurricane relief in 1992, while working in Lehman Brothers’ investment banking division, after Hurricane Andrew caused more than $30 billion in damage in South Florida.

Regions such as South Florida and the Gulf Coast are notably vulnerable, though not alone. Hurricane Sandy struck the Northeast in October 2012, killing 185 people overall as it right-angled directly into the New York City region. Boston last winter received a record 109 inches of snowfall that forced repeated shutdowns of its mass transit system.

“In my city, it has become painfully obvious that we have to set difficult goals for ourselves. The extent of the climate crisis demands it,” New York Mayor Bill de Blasio said in the Vatican last month at the Pontifical Academy of the Sciences.

According to the U.S. Climate Assessment Report, New York State must protect against a two- to six-foot mean sea level rise in New York Harbor and Long Island, and make properties resilient in much larger flood plains due to 71% more intense precipitation and a 12% rise in flood magnitude.

In the Southeast, Stoddard has been educating his citizens about rising sea levels.

“Capital market financing, reflecting our risk reduction with credit ratings and financial incentives, will be necessary throughout coastal regions of the country due to the magnitude of funds needed,” he said. “Everyone I’ve talked to thinks it’s a great idea. I haven’t gotten any resistance. We need every kind of incentive to make things more resilient.

“They want to keep the government at arm’s length for the time being,” Stoddard said of the rating agencies. “But it’s critical to set up rating guidelines and incentives a pretty clear picture. We need them to be more clear about carrots and sticks.”

In June, Moody’s Investors Service called on coastal cities in Virginia’s Hampton Roads region — home to the world’s largest naval base and second-largest U.S. east-coast port — to continue investing and planning to mitigate negative credit effects from weather-related and tidal flooding.

“Cost forecasts indicate a potential need for greater investment in this area by local governments across the region,” Moody’s said in a report. Moody’s said Hampton Roads municipalities, which include Virginia Beach and Norfolk, generally have high credit ratings and budget flexibility.

In the last three years, the city of Hampton, which Moody’s rates Aa1, has spent $28.7 million on flood mitigation and has set aside funds in its 2016 budget for additional consultancy preparation.

Late in 2013, S&P issued its first surge-only rating, BB-minus to New York’s Metropolitan Transportation Authority’s $200 million MetroCat Re Ltd. Series 2013-1, the first catastrophe bond that covered storm-surge risk arising from named storms.

“We anticipate that this deal represents the start of a long-term alternative reinsurance option that diversifies MTA’s risk-management strategy,” authority Chairman Thomas Prendergast said at the time.

S&P said its rating reflected the principal at-risk nature of the offering. MetroCat Re collateralized the reinsurance through a cat bond and had its own credit rating separate from mainstream MTA credits such as transportation revenue bonds and dedicated tax fund bonds.

Last month, the Port Authority of New York and New Jersey approved a series of street-level flood barriers across the 16-acre World Trade Center site, primarily around its transportation hub.

The Port Authority’s board of commissioners approved $113 million for flood mitigation and resiliency projects designed to prevent further Sandy-type damage. A grant through the Federal Transit Administration’s emergency relief program is expected to cover about 75% of the cost, or about $85 million.

Peter Ellsworth, senior manager for investor programs at Boston-based advocacy group Ceres, said members of its investor network on climate risk, whose total assets under management exceed $13 trillion, are increasingly attentive to material climate-related risks and the opportunities for investing in related projects.

“We believe that credit rating agencies could send a strong signal about the value of effectively managing long-term sustainability risks, including those associated with climate change, by having credit ratings reflect the presence of such strategies and practices designed to reduce such risk,” he said.

Consensus resilience criteria, say Ellsworth and others, would be similar to the commercial mortgage-backed securities risk reduction criteria S&P uses and could be piloted to provide data for S&P use. They also say green and resilient bonds are more profitable, less risky and free up 30-year profitable business models.

Rubin said green bonds and resilience bonds weave common threads, though sometimes they are erroneously lumped together.

“If you have a coal-burning plant and you want to improve the environment with better technology, that’s green. If you have a system that protects the plant from disaster, that’s resilience. They can be symbiotic,” he said.

The Rockefeller Foundation is working with the Swiss nonprofit Global Infrastructure Basel and other organizations to integrate ratings with resilience as part of its 100 Resilient Cities initiative. “We’re starting to think about resilience more broadly,” said Elizabeth Yee, vice president for strategic partnerships and solutions at 100 Resilient Cities.

The project aims to help cities worldwide become more resilient to what it considers “shocks” — catastrophic events including hurricanes, fires, and floods — and “stresses,” including water shortages, homelessness and unemployment. “We’re helping cities become more resilient to physical and economic challenges,” said Yee.

The foundation, which has committed $164 million to the program, has chosen 67 cities to date, including 16 in the U.S. Last month it began its push for the final 33. The foundation encourages collaboration: For instance, San Francisco, Oakland and Berkeley qualify as separate municipalities, but still work together on common Bay Area concerns.

“We know how integral the value of resilience is to many municipalities and we have a number of tools in our platform,” said Yee, who spent 14 years as a muni bond banker at Morgan Stanley, Lehman Brothers and Barclays in San Francisco and New York.

THE BOND BUYER

BY PAUL BURTON

AUG 7, 2015 12:31pm ET


Safe Havens In a Stormy Market for Muni Bonds.

Reading a municipal bond prospectus isn’t the most entertaining or easiest of reading you’ll ever do. But for municipal bond investors, it is mandatory.

In today’s credit-crammed society, it’s easier to tiptoe around the municipal bond sinkholes than the corporate ones. Yet investors who ignore the details in a municipal bond offering and remain exclusively yield driven will suffer the consequences of credit quality and price erosion.

The muni sinkholes are numerous but easily avoided if you read the public information. Take for example the Board of Education of the City of Chicago (aka Chicago Public Schools, CPS). This school system has financially collapsed. The Chicago Public School system has for years had the same approach to debt management as Puerto Rico—NONE.

Management has issued more and more debt, papering over deficits and never displaying the will to take corrective action. Their ineptness is clearly spelled out in the $875 million January 14, 2016 municipal offering that was pulled due to lack of investor interest. This offering listed for investors all the things they never, ever wanted their bonds to be involved with. It contained words and phrases like: The Pension Fund is underfunded; swap terminations; credit downgrades; operating budget gaps; structural deficits. You get the idea.

The 28-year tax-free CPS municipal bonds were going to be offered at 7.75%. This is a whopping 5% more than a comparable investment grade muni. Geeze…the more one reads the more the Chicago School System mirrors Puerto Rico.

I am not saying a deal won’t eventually close. But it’s curious that the hedge funds already burned by the Puerto Rican folly barely showed a pulse for the CPS debt.

Retail investors don’t belong in B2 rated junk municipal bonds like Chicago Public Schools. Instead, invest in pristine, highly rated tax-free municipals that will preserve capital. There are dozens of ways to take investment risk—municipals should not be among them.

Stick with the boring, reliable, and trustworthy names you know. If you are public minded and want to loan money to a school system, then consider the Texas Permanent School Fund backed munis (PSF).

The PSF fund has been around since 1854. Stocks, bonds, real estate, mineral rights and commodities back it. Such a guarantee is exceptional. Plus, its management and good history puts the old-line municipal bond insurers to shame. According to the Texas PSF unaudited financials, total assets are $28.95 billion. Not every year is a financial winner but you can bet the PSF won’t rubber stamp or guarantee any bonds without proper due diligence.

Consider the newly issued Grand Prairie Texas Independent School District General Obligation bonds, 4.00% due August 15, 2029 CUSIP: 386155DR3. Grand Prairie has a population of 138,000 with a growing economy. It is a stone’s throw from the Dallas-Fort Worth-Arlington area. School enrollment is a hair over 29,000 and has grown about 2% since 2012.

Bonds on their own are rated AA-. With the PSF Guarantee they are AAA rated. These bonds are an excellent credit on their own but should a financial calamity occur, the Permanent School Fund steps up and pays the interest and principal.

The district has a fund balance and has made its 2014 pension and other post-employment payment obligations. The ten largest taxpayers represent 9.2% of net taxable assessed value. Bonds yield 2.42% to the February 15, 2026 call and 2.75% to the August 15, 2029 final maturity. That’s a 4% taxable equivalent yield to the call if you are in a 39.6% Federal bracket and 4.56% TEY to maturity. Plus, there’s no 3.8% ObamaCare tax if you meet the net investment income and adjusted gross income thresholds. Good quality munis for baby boomers are a win-win.

Forbes

by Marilyn Cohen

Feb 2, 2016 @ 02:01 PM


Puerto Rico's Argentina-Like Debt Gambit Comes With a Big Catch.

Puerto Rico is turning to a novel, yet increasingly popular, approach to lighten its crippling $70 billion debt load.

Pioneered by Argentina in the mid-2000s, and used by Greece and Ukraine in debt restructurings in recent years, the proposal is part of a plan to cut the island’s obligations by 46 percent and avert a default that would be the biggest of its kind. The novel part is a sweetener — in the form of “Growth Bonds” — that could potentially help creditors get all their money back.

But there’s a catch: the bonds only pay out if Puerto Rico can collect enough taxes over the next 35 years. And for the commonwealth, that’s a big if.

While it worked in Argentina because the commodities boom helped the nation quickly recover from its fiscal crisis, Puerto Rico faces a very different set of circumstances. Not only has the economy contracted in the past decade, its prospects remain bleak. That’s raising questions about whether the offer is credible enough to win over bondholders as they kick off negotiations over how to restructure its debt.

“It’s hard to see any meaningful economic growth coming out of Puerto Rico in the foreseeable future,” said Matt Fabian, a partner at Municipal Market Analytics, a research firm based in Concord, Massachusetts.

“Those securities would essentially have no value. The most likely outcome is that they never receive a payment.”

The stakes are high. After years of borrowing to fix budget shortfalls, Puerto Rico warned creditors that it may stop debt-service payments if it fails to renegotiate its debt before May 1, when a $422 million Government Development Bank payment comes due. Two commonwealth authorities have already defaulted on payments to investors.

Puerto Rico’s proposal, announced on Monday, would reduce its obligations to $26.5 billion from $49.2 billion. Bondholders would swap their securities for new notes that delay principal and interest payments.

The plan consists of two types of securities: so-called Base Bonds that begin paying interest in 2018 and the aforementioned growth bonds, which repay principal after 10 years only if Puerto Rico’s revenue collections surpass targeted levels. Creditors have a chance to recoup all of their money if revenue growth exceeds the estimated annual rate of inflation.

Puerto Rico estimates it will begin repaying the growth bonds in 2029, if the island’s economy begins to grow at 2.5 percent by 2022, according to the restructuring plan. That might be an optimistic assumption.

“It’s difficult to come up with economic scenarios where Puerto Rico grows at 2.5 percent in the near future,” said Orlando Sotomayor, a professor of economics at the University of Puerto Rico. “All economic fundamentals point in the opposite direction and include declining population, workforce participation, reduced investment, and education.”

The proposal also doesn’t detail how the commonwealth will support its largest pension fund, which owes current and future retirees $30.2 billion — a big question mark for Lyle Fitterer, the head of tax-exempt debt at Wells Capital Management, which oversees $39 billion of municipal bonds, including Puerto Rico securities.

“That’s a big unknown,” Fitterer said. “That obviously will impact bondholders’ ability to get paid back.”

Upside Potential

Growth bonds aren’t entirely new to the $3.7 trillion municipal-bond market. Many housing or community development-projects are financed with tax-exempt securities that are repaid based on future increases in property taxes or assessment fees.

Greece and Ukraine have sold similar securities to help restructure their debt. Last year, Ukraine included so-called GDP-linked warrants, whose payouts are tied to economic growth hurdles. The benefit for the issuer is that payments aren’t made until economic growth can support them. For bondholders, they offer the potential for bigger profits once the borrower gets back on its feet.

“The upside of the growth bonds is directly in line with the economic recovery of the commonwealth,” Barbara Morgan, a spokeswoman who represents the Government Development Bank at SKDKnickerbocker in New York, said in an e-mail. “Without a willingness from all parties to invest in solutions that move the island’s economy down that path, no one wins.”

Still, the securities can be notoriously hard to value. And for issuers, it’s questionable whether they’re worth it because of how big a liability they can become over time. When Argentina initially issued the GDP warrants in its 2005 debt swap after defaulting on $95 billion in 2001, the securities were deeply discounted by some investors who were skeptical of the country’s growth prospects.

As the economy grew, the warrants created a larger-than-anticipated debt payment for Argentina. It’s paid investors about $10 billion since 2005. And the country could potentially be on the hook until 2035 — when the warrants finally mature.

“It really depends individually on each country and each security that you look at,” said Siobhan Morden, the head of Latin American fixed-income strategy at Nomura Holdings Inc.

Bloomberg Business

by Michelle Kaske

February 2, 2016 — 9:01 PM PST Updated on February 3, 2016 — 5:54 AM PST


Fitch Releases Exposure Draft on Adding Enhanced Recovery to U.S. Local Gov't Criteria.

Fitch Ratings-New York-02 February 2016: Today Fitch Ratings is releasing an exposure draft for public comment that proposes the inclusion of enhanced recovery prospects in its U.S. local tax-supported ratings.

“During the comment period for our state and local government criteria, Fitch received many comments from investors, issuers and other market participants suggesting rating above the ULTGO/IDR in certain circumstances based on distinct and significantly different recovery prospects in the event of a municipal bankruptcy,” said Amy Laskey, Managing Director.

“We have identified two such circumstances: statutory liens and visibility during bankruptcy.”

Municipal securities benefiting from a substantial preferential right in a bankruptcy proceeding as a result of a statutory lien granted under state law have significantly improved bondholder protection. Fitch proposes to rate bonds backed by revenues with a statutory lien one to two notches higher than the equivalent stream without the statutory lien.

Recovery can also reasonably be estimated when there is sufficient visibility, via a plan of adjustment, into the potential recovery prospects during a bankruptcy proceeding.

Fitch invites feedback from market participants on this proposed criteria addition until Friday, February 26.

Fitch will host a conference call to discuss the proposed criteria addition on Thurs., February 11 at 2:00 PM EST. To receive dial-in details for the call, please resister here: http://dpregister.com/10080506


Public Pension Reform Advocacy Group Launches.

PHOENIX – Well-known figures in municipal finance and local government are leading a new advocacy group created to help local governments face what it describes as the “uncertain future” of public pension plans.

The Retirement Security Initiative launched publicly Tuesday.

Leaders include municipal bankruptcy expert Jim Spiotto, former New York Lt. Gov. Richard Ravitch, Lois Scott, Chicago’s former chief financial officer, and former San Jose, Calif. Mayor Chuck Reed.

Spiotto, a managing director of Chapman Strategic Advisors, said that the RSI is there to help provide government officials with help and information about what reform steps other governments have taken, and to generally “help them help themselves.”

Backers describe the initiative as a national, bipartisan advocacy organization.

“The initiative is really to be of service to state and local governments,” Spiotto said.

The RSI said in its announcement that pension liabilities are in excess of $1 trillion, putting state and local governments throughout the U.S. under tremendous strain to both provide public services and meet their pension obligations.

“As pension costs continue to skyrocket, policymakers often pull funds from important public services like education, public safety and transportation to pay pension debt,” the announcement said. “In the end, it’s taxpayers and communities that pay the price.”

Former Utah state senator Dan Liljenquist said that it is essential to act quickly to prevent an even bigger problem down the road.

“We need to fix the pension crisis now to avoid further tax increases and public service disruptions,” said Liljenquist, who advocated for pension reforms as a state lawmaker. “Many pensions, as they are currently structured, are like the game Pac Man, chewing up funds that should be going toward essential community services.”

The RSI said it advocates for state and local governments to act to ensure that their retirement plans are “sustainable, fiscally sound and responsibly managed so that all retirees and employees get paid what they have earned.” The organization also advocates for decision making and management of retirement plans to be “open, transparent and non-political.” It says it advocates at the federal, state, county and municipal levels.

Reed, who fought for pension reform in San Jose, was one of the primary promoters of California ballot initiative efforts to give voters more power over government pension benefits and to limit government spending on retirement costs. Initiative backers withdrew from the field this year, saying they would come back in the next election cycle because financial backers believe the 2018 political climate might be more receptive.

All stakeholders need to have some input in pension solutions, Reed said. “Solutions to the funding and cost crises need to be developed with input from employees, retirees, labor, management, taxpayers and fiscal experts,” said Reed. “RSI has the experience and resources to bring all of these parties together.”

Ravitch, Reed, Scott, Spiotto, and Liljenquist are the members of the RSI board of directors.

Peter Furman, the initiative’s executive director, formerly worked as Reed’s chief of staff in San Jose.

THE BOND BUYER

BY KYLE GLAZIER

JAN 26, 2016 2:48pm ET


Moody's RFC: Green Bonds Assessment - Proposed Approach and Methodology.

We are seeking feedback in response to our proposed Green Bond Assessment (GBA) methodology. Our GBA would provide an evaluation of the bond issuer’s management, administration, allocation of proceeds to and reporting on environmental projects financed with the proceeds derived from green bond offerings.

Our assessment process will score each bond issue on five key factors (along with their respective sub-factors), weighted to reflect their relative importance, to arrive at a composite grade. The composite grade, in turn, will inform an overall assessment that runs from 5 (Excellent) to 1 (Poor). After a GBA is initially assigned, it may be refreshed periodically, based on information provided in the issuer’s subsequently issued annual reports.

After the transaction comes to market, we may periodically refresh the GBA.

We invite market participants to comment on the Request for Comment by February 12, 2016 by submitting their comments on the Request for Comment page on www.moody’s.com.

Download the RFC.


GASB Seeks Participants for Field Test of the Exposure Draft, Certain Asset Retirement Obligations.

The Governmental Accounting Standards Board invites you to participate in a field test of the Exposure Draft, Certain Asset Retirement Obligations, issued in December 2015 and available for public comment until March 31, 2016. The Exposure Draft can be found here. The GASB would like to gather feedback from preparers of governmental financial statements on (1) potential implementation difficulties, (2) the costs associated with the initial and ongoing implementation of the proposed standard, and (3) whether any provisions of the proposed standard are unclear.

Field tests are a part of the GASB’s due process activities and help the GASB to establish effective standards. Participating entities volunteer to go through the exercise of “implementing” the proposal as if it were in place and then provide feedback to the GASB regarding that process. A fact sheet describing the benefits of participating in a field test and what participation involves is available on the GASB website and can be found here. The feedback that you provide will be considered by the Board in development of a final Statement. Participants would be expected to complete and return the field test results to GASB by March 31, 2016.

If you are willing to participate or have any questions, please contact project team member Brett Riley at [email protected] or 203-956-5216, or lead project manager, Jialan Su at [email protected] or 203-956-5339, by Friday, February 5, 2016.


NABL: GASB Seeks Input on Revenue from Exchange Transactions.

GASB is conducting pre-agenda research on reporting revenue from exchange transactions. Common examples of exchange transactions that produce revenue for governments include user charges for water, sewer, and electricity and fees for parking lots and street meters. The project team has designed an online survey to assess the information regarding revenue from exchange transactions that is essential to meeting user needs.

Access the survey.

The objective of this research is to gather feedback on these broad questions:

The survey need not be completed in one session. If you save your responses, you will be provided an individualized link to return to your survey at a later date to complete it. If you would like to respond to the survey by phone or have any questions, please feel free to contact Amy Shreck of the GASB project team at [email protected].

The deadline for completing the survey is Friday, February 19, 2016.


S&P: Looking Toward U.S. Public Finance Ratings and Markets in 2016.

U.S. public finance (USPF) enters 2016 after year of growing credit strength and higher volume in 2015. It is likely that ratings in the sector will continue their upward movement, but volume should decline after a year of heavy refunding drove the first eight months of 2015 to a record pace that dissipated in the last third of the year. Data from Thomson-Reuters indicate that volume increased to $398 billion in 2015 from $334 billion in 2014, growing 19%. Throughout 2015, Standard & Poor’s upgraded about 1,100 ratings while downgrading approximately 570. This trend was consistent, as upgrades outpaced downgrades in each quarter of 2015. That trend should continue, although it is likely Puerto Rico will cause the number of defaults in U.S. Public Finance (USPF) to spike, perhaps to record numbers.

Continue reading.

27-Jan-2016


S&P Video: A Big Picture Look at What Lies Ahead for U.S. Public Finance.

We believe it’s likely that U.S. public finance ratings will continue their upward movement this year, but volume could well decline. Upgrades outpaced downgrades in each quarter of 2015. That trend should continue, although it is likely Puerto Rico will cause the number of defaults in the sector to spike. In this CreditMatters TV segment, Senior Director Larry Witte explains what lies ahead.

Watch Video.

Jan. 27, 2016


S&P Webcast Replay: Not-For-Profit Public and Private Colleges and Universities Criteria Release.

Standard & Poor’s Ratings Services held an interactive, live Webcast and Q&A on Thursday, January 14, 2016 at 2:00 p.m. Eastern Time for a discussion regarding our updated methodology for assigning stand-alone credit profiles (SACPs), issuer credit ratings (ICRs), and issue credit ratings to not-for-profit public and private colleges and universities globally.

Listen to the replay.

Jan. 29, 2016


Illinois 'Inland Port' Capitalizing on PAB Program.

CHICAGO – The only intermodal freight facility to ever take advantage of a special 11-year-old federal private activity bond program is back for a third round of financing.

The CenterPoint Joliet Terminal Railroad LLC in Illinois hopes to close as soon as this week on a $100 million private placement to help fund its ongoing expansion, according to Tim Lippert, CenterPoint’s vice president of finance.

Conduit issuer Illinois Finance Authority recently approved the transaction for the “inland port,” which smooths the flow of freight among trains and trucks.

The private activity bond financing is CenterPoint’s third, following its $80 million issue of surface freight facilities tax-exempt revenue bonds in 2012 and its first sale in 2010 for $150 million.

The project has an allocation under the U.S. Department of Transportation’s freight transfer facility revenue bond program established in 2005 in the SAFETEA-LU federal transportation authorization, which authorized an initial $15 billion of PABs for qualified projects.

The program seeks to promote private investment in highway, bridge and intermodal freight-transfer facility projects of regional or national importance with tax-exempt PABs. Such projects aren’t subject to state PAB volume caps.

The facility is the only intermodal facility financed to date under the U.S. Department of Transportation’s private activity bond program, IFA executive director Chris Meister said in his board message.

“All other US DOT Private Activity Bond projects issued to date have financed privately-owned toll road, toll bridge, or commuter rail projects,” he said.

CenterPoint’s developers have another facility that had qualified for the program but ended up using private financing, and other intermodal projects that also initially qualified either used private financing or have stalled.

A total of 15 projects have used nearly $5.9 billion in approved PAB financing and another six, including CenterPoint, have allocations to use another $5.7 billion, according to USDOT.

Projects also must receive Title 23 Highway Funds or Title 49 railroad grant funds. The IFA said CenterPoint has a commitment from Title 23 satisfying both US DOT requirements to qualify for the tax-exempt issuance for the project. Those funds have gone to improve local bridges and highways that benefit the project.

“The program has lowered our cost of borrowing and having the support of the Illinois Finance Authority and the federal government helps the park in its marketing and in attracting tenants,” Lippert said.

The project initially won a $1.2 billion allocation that was later scaled down because pieces of the build-out were slower to come to fruition than initially planned.

The project has a $400 million allocation remaining and can return to USDOT for more in the coming years.

“It was slow going due to the recession but has really been picking up,” Lippert said.

Proceeds will finance the acquisition of land, and construction and equipping of various capital improvements at the rail-to-truck and truck-to-rail intermodal facility.

The CenterPoint Intermodal Center is housed on a 4,000-acre Joliet site with distribution centers, container storage yards, and export facilities all in one campus.

The intermodal facility allows for the direct transfer of goods between and among trains and trucks, allowing customers to smooth the process of shipping goods from the U.S. coasts inland by rail for distribution by truck.

The overall project calls for rail improvements and the construction of between 15 million and 20 million square feet of related warehousing and distribution facilities as well as infrastructure improvements.

The conduit issuer is highlighting the thousands of temporary construction and permanent jobs created by the project and traffic relief it promises by helping to break the logjam that develops in Chicago as inland freight traffic travels across the country.

When finished, the campus will include an 835-acre Class I railroad intermodal facility, 450 acres of onsite container/equipment management and approximately 15 to 20 million square feet of industrial facilities.

“The project will provide critical transportation capacity for the region and distribution efficiencies for customers, while meeting local community, county and state interests through the creation of approximately 16,600 jobs and millions in new tax revenues,” IFA documents say.

CenterPoint plans a private placement with a syndicate of banks that currently finance line of credit and other credit facilities.

SunTrust Robinson Humphrey is placing the bond with a syndicate led by SunTrust Bank. Members of CenterPoint’s lending syndicate include Bank of America, BB&T, PNC Bank, Regions Bank, US Bank, JPMorgan Chase; and Wells Fargo Bank.

Interest rates are estimated to be in the range of 2% to 5% depending on their maturity which can go out 40 years, but the final terms are confidential on the unrated debt.

General counsel on the deal is Latham & Watkins LLP, bond counsel is Perkins Coie LLP and bank counsel is Dentons. IFA counsel is Kutak Rock LLP and IFA’s financial advisor is Acacia Financial Group Inc.

CenterPoint anticipates the total cost of the built-out facility to hit $1.26 billion with another $812 million being raised from future issuance through the IFA and the rest covered by an equity contribution.

Future issuance will be dictated by the project’s buildout needs over the next five to 10 years.

Lippert said it may return within the next 12 to 18 months for a fourth financing.

CenterPoint has 5 years to spend bond proceeds under the US DOT bond program, but it has typically privately financed its projects and then turned to the long-term tax-exempt allocation as needed to reimburse itself.

CenterPoint LLC is a real estate development company set up in 2007 to build and manage the facility. The borrower is primarily owned by CalEast Global Logistics LLC, a leading investor in logistics warehouse and related real estate; it’s a joint venture of the California Public Employees Retirement System and GI Partners.

The Chicago region is a top spot for inland port/freight transfer centers in the country due its location. All six North American Class I railroads intersect in the region: Burlington Northern Santa Fe, Canadian National, Canadian Pacific, CSX, Norfolk Southern, and the Union Pacific.

Officials say 60% of freight traveling inland from the coasts either stops in Chicago, or travels through Chicago to other markets and supporters of such inland ports have long stressed the need for relief.

“Although it takes only two days for freight to be shipped from the coasts, it can take four days for this rail traffic to move through the city of Chicago,” IFA documents said.

“Development of intermodal facilities around the outer suburbs of Chicago will help reduce rail bottlenecks, reduce truck traffic in the city of Chicago as well as create a more efficient supply chain for goods traveling inland from the coasts,” the documents said.

The project completed its first on site building for the Stepan Co. as well as a 12-acre grain facility for The De Long Co. in 2010.

Other construction on the site has included an 18-acre container storage facility for Mediterranean Shipping Co., a 36-acre container storage facility for APL, construction of Home Depot’s campus, an eight-acre container storage facility for Central States Trucking, Home Depot’s Joliet campus, and a 485,000 square foot joint-venture speculative facility that’s leased to International Transload Logistics.

Also, construction was completed on a 400,000-square-foot warehouse facility for Neovia Logistics, and construction began last year on a 1.1-millionsquare-foot building for Saddle Creek Logistics Services and a 1.4 million-square-foot-building for an undisclosed food manufacturer.

The Bond Buyer

by Yvette Shields

JAN 26, 2016 1:20pm ET


Survey Reveals Obstacles Mayors May Face to Using P3s to Maintain, Improve Infrastructure.

Public-private partnerships could make up for a lack of state and federal funding and support for cities that seek to improve aging infrastructure, but a national survey of mayors indicates city leaders may face obstacles to using this procurement method.

The types of infrastructure projects most mayors are likely to spend new sources of funding on are mass transit, roads, water, wastewater and stormwater, followed by public buildings and other facilities, reported the Initiative on Cities at Boston University. The research group based its findings on an analysis of responses provided by 89 city leaders in the research group’s second annual Menino Survey of Mayors. Almost half of those surveyed singled out infrastructure as the top priority and nearly all expressed concern over a lack of funding for maintenance and improvements for these projects.

However, most mayors indicated that they are more likely to seek to partner with the business community on economic development and education projects than on road, transit or water projects, even though many expressed dissatisfaction with the level of financial support they receive from federal and, especially, state governments.

Many of those surveyed also expressed frustration with what they view as the onerous impact of state and federal regulations on their activities, which could impede efforts they might otherwise make to explore P3s for infrastructure projects. For example, 19 mayors expressed the desire to repeal or alter laws that affect local revenue-raising options and eight other want changes to laws that affect how revenues are distributed.

Requirements that force city governments to conduct some types of partnerships with other governments rather than with private developers may limit cities’ options as well. “This may be because of funding sources, regulatory laws, or a function of overlapping jurisdictions, as with a water district,” the study says. In assessing the number and types of partnerships cities conduct “mayors revealed that their much maligned state government is actually their most frequent partner across a wide array of policy areas, from roads to the environment to economic development. …There are no areas in which state government is an infrequent partner.” the study points out.

A combination of regulatory restrictions on revenue sources and expenditures, coupled with the fact that private financing for projects is not free money but is subject to repayment may discourage city leaders from pursuing P3s for expensive infrastructure projects. The report quotes the mayor of a large city as saying “Public-private partnerships are great if you want something built with somebody else’s up-front capital. But you still have to pay the bill. … They’re not a solution to everything.”

Despite these expressed misgivings, many cities have been quite successful in overcoming perceived financial and other barriers to procuring key infrastructure projects through P3s. Examples include New York City, Gresham, Ore., San Antonio, Texas, Bayonne, N.J., Rialto, Calif., Westfield, Ind. and Allentown, Pa. And many other city-based P3a are in development or are being planned.

By NCPPP

January 28, 2016


S&P Webcast Replay: U.S. Municipal Utilities, Water & Power 2016 Outlook

Standard & Poor’s Ratings Services held an interactive, live Webcast and Q&A on Tuesday, January 19, 2016 at 2:00 p.m. Eastern Time where we discussed our sector outlooks for 2016, along with hot topics such as impacts of the Clean Power Plan, the California drought and rate affordability.

Listen to the webcast.

Jan. 29, 2016


Kentucky's Cautionary Tale About Underfunding Pensions.

With the worst-funded pension system in the country, Kentucky offers a glimpse of what could be in store for other states.

Pensions will be a contentious topic again this year, with many states still struggling to find an affordable way to fund these promises to retirees. In Kentucky, which has the worst-funded state pension in the country, some officials are worried the plan has already reached the point of no return.

Kentucky’s largest retirement plan has been in slow and steady decline for years. Lately, it’s faced poor stock market returns and an increasing need to cash out investments or move money into low-risk, low-return bonds in order to make retiree payments. All that has led to an increase in the pension system’s unfunded liabilities to just over $10 billion.

The state legislature has passed several laws over the years aimed at reining in skyrocketing bills. But despite their efforts, the situation is getting worse.

The debate in Kentucky about what to do next offers a glimpse of what could be in store for other state pension systems that have a history of poor government funding.

In 2013, a new law created a hybrid cash balance plan for new employees, which is similar to a defined-benefit plan but carries less risk for the state. It also essentially eliminated retiree cost-of-living increases and required the state to make its full actuarial payments immediately — something it hadn’t done regularly since the 1990s.

But some are worried the changes came too late.

Over the past year, the plan lost nearly a third of its assets, dropping to $2.3 billion in 2015 from $3.1 billion in 2014. It now has just 19 percent of the assets it needs to meet its total pension liabilities over the next three decades.

“We understood that there was going to be several years of decline even after the latest reforms,” said Jim Carroll, cofounder of Kentucky Government Retirees, an advocacy group. “What [lawmakers] haven’t realized now is how deep and fast that trough has occurred.”

As in many states, lawmakers have tried to reverse the plan’s downward course for years. They cut retirees’ health benefits in 2004 and eliminated pension spiking, which offered higher benefits for workers whose earnings increased at the tail end of their career, in 2008. But it was only the most recent legislation in 2013 that forced the state to make its full pension payments. As a result, Kentucky’s employer contribution (which comes from money from the state’s General Fund, among other places) leapt to $521 million last year. That represents more than twice what it contributed in 2012 and one-third of the total payroll costs for state employees.

Kentucky’s not alone.

Both Illinois and New Jersey have repeatedly failed to make their full pension payments because of budget constraints. This year, at least Connecticut and Pennsylvania lawmakers are debating major overhauls of their pension systems. All of these states — plus Kentucky– have been slapped with credit rating downgrades in the last few years, either as a result of inaction on pensions or because of the financial pressures that unfunded liabilities are putting on their budgets. But none have yet reached the cash flow situation that Kentucky is facing.

Gov. Matt Bevin, just over a month into his new job, said this week in his State of the State address that he’ll order independent audits of every state pension system so he can propose “substantive structural changes” next year. He’s already called for eventually replacing the current system with a 401(k) retirement plan for new employees and letting current public employees transfer their traditional pensions to a 401(k) if they want. Until then, his latest budget would put $130.7 million from the General Fund toward the state employees’ pension, which is slightly more than what’s required.

​Carroll said his organization was still vetting the governor’s full proposal but called it “encouraging” that Bevin was making funding a priority. The 401(k) aspect of his proposal, however, has already incurred opposition from pension advocates.

The situation calls for negotiation and creativity, pension consultants say, but most of the ideas have been tried before. Some have proposed issuing bonds instead of using more General Fund money to infuse cash into the pension fund over time. But a similar bond proposal for the Kentucky Teachers’ Retirement System failed last year, and neither the legislature nor Bevin have shown much of an appetite for bonds.

Without decisive action, Kentucky will likely face even tougher budget choices down the line.

The struggling territory of Puerto Rico, for example, has recently started defaulting on some of its debt in order to pay its legally required obligations, including pensions. Some cities have been able to file for bankruptcy to overhaul their pensions, but territories and states can’t go that far.

“States can become structurally bankrupt where it’s very difficult — if not impossible — to make up the gap,” said Daniel Liljenquist, a former Utah lawmaker and a board member of the Retirement Security Initiative, a newly-formed group promoting sustainable retirement policies. “I think at that point you do have to go back and renegotiate with your retirees.”

That option isn’t palatable yet in Kentucky. Pension advocates are quick to point out that retirees have already given up some of their health benefits and their cost-of-living raises.

“My advice to [retirees] has been don’t spend any more money,” said Carroll. “This is a [pension] plan that will fail if nobody acts.”

*This story has been updated.

GOVERNING.COM

BY LIZ FARMER | JANUARY 27, 2016


Climate Change and Credit Ratings.

The growing intensity of natural disasters is a threat to state and local governments’ fiscal stability. How can they protect their finances and the environment?

Patricia, the strongest hurricane ever recorded in the Western Hemisphere, slammed into the town of Emiliano Zapata in southern Mexico in October. Peak winds were 165 miles per hour. The National Oceanic and Atmospheric Administration predicts that the 2015/2016 El Niño — a causal factor in the ferocity of Patricia — could foreshadow an indeterminate frequency, number and intensity of such storms in the Northern Hemisphere.

Wildfires in the U.S. West — California, Colorado, Montana, New Mexico, Oregon and Washington — were more severe and widespread this summer than in the past, burning or threatening millions of acres of land and thousands of homes. As wildfires increasingly imperil urban areas, they are putting more homes, lives and infrastructure at risk.

Whatever the debate about climate change may be in Congress or on the presidential campaign trail, it is clear that natural disasters — from hurricanes and wildfires to snowstorms and tornados — are becoming more commonplace and severe throughout the country. For state and local leaders, this intensification is not only a threat to lives and personal property but also to the fiscal stability of their communities.

It should not come as a surprise that the credit rating agencies have taken notice, adding “resiliency” to their rating criteria. In a recent statement, Standard & Poor’s noted that it regularly publishes extensive research on the implications of environmental and climate-related risks and that its evaluation of environmental, social and governance risks is a key part of its ratings methodology. “We continue to review,” S&P stated in a note, “the relevance of climate risk for creditworthiness and how we assess and present it as a risk factor in our analysis.”

When it comes to natural disasters, the task of protecting lives, property and the fiscal stability of a community falls disproportionately on states and localities — especially the latter because of the responsibilities they have, including zoning, emergency planning and the need to find the funding to undertake protective measures. In that regard, there are lessons to be learned from past events. Some regions or states that have suffered losses have taken relatively simple steps to protect against future destruction, such as changing building codes or rebuilding on higher ground.

A case in point is the Biloxi-Gulfport area in Mississippi. Ten years ago, the destructive winds of Hurricane Katrina hit the coastal region with full force, destroying everything from residential homes to the offshore gambling industry. Concerned that Biloxi’s economic lifeblood — tourists — would not return, the Mississippi legislature mandated that casinos had to build up to 800 feet inland instead of along the coast. Local communities banded together to rebuild, and today the casinos and golf courses that relocated or built inland have paved the way for a surprising and vibrant growth in the area, as well as an overall improved resilience for the economic lifeblood of the local communities.

Some unharmed communities are forward-looking, too. In Virginia’s Hampton Roads region, coastal cities are investing in research and planning ways to diminish the negative effects of rising seas. Norfolk, which is home to the world’s largest naval base, has been developing initiatives to learn about the impact of recurrent flooding in coastal cities around the globe.

On a recent visit to Norfolk, Secretary of State John Kerry noted that these initiatives were not just critical to the city’s economic and physical future but also to what he deemed “the importance of addressing resilience and national security.” Kerry announced the formation of a task force to incorporate climate change into decision-making at every level of government. That is, city leaders’ experiences in Norfolk could not only help keep its fiscal house in order but have applications for cities across America on the Gulf, Pacific and Atlantic coasts, as well as for others worldwide.

GOVERNING.COM

BY FRANK SHAFROTH | JANUARY 2016


Derivatives Mean U.S. Cities Get No Free Pass From Crisis Legacy.

When Chicago’s city council this month delayed voting on a bond sale sought by Mayor Rahm Emanuel, the elected leaders questioned whether they should go deeper in debt to pay about $100 million to unwind derivative trades.

“My fear is that these products designed to offer savings are going to saddle us with two decades of payments,” said Chicago Alderman John Arena, who joined with others to hold up consideration of the deal. “Is borrowing to pay the termination payment with more debt the way to buy our way out?”

Even in Chicago, a city contending with soaring pension bills and a school system that’s veering toward insolvency, there’s little other option. States, cities and counties across the U.S. haven’t found a way to skirt the fees they still face from interest-rate swap deals that cost them billions since credit markets unraveled in 2008. Chicago alone has paid $250 million to break the contracts, which banks had the right to cancel after its credit rating was cut to junk by Moody’s Investors Service in May. That’s enough money to cover more than two months of payroll for the city’s police department.

The derivatives were intended to protect governments that sold variable-rate bonds from the risk that interest costs would rise. They agreed to pay a fixed rate to banks in return for those that fluctuated with market indexes. Those adjustable payments were supposed to cover the interest due on the debt, leaving governments effectively paying the fixed rate. It could be cheaper than borrowing by selling traditional securities.

When the Federal Reserve cut interest rates to near zero in late 2008, the trades became valuable assets to banks, and governments had to pay the market value if they wanted to break them. Some unwound them because the deals backfired, resulting in higher debt bills, while others opted out so they could refinance after borrowing costs dropped to a half-century low.

Public officials have no recourse but to honor the contracts, absent unusual legal circumstances: Detroit reduced its obligation only because of its bankruptcy, while JPMorgan Chase & Co. forgave Jefferson County, Alabama’s $647 million of fees to settle Securities and Exchange Commission charges of fraud.

“They see it as a piece of paper that is a contract, they don’t think they have to negotiate,” said Robert Fuller, a principal at Capital Markets Management, a Hopewell, New Jersey-based swaps adviser.

Chicago has had some success. The city estimates that it has saved about $20 million by negotiating with banks over the market value of the derivatives contracts it has already canceled, according to Carole Brown, its chief financial officer.

Molly Poppe, a Chicago spokeswoman, said Royal Bank of Canada and Barclays Plc are counterparties on the derivatives the council considered this month. Elisa Barsotti, a spokewoman for RBC in New York, and Mark Lane, a spokesman for Barclays, declined to comment.

Officials in Harris County, Texas, and Los Angeles explored ways to reduce what they owed to banks, only to later abandon the efforts without success.

Political Push

In Chicago, labor unions facing pension-benefit cuts have pushed for officials to challenge the fees, saying the city wasn’t fully apprised of the risk.

“If you pay now the taxpayers will end up paying for them for the next 30 years,” said Saqib Bhatti, the director of ReFund America, which has been working with unions and other groups on the swaps. It’s backed in part by the Roosevelt Institute, a think tank that looks for ways to restructure government. “It doesn’t put the deal behind you, it puts it on the books so you’re paying it for the next 30 years.”

In 2014, Chicago’s lawyers looked into whether there were grounds for a legal challenge by interviewing current and former employees and pouring through thousands of pages of documents. They didn’t find any basis to sue.

“If we thought there was a valid claim that we could pursue against the swap counterparties — please be assured we would vigorously pursue it,” Jim McDonald, a city attorney, told reporters on a conference call this month. “We had a very thorough review done, and we did not find a legal basis for pursuing any such claim.”

On January 13, Chicago’s city council held off on authorizing a $200 million bond issue that would cover the derivative-cancellation fee. Brown, the CFO, will discuss the deal with city council members at a meeting again next month.

The financing would finish Emanuel’s plan to eliminate the risks tied to such deals, which have triggers that give banks the right to demand that bonds be paid off early and the derivatives canceled if the city’s ratings fall below a certain threshold.

Poppe, the city spokeswoman, referred to Brown’s previous remarks when asked to comment. In a Jan. 21 letter to aldermen, the CFO said the city continues to “aggressively negotiate the water swap termination payments to ensure the smallest payment possible.” Barclays, which took over part of a water-bond swap from UBS AG, lowered the rating threshold, which prevented Chicago from facing an immediate demand to pay it off.

Officials probably never should have entered the agreements in the first place, said Richard Ciccarone, who follows municipal finance as president of Merritt Research Services in Chicago.

“They should have turned them down because they involved betting the public’s money on interest rates,” said Ciccarone.

Bloomberg Business

by Darrell Preston and Elizabeth Campbell

January 28, 2016 — 9:01 PM PST Updated on January 29, 2016 — 5:35 AM PST


The High-Yield Munis That Conquered 2015 Seen Overpriced in 2016.

For investors in high-yield municipal bonds, the downside of making money in 2015 while other risky-debt buyers suffered losses is they’ll be hard-pressed to do it again in 2016.

Junk-rated munis returned 1.8 percent last year, in contrast to declines of 0.8 percent, 4.5 percent and 22 percent for U.S. high-yield loans, corporate securities and floating-rate notes, respectively, Barclays Plc data show. Energy companies dragged down returns as oil prices continued to slide, raising the risk of defaults. Taxable company debt is down another 2.2 percent this month through Jan. 27, while tax-exempt bonds gained an added 0.1 percent.

The divergence can’t last, say Standish Mellon Asset Management and Wells Capital Management. State and local bonds benefit from stronger credit quality than their corporate counterparts, leaving investors more willing to lend to lower-rated borrowers to pick up extra yield with interest rates near generational lows.

Only 7.5 percent of tax-exempt debt rated junk by Moody’s Investors Service defaults within 10 years, compared with 32.4 percent of corporate securities. Yet this year may come down to what’s cheap and what’s not.

“We’re at a crossroads,” said Lyle Fitterer, head of tax-exempt debt in Menomonee Falls, Wisconsin, at Wells Capital, which oversees $39 billion of munis. “If you go back five years, there’s been fairly substantial underperformance of high-yield taxable versus high-yield munis. We’d argue that valuations within the high-yield taxable market look pretty attractive and you’re going to get excess performance.”

Mutual fund investors aren’t getting the message. U.S. corporate high-yield funds saw outflows of more than $4 billion in the past two weeks, Lipper US Fund Flows data show. By contrast, individuals have poured $1.5 billion into high-yield muni funds over the past five weeks, the biggest wave of cash since June 2014.

So-called crossover buyers, who don’t benefit from the tax-exempt interest on municipal bonds yet sometimes buy it anyway when it gets too cheap, are in the best position to capitalize and add high-yield corporate debt, Fitterer said.

That could come at the expense of individual investors, who hold the majority of munis through private accounts or mutual funds. They have shown signs of chasing performance by pouring money into the market when it’s rallying and yanking it during routs.

That’s particularly risky when it comes to the high-yield muni market. Apart from bonds backed by tobacco settlement money, many of the securities were issued for small, stand-alone projects. On some occasions, a few investors own the entire deal.

“We are at rich valuations in muni high-yield and we’re more likely to revert to the mean to look more like corporate high-yield, so it wouldn’t be the time in the cycle to buy,” said Christine Todd, head of tax-sensitive strategies at Standish Mellon, which oversees about $30 billion in munis. “When you own municipal high-yield, you do have a danger of finding yourself owning illiquid securities that can’t be traded.”

That risk came to fruition in 2013, during what became known as the Taper Tantrum. The $1.9 billion Market Vectors High Yield Municipal Index exchange-traded fund, used as a proxy for the market, tumbled 14.3 percent in a month from its near-record high. It still hasn’t recouped the price decline.

Other investors, including Nuveen Asset Management, aren’t as quick to call an end to the current rally.
While the bonds appear expensive relative to alternative assets, so does the municipal market as a whole: The ratio of benchmark 10-year AAA yields to U.S. Treasuries tumbled this month to the lowest since 2011, signaling that state and local debt is relatively pricey. That means high-yield securities, with larger interest payments to offset any price declines, could still fare best among tax-exempt obligations.

“The relative value versus corporate high-yield really represents the blowing out of spreads in corporate high-yield,” said John Miller, who runs Nuveen’s $11.8 billion high-yield muni fund, the largest of its kind. Riskier tax-exempt bonds are still attractive because “defaults are running below average and AAA yields are also running below average, but tax obligations for the highest income brackets are the highest since 1986.”

While the high-yield muni market is alluring for wealthy investors after adjusting for taxes, the low-hanging fruit is gone and few segments are worth the risk at current prices, Pacific Investment Management Co. portfolio managers David Hammer and Sean McCarthy wrote in a Jan. 24 report. The company’s $626 million high-yield muni fund outperformed 99 percent of peers over the past year. They’re adding debt with stronger credit ratings.

“Increased volatility can present great opportunities for investors who are well-positioned, but it also can be a land mine for those who aren’t,” Hammer and McCarthy wrote. High-yield municipal debt investors should be “equipped to play defense if conditions warrant.”

Bloomberg Business

by Brian Chappatta

January 27, 2016 — 9:00 PM PST Updated on January 28, 2016 — 5:58 AM PST


Fitch Rating Criteria for Variable-Rate Demand Obligations and Commercial Paper Issued with External Liquidity Support.

Read the Criteria.

January 28, 2015


SIFMA U.S. Municipal VRDO Update, December 2015.

A brief historical stat sheet to the municipal ARS, FRN, and VRDO market ending December 2015. In Excel format only.

Download.

January 27, 2016


GFOA Executive Board Approves New Best Practices and Advisories.

On January 22 the GFOA’s Executive Board approved five best practices and an advisory to provide guidance to government finance officers in the areas of budgeting, accounting, retirement benefits administration and debt issuance. A summary of each is provided below.

Budget Consolidation

This new best practice was developed by the GFOA Budget Committee to help finance officers ensure that entity-wide budget totals do not contain double-counting. While accounting standards require items to be recorded in separate funds, interfund activity is eliminated from government-wide consolidated budget totals in financial statements. As budget consolidation occurs, finance officers need to safeguard against double-counting, yet there is limited guidance on how best to accomplish this. This new best practice offers specific guidance to finance officers on how to ensure that government-wide financial statements do not contain double-counting.

Incorporating the Capital Budget into the Budget Document

In developing this best practice the GFOA Budget Committee and Committee on Capital Planning and Economic Development merged and revised the two existing GFOA best practices Presenting the Capital Budget in the Operating Budget Document and Incorporating a Capital Project Budget in the Budget Process. The new document recommends that finance officers adopt a formal capital budget as part of their annual or biennial budget process and provides guidelines to finance officers on incorporating information from the capital budget within the budget document.

Sustainable Funding Practices for Defined Benefit Pensions and Other Postemployment Benefits

The GFOA Committees on Budget; Accounting, Auditing, and Financial Reporting; and Retirement and Benefits Administration collaborated to revise this best practice, which recommends that state and local government officials ensure that the costs of defined benefit (DB) pensions and other post-employment benefits (OPEB) are appropriately measured and reported. The best practice was updated to (1) provide guidance on how to ensure sustainability of DB pension plans and OPEB, (2) outline what to include in funding policies related to DB pension plans and OPEB and (3) provide recommendations on how to reduce volatility of annual contributions to DB pension plans and OPEB.

Ensuring Other Postemployment Benefits (OPEB) Sustainability

The GFOA Committees on Budget; Accounting, Auditing, and Financial Reporting; and Retirement and Benefits Administration also collaborated to revise this best practice, which recommends that governments ensure OPEB sustainability by evaluating key items specifically related to OPEB, including the structure of benefits offered, the associated benefit cost-drivers, and clear communication to stakeholders. The best practice was primarily revised to focus on sustainability measures specific to OPEB, particularly as related to structure and managing costs of benefits offered.

Framework for Internal Control: The Control Environment

The GFOA Committee Accounting, Auditing, and Financial Reporting developed this new best practice as a follow-up to the 2015 best practice Establishing a Comprehensive Framework for Internal Control, which recommends that state and local governments adopt the Committee of Sponsoring Organizations’ (COSO) Internal Control—Integrated Framework (2013) as their conceptual basis for designing, implementing, operating, and evaluating internal control. The Best Practice said that this would provide governments with reasonable assurance that they are achieving their operational, reporting, and compliance objectives. To support governments’ efforts in this area, the GFOA is developing Best Practices that explain how to implement each of the five components of that Framework. This Best Practice focuses on the first of those five components, the Control Environment, which the COSO has defined as a set of standards, processes, and structures, that provide the basis for carrying out internal control.

Enhancing Tax Abatement Transparency

The GFOA Committee on Accounting, Auditing, and Financial Reporting organized this new best practice to provide recommendations to government finance officers about disclosing tax abatements to comply with GASB Statement No. 77, Tax Abatement Disclosures. The GASB statement requires the disclosure in the notes to the financial statements of only a portion of the information necessary toward understanding the complete justifications and implications of providing tax abatements. GFOA recommends that governments enhance tax abatement transparency and provide a description of the policies governing tax abatements, including what the government is hoping to achieve by utilizing them, and the methodologies used to determine the entity’s return on investment from them.

OPEB Bonds

The GFOA’s Committee on Retirement and Benefits Administration and Committee on Governmental Debt Management collaborated to revise this best practice to advise governments against issuing OPEB bonds, and provides a summary of the risks associated with issuing these products.

Wednesday, January 27, 2016


S&P: Management is Key for U.S. Water Utilities to Align Operations and Finances.

In 2002 Standard & Poor’s Ratings Services published the “Top 10 Ways To Improve Or Maintain A Municipal Credit Rating.” The article notes that “In addition to quantitative factors, qualitative information factors heavily into credit analysis.” Simply, some factors that are important to credit quality are difficult to measure. In that regard, municipal waterworks and sanitary sewer utilities are not unlike any other rated issuer: there is a strong correlation between leadership and ratings. And the decentralized and autonomous nature of U.S. local governments creates an even stronger link between management and credit quality.

In 2007, the American Water Works Assn. (AWWA), the U.S. Environmental Protection Agency, and others in the sector identified attributes of effective utility management. In addition, we observe that highly rated utilities generally — but not always — have an alignment among operational, financial, and strategic goals that recognize that the organization has not only external, but also internal, stakeholders. Strong management alone can lend itself to operational and fiscal continuity and can serve as a stabilizing factor for more than just the rating. Strong management combined with favorable assessments in other rating factors can even be buoy credit quality. For example, liquidity and reserves provide working capital, fund unexpected operational problems, and enhance general budgetary flexibility. If management acts to make liquidity likely to be consistently robust, then, if contingent liabilities become actual liabilities, liquidity and management strength can together moderate or even free a utility from distress. Conversely, the absence of liquidity and management strength together creates a limiting factor and often leads to rapid credit deterioration.

Overview

Continue reading.

19-Jan-2016


S&P: Affordability as a Component of U.S. Water and Sewer Utility Ratings.

Despite its capital intensity, the U.S. water utility sector is generally an efficient one, in Standard & Poor’s Ratings Services’ view. We have seen utilities and their representatives employ public education campaigns to help gain buy-in of critical proposed rate adjustments by noting that a typical household water and sewer bill is still less expensive in absolute dollars than a mobile phone or cable or satellite television bill even after a much larger rate change for the water and sewer bill (see chart). In the U.S., for every gallon of gasoline, a residential customer could receive between 500 to 1,000 gallons of drinking water, depending on current gasoline prices.

Overview

Continue reading.

19-Jan-2016


An Overview of Standard & Poor's Updated Methodology for Rating U.S. Public Finance Waterworks, Sanitary Sewer, and Drainage Utility Systems.

On Jan. 19, 2016, Standard & Poor’s Ratings Services published its updated criteria for rating waterworks, sanitary sewer, and drainage utility systems in the U.S. The update is part of our regular criteria review process, and its goal is to provide additional transparency and comparability to help market participants better understand our approach in assigning ratings to U.S. public finance waterworks, sanitary sewer, and drainage utility systems, to enhance the forward-looking nature of these ratings, and to enhance the global comparability of our ratings through a clear, comprehensive, and globally consistent criteria framework.

Continue reading.

19-Jan-2016


S&P RFC Process Summary: Rating Methodology and Assumptions for U.S. Municipal Waterworks and Sanitary Sewer Utility Revenue Bonds.

On Dec. 10, 2014, Standard & Poor’s Ratings Services published a request for comment (RFC) on its proposed approach to analyzing bonds supported by municipally-owned water and sewer utilities in the U.S. Following feedback from the market, we finalized and today published our criteria “U.S. Public Finance Waterworks, Sanitary Sewer, And Drainage Utility Systems: Rating Methodology And Assumptions”.

Standard & Poor’s received comments from participants representing the utility, banking and underwriting, municipal financial advisory, and academic communities. Based on feedback, we have revised certain factors for the purposes of further clarity and transparency.

This RFC process summary provides an overview of the substantive changes between the RFC and the final criteria. We considered all comments, made many changes in response, but did not make all changes suggested. Since the original RFC, we also made some stylistic and wording changes to ensure consistency among other criteria published by Standard & Poor’s. We have added references to related criteria already published by Standard & Poor’s with details on how these criteria apply to municipally-owned water and sewer utilities. We also corrected a few very minor technical errors in the publication. The changes outlined below summarize the material changes made based on market feedback and further refinements of the methodology based on extensive testing of its application to municipally-owned water and sewer utilities. All paragraph citations are in reference to the final criteria unless otherwise noted.

Continue reading.

19-Jan-2016


S&P Credit Rating Model: Water/Sewer Credit Scoring.

Standard & Poor’s Ratings Services uses the results of its Water/Sewer Credit Scoring Model to perform standardized credit analysis for assigning water and sewer ratings based on its criteria methodology.

Purpose Of The Model

Standard & Poor’s criteria, ” U.S. Public Finance Waterworks, Sanitary Sewer, And Drainage Utility Systems: Rating Methodology And Assumptions”, published Jan. 19, 2016, explains our methodology for assigning issue credit ratings, issuer credit ratings (ICRs), and ratings derived from stand-alone credit profiles (SACPs), based on waterworks, sanitary sewer, and drainage utility revenue pledges of local and regional governments (LRG) in the U.S. The Water/Sewer Credit Scoring Model applies the criteria methodology. By standardizing the calculations and inputs used in our analysis, the model provides for the consistent application of the referenced criteria.

The model is used to perform credit analysis for new issuance and surveillance of ratings assigned to waterworks, sanitary sewer, and drainage utility systems of a U.S. municipality or comparable political subdivision, and whose debt is secured by revenues derived chiefly from user charges for the ongoing operations of drinking and/or raw-water sales, sanitary sewer collection, and/or treatment, and/or storm drainage systems, or some combination thereof, directly to the end (retail) customer.

Use of the model is intended to enhance comparability across sectors and improve transparency and consistency in deriving ratings. The model is also used whenever analysis is needed to derive credit assessments or credit estimates.

Continue reading.

19-Jan-2016


S&P Credit FAQ: All-In Coverage, Transfer Payments, and Credit Quality.

U.S. local and regional governments commonly have some kind of financial interplay between the general government and other affiliated enterprises, such as municipally owned utilities. In fact, it is uncommon for there not to be some kind of transfer payment. As Standard & Poor’s Ratings Services noted in “Methodology: Definitions And Related Analytic Practices for Covenant And Payment Provisions In U.S. Public Finance Revenue Obligations,” published Nov. 29, 2011, transfers are based on an open flow of funds, meaning that after all operating expenses have been paid and other covenanted funds are filled, surplus net revenues can be used for any lawful purpose, including movement to another governmental fund, department, or component unit.

Just as there are many different labels for these transfer payments — payment in lieu of taxes (PILOT), franchise fees, and the like — so are there many perfectly reasonable justifications for these payments to take place. Most often, the general government considers its capital and credit quality to be at risk based on its ownership and operation of an enterprise, such as a utility, and the general government deems the transfer payment as a return on the investment for taking that risk. Other very common reasons for transfer payments from the utility to the general government include:

To provide additional transparency and clarity about Standard & Poor’s view of transfer payments, we have provided answers to questions that we commonly are asked.

Frequently Asked Questions

To what extent do transfers from the utility fund to the general fund affect credit quality?
The mere existence of transfers is so commonplace that the analyst will look to what logic, if any, is behind the transfer. Some transfers are driven by a formula, such as a percentage of gross operating revenues, the net depreciable value of the utility system’s assets, or the number of units sold of a utility’s services. Predictability and discipline lend themselves to being credit-neutral. Open-ended transfer payments are usually a credit negative.

What are open-ended transfers?
Open-ended transfers occur when a general government can take as much of the utility’s surplus cash as it deems necessary. We would usually view this as a credit negative to both the general and utility funds. Open-ended transfers imply that the general fund is structurally imbalanced, is being subsidized (probably materially) by ongoing utility operations, and is vulnerable to fluctuations and negative budget variances in the utility fund. It is also harmful to the utility because it is an impediment to the utility accumulating and maintaining cash reserves that might otherwise be available for ongoing utility needs, unbudgeted emergencies, or debt-free system reinvestments.

How does Standard & Poor’s determine if, in its opinion, there is an over-reliance on utility transfers?
Standard & Poor’s core coverage metric is all-in coverage, also known as fixed-charge coverage, which we view as the best way to track the use of every dollar of utility operating revenues. This metric is our adjusted debt service coverage metric that treats certain debt-like obligations as if they were the actual debt of the utility, even if legally they are treated as an operating expense, such as contractual take-or-pay minimums or capacity charges. This metric also treats transfer payments as an operating expense. While we understand that under most bond indentures transfers are considered a use of surplus net revenues, we view them as recurring obligations of utility operating revenues and, therefore, include them. Weak all-in coverage, usually near or even below 1.0x, could indicate that transfer payments are relatively large, among other risks.

What is the formula for all-in coverage?
[(Revenues – Expenses – Total Net Transfers Out) + Fixed Costs] /(All Revenue Bond Debt Service + Fixed Costs + Self Supporting Debt Service)

Total net transfers out are defined as transfers from the utility fund minus transfers into the utility fund, including but not limited to:

We deem net transfers out that legally or by practice support debt service of another governmental fund as part of the denominator’s self-supporting debt. Cash that does not truly leave the utility, such as a set-aside into a rate stabilization reserve or pay-as-you-go fund are not included as transfers out. Similarly, the application of a rate stabilization fund (RSF) or other cash on hand as a transfer in would not be included in the all-in coverage calculation

We have determined, based solely on the developments described herein, that no rating actions are currently warranted. Only a rating committee may determine a rating action and, as these developments were not viewed as material to the ratings, neither they nor this report were reviewed by a rating committee.

19-Jan-2016

Primary Credit Analyst: Theodore A Chapman, Dallas (1) 214-871-1401;
[email protected]

Secondary Contact: David N Bodek, New York (1) 212-438-7969;
[email protected]


S&P: U.S. Higher Education Was Stable Overall in 2015, Despite Rating Changes Reaching an All-Time High.

The U.S. higher education sector’s credit quality remained predominantly stable in 2015 despite a record number of rating changes. Standard & Poor’s Ratings Services took 51 rating actions last year, 41 downgrades and 10 upgrades, and affirmed the approximately 80% of remaining ratings.

Continue reading.

Jan. 19, 2016


S&P: Collapsing Oil Prices Seep Into State Credit Profiles.

In its recent state sector outlook, Standard & Poor’s Ratings Services identified 11 states as coming under negative fiscal pressure at the start of 2016. Low and declining oil prices explain much of the pressure in at least five of these states. Not all states with significant oil producing sectors are faced with fiscal pressure to the same degree, however. There are several variables that explain why some oil producing states are more immediately affected in their budgets by falling oil prices than others. These include:

In short, the more aggressive a state was with regard to its assumptions and use of oil-related revenues during the oil boom, the more acute its fiscal pressure now, in the oil price bust. For states with greater budgetary reliance on oil-related revenue, the unrelenting decline in prices places a larger burden on state lawmakers to identify and enact corrective fiscal measures. Short of something not easily forecasted, such as a supply shock stemming from turmoil in the Middle East, it’s unlikely that state policymakers will be bailed out by a sharp rebound in oil prices. On the contrary, as of early 2016, and with sanctions on Iran being lifted, oil prices have continued to fall and are now well below what the states had forecasted. At this point, all of the states in our survey still have a higher price forecast for 2016 than does Standard & Poor’s ($40 per barrel). For fiscal 2017, only one state (North Dakota) forecasts a price range in line with our forecast price ($45 per barrel); the other states still have a more bullish outlook. This suggests that as they head into budget season, fiscal pressures in these states could be more intense than what their official forecasts currently anticipate. (See “S&P Lowers Its Hydrocarbon Price Deck Assumptions On Market Oversupply; Recovery Price Deck Assumptions Also Lowered,” published Jan. 12, 2016 on RatingsDirect.)

Some oil producing states have partially mitigated the effect of commodity market volatility on their budgets by segregating the oil-related revenue, putting most of it in reserves or special funds. But with producers reining in their operations, economic losses are not confined to just the energy sectors in these states. Overall job growth from among the oil producing states in our survey is now materially lower than for the nation as a whole. According to the Bureau of Labor Statistics, whereas total nonfarm payroll jobs increased 1.9% during the 12-month period through November 2015, the eight states in our survey saw job growth of just 0.9%. Not surprisingly, lower than expected job and economic growth is showing up in the recent revenue data reported by Texas, North Dakota, Louisiana, and Oklahoma, where collections have fallen short of the budget forecast. There are also signs of expenditure side pressure where job losses translate to higher demand for social services. For example, public assistance expenditures in Texas are running ahead of budget in fiscal 2016 while tax collections are lagging fiscal 2015 receipts through the same date. This environment contributes to our belief there is potential for an uptick in rating volatility in the state sector during 2016.

Continue reading.

21-Jan-2016


Chicago School Bond Sale May Attract Unusual Investors.

Chicago’s struggling public school district could lure hedge funds and other investors with an unusual opportunity to buy high-yield municipal assets while pivoting attention away from Puerto Rico’s distressed debts.

The Chicago Board of Education’s $875 million bond issue next week comes as the nation’s third-largest public school system struggles with a structural budget deficit of at least $1 billion.

Rated below investment-grade, the Chicago Board of Education is likely to attract a new class of investors not typical to the municipal bond market. The new deal may see interest from hedge funds and private equity funds, taxable investors who do not necessarily benefit from tax-exempt paper, said Michael Comes, portfolio manager and vice president research at Cumberland Advisors.

“This is similar to what happened in Puerto Rico, where it shut itself out of the muni market,” said Comes. “I think we’re at the cusp of that with the Chicago Board of Education deal.”

This week, Republican legislators pushed the idea of a state takeover and potential bankruptcy plan, a proposal favored by Illinois Governor Bruce Rauner but quickly shot down by Democrats who control the legislature.

Such distress signs also caught the attention of municipal bond insurers such as Assured Guaranty, MBIA, and Ambac Financial Group, which have until now been focusing intently on developments in Puerto Rico. But news from Illinois served “as a reminder that there are multiple drivers of the insurers’ share prices,” BTIG Research Group said on Friday.

The district’s so-called credit spread widened over Municipal Market Data’s benchmark triple-A scale in secondary market trading on Thursday to 464 basis points for bonds due in 19 years from 412 basis points two weeks ago. That signals investors will demand hefty yields for the junk-rated general obligation bonds. Financially stressed Illinois and the city of Chicago were able to sell bonds this month at spreads much narrower than the school district’s.

Still, demand for muni bonds is high among investors, as cash saturates the market and supply remains low. Recent trouble in the equity market has intensified investors’ interest, as the idea of municipal bonds as a safe haven asset takes hold.

“There is a lot of interest in muni high yield, and there’s not much out there,” said Alan Schankel, municipal strategist at Janney Fixed Income Strategy. “Munis outperformed other fixed income asset classes last year, and I think they are likely to do the same thing this year.”

Chicago Board of Education’s issue includes a refunding and restructuring of outstanding debt to convert variable-rate bonds to fixed rate and to push out maturities on other bonds to free up money for the school system’s sagging budget. The issue will also raise money to cover fees to terminate interest rate swaps related to the variable-rate debt.

Tax-exempt bonds totaling $795.5 million will be offered in term maturities in 2035, 2040, and 2044, according to the preliminary official statement. Another $79.5 million of taxable bonds are due in 2033.

Reuters

Jan 22, 2016

(Reporting by Robin Respaut in San Francisco and Karen Pierog in Chicago; Editing by Tom Brown)


Illinois Budget Crisis: Big Banks Aren’t Sharing State Debt Woes.

The state of Illinois has been without an official budget since July, and service providers that rely on state funding have felt the squeeze. Programs that deliver hot food to seniors in southwestern Illinois and outside of Chicago, for example, are preparing to halt operations, and low-income college students have seen promised tuition subsidies vanish.

The western Illinois Child Abuse Council has responded to the frozen state budget by reducing therapy services staffing by 20 percent and home visits by 40 percent. The nonprofit’s counseling program, which serves children under 5 years old who have suffered trauma and abuse, has begun turning away families as the waitlist stretches to record length.

“We’re the only ones providing these services in the community,” said Angie Kendall, the organization’s director of development. “We don’t have an alternative at this point.”

Even as crucial social service programs face deep reductions, one set of institutions has enjoyed an uninterrupted flow of funds from Springfield: banks. Financial service providers continue to pull in nearly $70 million a year in payments on complicated public debt deals from the early 2000s.

With the state’s financial woes deepening, banks — including JPMorgan Chase, Goldman Sachs and Citigroup — stand to take in as much as $1.45 billion on interest rate swap payments by 2033. That’s the conclusion of a new report from the ReFund America Project, which tabulated the costs stemming from the swaps weighing on the state’s books.

“These toxic swaps have been an unmitigated disaster for the state, failing in almost every way,” said Saqib Bhatti, a fellow at the Roosevelt Institute and one of the report’s co-authors, in a statement Tuesday. “If state officials knew then what we know now, it would have been financially irresponsible for them to have signed these deals.”

Illinois is just one of many states and municipalities bitten by interest rate swaps gone awry. The list includes the city of Chicago, which has sought to pay around $300 million in penalties to exit its own bad bets after doling out record debt fees in 2015.

“Hindsight is easy,” said Richard Ciccarone, president of Merritt Research Services, which specializes in municipal bonds. “But in this case it just looks like it’s a bad deal. The markets did not work out in their favor.”

Labor leaders, who fear the state’s fiscal difficulties will imperil their members’ pension payouts, have pressed Illinois to make banks share in the fiscal pain, asking Republican Gov. Bruce Rauner to “aggressively pursue” means of recovering swaps fees, arguing that banks made misrepresentations when they sold the swaps.

Gov. Rauner, whose contested budget plan calls for limits to collective bargaining, rejected provisions related to the swaps in contract negotiations. “The union is concerned that the Rauner administration is putting big banks first,” said James Muhammad, a spokesman for Service Employees International Union Healthcare Illinois.

In a statement to the International Business Times, however, the administration did not rule out seeking a way to limit the damage from the swaps. “The Governor’s Office of Management and Budget is doing an in-depth analysis of these swaps in order to reduce the state’s payments and minimize its financial exposure,” said Catherine Kelly, Rauner’s press secretary.

An interest rate swap is type of financial derivative that allows a bond issuer — like the State of Illinois — to limit or manage exposure to fluctuations in interest rates. The issuer pays a fixed interest rate on a floating-rate bond. The bank on the other side of the swap pays the variable rate and pockets the difference between the fixed and floating rates.

When Illinois first entered into the now-costly swap deals in the early 2000s, the intention was to hedge risks and save money on the billions of dollars in variable-interest bonds that state agencies had issued. These bonds, issued under former Gov. Rod Blagojevich, are pegged to fluctuations in the broader interest rate environment.

But in order to lock in what state financiers saw as bargain interest rates, the governor’s office entered into swap agreements with 10 major Wall Street banks. Under the deals — which are commonplace in the corporate world — the state would pay the banks a fixed interest rate, while the banks paid bondholders the variable rate. In theory, the maneuver would protect the state from sharp interest rate moves.

The arrangement didn’t work that way in practice. When the global financial crisis struck in 2008, the Federal Reserve slashed benchmark interest rates virtually to zero. Unlike mortgage holders other debtors, Illinois wasn’t able to refinance at the lower rates. The swaps kept the state locked into rates nearly 4 percent higher than what its bank partners were paying bondholders.

The state has paid $618 million in swap fees since 2003, according to the ReFund America report, with another $832 million yet to come. While Ciccarone noted that those totals include the interest Illinois would have otherwise paid on the variable-interest bonds, they also include tens of millions of dollars in additional costs related to the complex requirements that swaps entail.

Those fees might not be all. Today, with interest rates still scraping historic lows, termination fees totaling $286 million prevent the state from exiting its swap agreements.

The ongoing budget crisis threatens to force a raft of penalties even sooner. Ratings agencies Moody’s and Fitch both downgraded Illinois state debt in October. If those ratings drop to junk status — as Chicago’s debt did last year — Illinois could suffer automatic terminations written into the agreements. These clauses levy a penalty for exiting the deal early that is based on the present value of future payments on the swaps.

“They’d have to come up with that amount of money right away,” said Ciccarone. “It wouldn’t be an easy thing to do while they’re already so hard-pressed for cash.” For their part, the banks would have the option to forgo termination fees in lieu of renegotiating the agreements.

Labor leaders, however, are hoping for a different type of negotiation, one that might recoup past fees from Wall Street. The campaign comes a month after the Chicago Teachers Pension Fund sued dozens of banks over the doomed interest rate swaps that have added to the city’s soaring debts.

Bhatti of the Roosevelt Institute said the lawsuit has a chance, noting that while corporate bond issuers generally take out swaps for a relatively safe period of five to seven years, the state agreements last three decades or more. “We believe the banks that pitched these deals to the state misrepresented the risks,” Bhatti said.

Ciccarone was skeptical that Illinois could prevail in court, given the apparent financial sophistication of state finance officers. As for the banks that profited off of the state’s bad fortune, he said it was luck as much as anything that accounted for the windfalls.

“They made more money than they ever expected,” Ciccarone said. “They were on the right side of the trade.”

INTERNATIONAL BUSINESS TIMES

BY OWEN DAVIS

01/19/16 AT 3:38 PM


U.Municipal Water Utilities: No News is (Probably) Good News; The Outlook is Stable

As we noted in our recently released criteria, we view the municipal waterworks and sanitary sewer sector as one with very low risk. The sector:

It remains a very highly rated sector, and upgrades continue to outnumber downgrades. But that does not mean the sector itself is without risk.

Utilities by nature are extraordinarily capital-intensive, and that capital is generally raised by borrowing; there is no such thing as a municipal initial public offering or equity cushion. Furthermore, the inherent stability does not completely insulate particular issuers from their own unique challenges. We have observed that most of our downgrades in 2015 were associated with weakened finances, not economic deterioration, and we believe that will continue to be the case. Utility managers and elected officials continue to have to manage the “triple bottom line,” balancing a utility’s revenue requirements and financial commitments versus social policies versus the utility’s role as an environmental steward. If at one end of the scale drinking water is viewed by users as a human right that should be free of price, versus being viewed as a commodity, the United States is somewhere in between. We believe that in the U.S. we are moving in the direction of commodity pricing as Americans slowly gain appreciation for the true value of water, usually only if there is temporary scarcity such as a drought. We also view 2016 as a turning point that will potentially mark the beginning of the first wave of new regulations in a number of years.

Overview

Continue reading.

20-Jan-2016


Cities’ Pension Liabilities Are About to Look a Lot Worse.

A new GASB rule affecting cities that are part of state cost-sharing retirement plans will be painful, but it’s a step forward.

A new rule from the Government Accounting Standards Board (GASB) requiring municipalities that participate in plans in which they share pension costs with states to allocate and disclose their share of unfunded pension liabilities provides states with some much-needed good news when it comes to pension finances, but it comes at the cost of cities’ balance sheets. Hopefully the enhanced transparency will prompt cities to take measures to address their long-term liabilities.

The cost-sharing plans affected by the new GASB rule are those in which pension obligations and assets are pooled and the assets can be used to pay benefits for any participating government employer. A new issue brief from the Center for State and Local Government Excellence samples 173 municipalities and finds that 92 of them are affected by the new rule because they either participate exclusively in a state retirement system or both administer their own plan and pay into a state system.

Most of the largest cities administer their own plans exclusively and are therefore unaffected by the rule. But the impact is significant for cities that are subject to it. On average, their unfunded pension liability as a percentage of own-source revenues rose from 37 percent to 70 percent (the brief is largely based on 2012 reports).

There is a great variation in how much individual cities are affected. As a result of the new rule, unfunded pension liability as a percentage of overall revenue rises by less than 20 percentage points in 37 of the 92 cities, but it increases by over 60 points in 25 of them.

For example, Newark, N.J., doesn’t administer its own pension plan and has therefore never been included in studies of local systems. But when its portion of unfunded state pension liability is allocated, the amount is a breathtaking 284 percent of city revenues. Cincinnati, Las Vegas and Portland, Ore., are among other cities in which unfunded liabilities are more than 200 percent of revenues.

Why is the new GASB rule good news for states? While it doesn’t change overall liabilities, its requirement that they be allocated and reported results in state liabilities falling by the same amount that municipal liabilities rise.

Nobody likes getting bad news, but it still beats ignorance. For that reason, the new rule is a step forward. Almost a decade ago, when new GASB rules required municipalities to disclose their liability for non-pension post-retirement benefits such as health care, the often-huge numbers caused many municipalities to implement mechanisms to pay down that liability over time. If this newest rule has the same impact, that’ll be good news for retirees and taxpayers alike.

GOVERNING.COM

BY CHARLES CHIEPPO | JANUARY 22, 2016


Oil's Collapse Hurting States That Were Counting on $50-a-Barrel.

When Louisiana, one of the nation’s biggest energy-producing states, decided how much tax money the government would have to spend this year, it forecast that the price of oil would be almost $50 a barrel. It’s since tumbled to below $32, casting economic ripples that helped create a $750 million budget shortfall.

The price of crude, which is recovering from a 12-year low, has emerged as a major source of fiscal strain on the nation’s oil-patch states, none of which predicted how swift or deep the drop would be. That’s prompted a reversal-of-fortune in capitals that once reaped revenue windfalls from America’s energy-industry renaissance and are now racing to adjust.

“They’re playing catch-up in getting their estimates in line with what’s happening with spot prices,” said Gabriel Petek, a municipal-bond analyst in San Francisco for Standard & Poor’s who’s been tracking the fiscal impacts, speaking of energy states revising price forecasts. “It doesn’t look like prices are coming up soon, so if the prices stay low it could pressure their budget positions.”

A report released Thursday by S&P said the energy rout is a main culprit in at least five of the 11 states that are facing financial pressure this year as jobs and counted-on tax collections disappear. The price of oil, which traded for more than $100 less than two years ago, has been cut in half since June amid concerns about the slowing pace of overseas economies, even with a rally Friday that pushed it up more than 7 percent.

Besides Louisiana, it’s being felt largely in Alaska, New Mexico, Oklahoma, and North Dakota, the credit-rating company said. But it’s also cropping up elsewhere: In Texas, the largest producer, the impact has crimped sales-tax collections and increased the cost of public-assistance programs for those out of work. In states with the big energy industries, payrolls expanded by 0.9 percent in the year through November, less than half the rate for the U.S., according to S&P.

Sales-Tax Increase

For Louisiana, the lower prices — along with rising health-care costs — are a driver of the projected $1.9 billion deficit for the year that begins in July. With its finances squeezed, investors have demanded higher yields to own some of the state’s debt. Fuel-tax backed bonds maturing in 2041 traded Friday for a yield of 3.17 percent, or 1.48 percentage point more than top-rated securities. That gap is up from 0.78 percentage point in May.

To help close the gap, Governor John Bel Edwards, a Democrat in his second week in office, proposed raising the sales tax by 1 percentage point to 5 percent. That would give the Gulf Coast state the highest average state and local sales-tax rate in the country, according to the Tax Foundation in Washington.

Edwards has also proposed tapping reserves, cutting spending by about 10 percent and drawing on compensation Louisiana received for the BP Plc oil spill.

“The decline in oil prices certainly isn’t helping us,” said Julie Payer, the governor’s deputy chief of staff. “It’s a factor in layoffs that are affecting industries in the state.”

Louisiana may reduce the $48 barrel oil price it used in budget projections in November when it puts out new estimates next month. “It hasn’t been getting any better,” Payer said.


Oklahoma expects tax collections to fall short of its initial estimates by 7.7 percent in the current budget year and by 13 percent in the next, which led Governor Mary Fallin to implement across-the-board spending cuts, according to S&P. Similar reductions are likely in North Dakota.

Alaska, with 79 percent of its operating revenue drawn from oil, lost its AAA rating from S&P this month after its deficit widened. The state assumed prices of more than $67 a barrel when it passed its budget last year, only to cut it later to about $50. The rating outlook remains negative, indicating another downgrade could come if the state fails to curb its deficit during this year’s legislative session. Governor Bill Walker said in a statement this month that the cut “further solidifies the need to address our state’s fiscal challenges.”

“Alaska stands out as the most exposed,” said Petek, the S&P analyst.

Texas Comptroller Glenn Hegar revised his revenue estimate for fiscal 2016 and 2017 down in October to $110.4 billion from $113 billion. Even so, the state’s vast and diversified economy has left it better buffered than other states: The revised figure still exceeds the $106 billion in the current two-year budget, said Chris Bryan, spokesman for Hegar.

The drop in Texas’s collections of energy-severance taxes will cut contributions to the government’s funds that are used to build highways and mitigate the impact of economic slowdowns on the budget. Estimates for contributions to those funds have been cut by half for fiscal 2017. The state’s reserves are still expected to be about $10.5 billion in 2017.

“We’re still way ahead of where we would have to be for energy prices to have an impact on the state budget,” said Bryan.

Bloomberg Business

by Darrell Preston

January 21, 2016 — 9:01 PM PST Updated on January 22, 2016 — 7:26 AM PST


Washington State Refinancing Adds to $1 Billion Budget Relief.

State and local governments that routinely borrow by negotiating with investment banks to sell bonds often cite their ability to control the timing of a bond sale as justification. Officials in the state of Washington don’t buy that.

The state sold $673 million of bonds Wednesday through competitive bidding with barely a month to prepare for the sale after the Federal Reserve raised interest rates in December for the first time since 2006. The AA+ state borrowed at 2.02 percent in the 10-year maturity, beating 2.13 percent yield for top-rated debt, according to Municipal Market Analytics Inc. data. JPMorgan Chase & Co. won the bidding.

The state uses competitive bidding for almost all its debt sales except some bonds that rely on unique revenue sources such as so-called Build America Bonds, taxable debt that came with a federal subsidy for two years starting in 2009 to stimulate the economy.

“Washington is a long a way from Wall Street and we want to do everything as transparently as possible, and there’s no better way to demonstrate you got the lowest cost of funds than to put it out for bid,” said Ellen Evans, deputy state treasurer for debt management, in an interview before the bids were awarded. “We get a fantastic cost of funds.”

Historic Lows

Washington state is unique in the $3.7 trillion municipal bond market, where more than three-fourths of all borrowers that sold fixed-rate, long-term debt do so by negotiating with banks. But since 2009 the state has refinanced about $9 billion of debt in more than two dozens sales, cutting annual interest payments by more than $1 billion a year, according to state Treasurer James McIntire.

The state is still benefiting from municipal borrowing costs that remain near historic lows, even after the Fed raised rates. Yields on benchmark 10-year Treasury notes dropped on Wednesday to the lowest level since October as investors sought the safety of sovereign debt as the collapse of oil prices sparked anxiety in markets from stocks to inflation derivatives.

Last year refinancing of outstanding debt accounted for 63 percent of all municipal bonds sold, according to data compiled by Bloomberg. Bank America projected about 60 percent of $450 billion of issuance in 2016 would be to refinance debt to cut borrowing costs.

Escrowed Funds

Washington was planning to sell $530 million of new-money bonds next month after the Fed increased its target rate by 0.25 percentage points Dec. 14. Soon after Evans and her staff realized that while muni rates remained low, the increase in U.S. Treasury rates moved short-term taxable rates high enough the state could fund the escrow needed to advance refund the debt.

In an advance refunding the state borrows to replace existing debt once it is callable by putting the proceeds in escrowed U.S. Treasuries that are redeemed as refinanced debt matures. The escrowed funds must be invested at just the right rate to repay the debt without generating any surplus under U.S. tax law.

“As December started we had no idea we would be in the money to do this at all,” said Evans.

Bloomberg Business

by Darrell Preston

January 20, 2016 — 1:29 PM PST


The Case for Allowing U.S. States to Declare Bankruptcy.

States can’t seek legal protection from their debts, but there’s a move on to change that.

Puerto Rico is trapped in a financial crisis so deep that President Obama says the only way out for the territory is to make it eligible for a bankruptcy-like process to shed some of its debts. None of the 50 states is nearly as bad off as Puerto Rico. But some influential people are arguing that if a state does get into deep financial trouble, some kind of bankruptcy would be the best option—certainly better than a taxpayer bailout.

States, unlike cities and counties, currently can’t declare bankruptcy. The case for allowing it is that a well-run proceeding apportions losses fairly and fast. Lenders and bondholders absorb some of the pain, but so do government workers and retirees. Taxes go up and government services are cut back, but ideally not as severely as in an uncontrolled default. The result is a government that’s streamlined, not gutted.

“Bankruptcy lets you get ahead of the problem,” says David Skeel Jr., a professor at University of Pennsylvania Law School and a leading advocate of giving federal bankruptcy protection to states. Without that option, he says, “what inevitably happens when you’re in deep financial distress is that you have to cannibalize other stuff. You cut police, schools, other services. You reinforce the downward spiral.”

In another scenario, a state that goes broke and has no recourse to bankruptcy may end up seeking help from the federal government. “We want to cut off the politicians from assuming that at the end of their wild overspending they can just dump the responsibilities on other taxpayers,” says former House Speaker Newt Gingrich.

Gingrich and Jeb Bush co-wrote an op-ed in the Los Angeles Times supporting state bankruptcy in 2011, the last time it was seriously debated. At the time, states were reeling from the aftereffects of the financial crisis. During a congressional hearing that year, Senator John Cornyn (R-Texas) raised the issue with then-Federal Reserve Chairman Ben Bernanke. (Bernanke responded that states “have the tools to deal with their fiscal problems and debt.”)

Public employee unions and their supporters trashed the bankruptcy option last time around, afraid that it would give states an easy way to slash their pension obligations. State governments said they didn’t want to be eligible for bankruptcy, fearing that the very possibility would spook investors in municipal bonds and drive up their borrowing costs. And some analysts worried that it would reduce the pressure for budget action. “If you had this out, it would make it a little bit more difficult to persuade people that they need to raise taxes or cut programs,” says Elizabeth McNichol, a senior fellow at the Center on Budget and Policy Priorities.

Treasury Secretary Jacob Lew is seeking to wall off federal relief for Puerto Rico from the explosive question of state bankruptcy. In a letter to House Speaker Paul Ryan on Jan. 15, he pointedly didn’t ask Congress to make Puerto Rico eligible for protection under the federal bankruptcy code. Instead, he said Puerto Rico needs “an orderly process to restructure its debts,” coupled with “strong, independent fiscal oversight.” Something like that could be done through the federal law governing Puerto Rico and the other territories, sidestepping the bankruptcy code. Ryan has given lawmakers until March 31 to act.

There are some tricky constitutional issues with state bankruptcy. Juliet Moringiello, a professor at Widener University Commonwealth Law School in Pennsylvania, says it could violate the contracts clause, which prohibits states from interfering with contracts, and the 10th Amendment, which says states are sovereign. (Bankruptcy would put states under the authority of a federal judge.) Penn’s Skeel thinks these objections could be surmounted—for one thing, it would be voluntary for states. But he’s not sure how current Supreme Court justices would rule.

Legalities aside, the strongest argument for state bankruptcy is that it clearly signals to bondholders that they could lose money if a state behaves badly. Knowing that, investors will demand higher yields from states with bad budget problems, thus encouraging the states to get their financial houses in order. With the notion of state bankruptcy in the air again, “municipal investors should no longer assume that state governments themselves will never have access to protection” from creditors in bankruptcy court, Matt Fabian, a partner in the research firm Municipal Market Analytics, wrote to clients in December.

The principle that states are responsible for their own debts goes back to the 1840s, when Congress refused to assume the debts of states that had overborrowed to finance a canal- and railroad-building craze. Chastened by the episode, many states passed balanced-budget amendments and took other steps to keep their debt under strict control. It was “a pivotal moment in the history of U.S. federalism,” Jonathan Rodden, a political scientist at Stanford and the Hoover Institution, wrote in a 2012 paper.

The effects have lasted into the present. A state hasn’t defaulted since Arkansas, in the throes of the Great Depression, in 1933. When states behave badly, their borrowing costs rise. The cost of protection against default by the financially troubled state of Illinois is now three times as high as that of California.

Market discipline may be weakening, however. The federal government relies on the states to carry out some programs, such as Medicaid. Investors and state governments could start to conclude that Washington has an implicit duty to come to their rescue if they get in trouble. If so, states would be tempted to overspend and bond investors to overlend. If Washington were on the hook for the states’ problems, it would naturally want control over their finances—but under the Constitution, it can’t have that.

Making bankruptcy a last-ditch option, writes Stanford’s Rodden, would reinforce the U.S. tradition of market discipline. “It is not too late,” he wrote in a chapter for a 2014 book, The Global Debt Crisis: Haunting U.S. and European Federalism. “In fact, the timing might be quite good to clarify once and for all that states can and will default if they do not achieve fiscal sustainability.”

Bloomberg Businessweek

by Peter Coy

January 21, 2016 — 1:44 PM PST


Moody's: Adjusted Net Pension Liabilities Decline for Most U.S. States in FY 2014.

New York, January 15, 2016 — The majority of US states experienced declines in their adjusted net pension liabilities (ANPL) in fiscal 2014, Moody’s Investors Service says. Moody’s ANPL decreased for 27 states, of which, nine saw a decline for a second year in a row. However, the aggregate 50-state ANPL increased marginally to $1.3 trillion due to rising liabilities in some states.

Strong investment returns drove an average pension liability decline of 15.3%, with median returns for larger plans at 16.1%, Moody’s says in “Fiscal 2014 Pension Medians – US States: Robust 2014 Investment Returns Provide Pause in Growth of Adjusted Net Pension Liabilities.”

“Double-digit investment returns contributed to reducing pension liabilities. More timely plan disclosures under Governmental Accounting Standards Board (GASB) 67 improve comparison between states,” says John Lombardi, a Moody’s Associate Analyst.

Also in fiscal 2014, most states made budgetary contributions at or close to their actuarially determined contribution (ADC) levels. Thirty-six states contributed greater than 90% of ADC, with 12 contributing between 60% to 90% and only two funding below 60% of their pension costs.

“The two states most significantly underfunding their pension payments are New Jersey (A2 negative) and California (Aa3 stable) at 18.6% and 48.2%,respectively,” Lombardi says.

The median three-year average ANPL as a percentage of governmental revenue remained flat at 53% in fiscal 2014.

However, several states remained outliers with three-year average ANPL beyond 100% of their revenues. The five states with the largest unfunded pension liabilities by this measure were Illinois (Baa1 negative) at 278%, Connecticut (Aa3 stable) at 225%, Kentucky (Aa2 stable) at 182%, Louisiana (Aa2 negative) at 163%, and Hawaii (Aa2 stable) at 149%.

The five states with the lowest three-year average ANPL compared to revenues were Nebraska (Aa2 stable) at 11%, Wisconsin (Aa2 positive) at 14%, New York (Aa1 stable) at 23%, Tennessee (Aaa stable) at 23%, and Iowa (Aaa stable) at 26%.

Moody’s anticipates growth of pension liabilities to resume fiscal 2015, as investment performance was much weaker than the prior two years.. Additionally, several states coping with pension underfunding and outsized liabilities will continue to face significant credit challenges.

The report is available to Moody’s subscribers here.


The Detroit Bondholders Did Not Get ‘Stiffed.’

The settlement votes affirm that the bondholders in the Detroit case felt fairly treated.

In “Fixing Puerto Rico’s Debt Mess” (Jan. 6), Prof. David Skeel discusses the Detroit bankruptcy case. He states, “Holders of the city’s general-obligation bonds, which had the same priority as pensions, got stiffed, receiving roughly 41% of what they were owed. Pensioners got at least 60%.”

This is wrong. The bondholders in the Detroit case did not get “stiffed.” Prof. Skeel omits the fact that a much larger class of bondholders, the unlimited tax general-obligation bonds (UTGO) bondholders, received 74%.

Prof. Skeel also ignores that the recoveries in the Detroit case for the bondholder classes and the pensioner classes were the outcome of intense, monthslong negotiations in which all parties were well-represented by expert professionals. As a result of these successful negotiations, the UTGO class voted to accept the plan by 97% and the limited tax general obligation class (the class that did receive 41%) voted to accept the plan by 83%.

These votes affirm that the bondholders in the Detroit case felt fairly treated. After their settlements, they supported Detroit’s plan of adjustment. They did not get “stiffed.”

Detroit’s insolvency required its creditors to accept the shared sacrifice that was necessary for the city to revitalize its services and its economy, and to pay its creditors what it could. Thankfully, after negotiations, its creditors did so. As a result, Detroit is now on the road to a proud and secure future.

THE WALL STREET JOURNAL

Jan. 20, 2016 3:34 p.m. ET

by Steven Rhodes

Ann Arbor, Mich.

Mr. Rhodes, a retired U.S. bankruptcy judge, handled the Detroit bankruptcy case.


Assured, Orrick Lead the Charge In Banner Year for Bond Insurers, Counsel.

The municipal bond insurance industry took another step forward in their comeback, wrapping almost 36% more in par value in 2015 and increasing market share to the highest in five years.

Assured Guaranty led the charge again, as the par value of bonds wrapped and number of deals insured surged. Orrick Herrington & Sutcliffe maintained its position atop the bond counsel rankings.

Municipal bond insurers guaranteed $25.21 billion of bonds in 1,880 transactions, up from $18.54 billion in 1,403 transactions in 2014, according to data from Thomson Reuters.

The insurance penetration rate increased to 6.36% from 5.56% in 2014. This is the highest the rate has been since 2009 when it was 8.64%.

Assured improved on the par amount of deals wrapped, number of deals and market share, finishing the year with $15.14 billion in 1,009 transactions and 60.2% market share. In 2014, Assured has $10.74 billion, 697 transactions and 57.9%. The data includes Assured’s subsidiary Municipal Assurance Corp.

“Demand for bond insurance grew in 2015, with primary-market par insured increasing 36%, far outpacing market growth of 20%,” said Robert Tucker, managing director communications and investor relations at Assured. “We continue to see increased demand for our insurance in 2015. We led the market in terms of both par and the number of transactions insured during the year, capturing 60% of all insured new-issue par and 54% of the insured transactions. ”

Tucker said Assured increased primary market transaction by 41% over 2014 and improved liquidity in its insured paper with the average trading volume exceeding $500 million per day.

“In 2015, we were the insurer of choice for smaller bond issues, bonds in amounts of $10 million or less, leading the industry with 662 transactions totaling $3.4 billion in par insured. Counting secondary market activity, our total 2015 US public finance par insured reached $16.1 billion,” Tucker said.

Tucker also said for the fourth quarter of 2015, Assured Guaranty insured 203 new issues to produce an industry-leading par of over $3.2 billion.

“In the secondary market, we increased par insured by 16% and doubled the number of transactions we insured compared to the fourth quarter of 2014. Assured Guaranty’s total par insured across both the primary and secondary municipal markets was $3.4 billion in the fourth quarter of 2015,” Tucker said.

Build America Mutual insured $9.57 billion in 849 transactions, up from $7.47 billion in 705 transactions, though its market share dropped to 38% from 40.3% the previous year.

“We were pleased to see a strong increase in the use of insurance across the industry, and BAM’s growth played an important role in driving that,” said Bob Cochran, BAM’s chairman. “Our gross par insured reached $23.5 billion by the close of 2015, up more than 80% over the year, and the number of municipal issuer members increased to more than 1,700. Importantly, those consistent results in the market allowed BAM to increase our claims-paying resources in every quarter of 2015.”

Cochran said that BAM has now published 2,500 Obligor Disclosure Briefs on the insurer’s website, and the number of downloads more than doubled in 2015.

“These credit summaries of every bond issue insured by BAM provide an important and easily accessible source of information for investors and other market participants who want to learn more about the small- and medium-sized issuers that make up BAM’s core market,” Cochran said.

National Public Finance Guarantee, the municipal arm of MBIA Inc., wrapped $496 million over 22 deals, up from $332 million in three deals during 2014. NPFG started writing new business in the third quarter of 2014. NPFG’s market share stayed steady at 1.8% from last year.

“For our growth, we are also diversifying our base. In addition to new deals, there have also been a number of secondary market transactions that we have done,” said Tom Weyl, managing director, head of new business development at National. “We are expanding that area, as well. We also did some competitive deals recently. There have been 2 or 3 transactions that were awarded to us, that had little to no spread compared to our competitors. We are positioning ourselves for growth, we are building a base. It’s been slow-going, but we’ll be well-positioned when interest rates become more favorable.”

Weyl said National expects refunding activity to continue even as short term rates go up, as the volume of 2006 and 2007 muni debt with 10-year call dates is significant. He said the company’s new business production depends more on longer term rates, which rely on factors beyond Fed rate hikes.

“We ended 2015 with the same basic story. We are building our new business team and expanding our market knowledge. As interest rates raise and we get into a more normal interest rate environment, then bond insurance will have a better chance to compete. In the meanwhile, we have been staffing up and we are now seeing and winning more transactions,” Weyl said.

Orrick Again Tops Bond Counsel Rankings

Law firms benefited from last year’s growth in the municipal bond industry, as all top 15 firms posted improved par amounts from the prior year. The top firms posted a par amount of $374.53 billion in 12,009 transactions in 2015, compared to $314.22 billion in 10,115 transactions in 2014.

Orrick had a par amount of $37.55 billion in 391 deals, which accounts for 10% of market share. This is an improvement upon the firm’s 2014 numbers of $30.38 billion in 321 deals and 9.7% market share.

“We are, of course, pleased to be ranked number one as bond counsel and number one as disclosure counsel, as we have each year for well over a decade,” said Roger Davis, chair of Orrick’s public finance department. “We attribute our consistent standing at the top of the league tables to the quality of our bond and tax lawyers, the supportive and creative services they provide to our clients, which has led many of those clients to turn to us, repeatedly, for their public finance needs, which is more important to us than the rankings.”

Hawkins Delafield & Wood LLP remained in second place from a year ago with $23.08 billion in par amount in 396 issues and 6.2% market share, up from $16.45 billion in 321 issues and 5.2% market share.

“We once again had the most bond volume of any law firm as underwriters’ counsel,” said Howard Zucker, managing partner at Hawkins. “We are fortunate to have many very loyal clients across the nation; but by ‘fortunate’, I do not mean ‘lucky.’ We know that we cannot rest on our laurels; we understand that we have to come to work each and every day to earn and deserve the trust and confidence of our clients. ”

Hawkins was the top underwriters’ counsel with $17.37 billion in 147 deals, according to Thomson Reuters.

Zucker also mentioned that the trend for many years has been for greater specialization in the bond legal practice. This is a reflection of the increased complexity of municipal bond issues, the highly extensive regime of federal tax regulations, as well as the heightened disclosure expectations of the market and of the SEC.

“Today law firms that want to be active in this field have to be truly dedicated, and have to commit significant resources to have the depth and breadth of expertise in order to be able to advise issuers and others in the navigation of the matrix of issues across the full range of sectors of public finance,” Zucker said.

Zucker said Hawkins is now in its 162nd year and has over 135 years acting as bond counsel.

“Three months ago we opened an office in Michigan, our ninth office, and as of Jan. 1, we added three new partners to our ranks. We look forward with excitement and great expectations to 2016 and beyond,” he said.

McCall Parkhurst & Horton LLP came in third place with $14.50 billion in 436 deals or 3.9% to remain in third place.

Norton Rose Fulbright jumped to fourth place from seventh, finishing the year with $13.40 billion or 3.6% market share, improving upon 2014’s numbers of $8.14 billion and 2.6% market share.

Bob Dransfield, Norton’s U.S. head of finance said that he attributes the firms good year to its commitment to client service as well as the favorable interest rate environment that was present in 2015, which enabled Norton to assist its’ clients in achieving substantial savings through refundings and restructurings, as well as raising capital for new projects at attractive interest rates.

“We listen to the needs and goals of our clients and work collaboratively with them to help them reach those goals,” said Dransfield. “We work hard to understand the business of our clients which enables us to help them evaluate their options in light of their business goals and we work to make sure they understand the alternatives that may be available with any particular financing structure so that their business decisions are based on a complete understanding of the issues.”

Kutak Rock LLP rounds out the top five, with $13.33 billion, also a 3.6% market share.

Gilmore & Bell PC, Ballard Spahr LLP, Sidley Austin LLP, Chapman and Cutler LLP, Squire Patton Boggs, Stradling Yocca Carlson & Rauth, Greenberg Traurig LLP, Bracewell & Giuliani LLP, Mintz Levin Cohn Ferris Glovsky & Popeo PC and Chiesa Shahinian & Giantomasi PC round out the top 15.

Davis said that Orrick expects 2016 to be somewhat more challenging, as market activity has been slowing for several months, refundings are becoming fewer, rates are rising, municipal revenues are improving, but slowly and offset by rising pension and OPEB liabilities. He also said that regulation and enforcement are rapidly increasing and changing a market that until recently has been characterized by being largely unregulated and lightly enforced, and this election year, which is always distracting.

“On the other hand, we see activity increasing in specific sectors, like multifamily housing, student housing, health care, charter schools, cultural facilities, public private partnerships, PACE and other alternative energy programs,” Davis said. “We are starting 2016 busy and expect that to continue.”

THE BOND BUYER

BY AARON WEITZMAN

JAN 13, 2016 3:22pm ET


Paying for Protection: The Return of Bond Insurers.

Some municipal bond investors have had it pretty hard of late. For the holders of the debt of Puerto Rico, Detroit, Stockton, CA, Ferguson, MO, and Jefferson County, AL it’s been a parade of deteriorating financial performance, defaults and bankruptcies. In Detroit’s final bankruptcy agreement, for example, bondholders of the unlimited tax general obligation debt received a haircut down to 74% of their principal.

Yet some other Detroit bondholders got 100% of their principal, never missed an interest payment and generally saw better valuation on their bonds throughout the bankruptcy proceedings. So how did those bondholders walk away with full wallets while others lost $260 on every $1,000 invested? They had bought bonds wrapped with a bond insurance policy–a policy that unconditionally guarantees payment of principal and interest on the debt.

The days of bond insurance were assumed long gone after the collapse of nearly all of those businesses during the financial crisis of 2008. As of August 2015, there were $18.1 billion of insured bonds, up from a low of $11.4 billion in 2013, but still a far cry from the $191.3 billion of bonds insured in 2006. In fact, just two public companies survived that tumultuous period—Assured Guaranty (NR/AA) and National Public Finance (the restructured company of the insurer formerly known as MBIA) (A3/AA-).

But in a sign of renewed life, a new mutual insurance company was recently formed, Build America Mutual (NR/AA), which is owned by the municipalities it insures. Under revised rating agency guidelines, no financial guarantor can receive the formerly vaunted “AAA” rating. However, each bond insurer enjoys a “AA” level rating by Standard & Poor’s and each is focused on municipal bond insurance as a core business. In fact, Assured Guaranty established a separate insurance subsidiary, MAC, which will only insure municipal bonds.

Benefits of Insurance

Given that municipal bond defaults are still rare (less than 0.05% according to a Moody’s study of ten-year cumulative default rates), investors might reasonably ask why they should bother purchasing insured bonds. After all, like any insurance, bond insurance costs money. For investors that extra cost is in the form of lower yields for insurance bonds than for similar uninsured bonds.

It’s a fair question, but there are several reasons to consider insured bonds. First, keep in mind that the municipal bond market is extremely diverse. There are more than 50,000 borrowers across more than 15 sectors, from local governments to industrial development bonds. Even the most diligent individual investor probably doesn’t have the technical expertise to analyze the creditworthiness of a borrower and value its bonds appropriately.

Another consideration is that when municipal bonds do default—however infrequently—it’s a real mess. Not only are numerous stakeholders and creditors fighting vociferously for a very small pie, any resolution is tempered by the fact that the municipal entity must emerge from the negotiations strong enough to continue serving the public. In almost any scenario, an investor will get a haircut on principal and, as the resolution process drags on, face the added uncertainty of when you are going to get paid either principal or interest again.

Bond insurance eliminates all of this. In the event of a default, the bondholder never misses a payment of either principal or interest. But insurance is not only useful in the event of default, it also cushions against a ratings downgrade—which have become more frequent.

Consider the City of Chicago. When the general obligation debt of the city was downgraded in May 2015 to Ba1 by Moody’s (its highest junk bond rating), the value of the uninsured ten-year maturity bonds dropped nearly $80 per $1,000 bond, or 8%, by the end of the week. However, investors holding these insured Chicago bonds remained valued slightly above $1,000 during that period.

Another benefit of insurance is liquidity. Tens of millions of dollars of bonds backed by bond insurers are traded daily. Meanwhile, buyers of distressed bonds often demand substantial discounts—when they can be found.

Strength of Insurers

In light of recent history, some investors have voiced concern about whether insurers could maintain their ratings and fulfill their obligations in the event of a big municipal default. For example, both Assured Guaranty and National Public Finance insure the bonds of one or more of Puerto Rico’s troubled municipal borrowers.

But even with Puerto Rico’s default on some of its bonds, it’s critical to remember that a default on an insured bond does not mean the entire outstanding par amount of those bonds become immediately due and payable. The bond insurer simply continues to pay principal and interest on the originally mandated dates.

In the event of a default and subsequent claim, the bond insurers have strong covenants and legal provisions protecting them. These will be vigorously enforced and litigated, if history is any guide. The insurer will have to pay something, but the recovery on the bonds is often far greater than zero.

Moreover, bonds coming out of default are often restructured and refunded. This is an important consideration. As soon as any refunding occurs, the existing holders of the insured debt are made whole, the bond insurer’s commitment ceases, any reserved capital is freed up and any unearned premiums become earned immediately. There are tremendous incentives to resolve a bankruptcy expeditiously by refunding the outstanding defaulted debt.

Lastly, these companies are very well capitalized, with capital positions that are arguably better, and books of business that are certainly stronger, than prior to the credit crisis. In the event of a claim, the bond insurer continues on with business as usual. New policies are written, older policies roll off as bonds mature and the portfolio capital continues to earn money which can (and is) applied to paying on outstanding claims.

For all of that, bond insurance is not an investment panacea. It does not guarantee a risk-free investment; instead, investors take on the risk—however slight—of the bond insurer itself. In other words, bond insurance is transferred and diminished risk, not the elimination of risk. You still have to do your homework.

FORBES

BARNETT SHERMAN, CONTRIBUTOR

JAN 14, 2016 @ 04:08 PM

Barnet Sherman is a director and the portfolio manager of the TIAA-CREF Tax-Exempt Bond strategy at TIAA-CREF, a national financial services organization.


Janney Municipal Bond Market Monthly

Municipal Bond Market Monthly – Outlook 2016 and Puerto Rico Update

Janney Fixed Income Strategy


S&P Report Says 2016 Could Be New Era in Bond Refinancing in the Project Finance Sector.

OVERVIEW

LONDON (Standard & Poor’s) Dec. 22, 2015–With the end of the low interest rate cycle now clearly in sight, and the likely consequence of this on swap rates, Standard & Poor’s believes 2016 could herald a new era in project finance bond refinancings.

“Assuming that deal flow matches the high demand for infrastructure investment within the institutional investor market, we believe financing conditions for long-dated debt transactions in the capital markets can only get better,” said Standard & Poor’s credit analyst Michael Wilkins, in the report published today, “Project Finance: Rate Rise May Herald A Wave Of Refinancing In The Bond Market.”

Rising rates could actually provide a boost to refinancings of infrastructure project debt in the capital markets.

In today’s low-yield environment, insurers and asset managers are particularly eager to invest in real assets such as infrastructure. That’s because these projects provide inflation-linked, relatively attractive risk-adjusted returns, with a low correlation to the economic cycle and healthy cash flow and income yield. Also, those low interest rates have meant banks have been able to fund themselves at a historically low cost. This has led to ample liquidity in the market and has helped increase bank lending to project finance and infrastructure (see “Are Rumors For Global Project Finance Bank Lending’s Demise Greatly Exaggerated?” published Jan. 14, 2015, on RatingsDirect).

At the same time, the amount of issuance in the project bond market has ticked higher over the last couple of years, which has also been partly due to low interest rates. Low interest rates have also been a factor in the upsurge in direct lending and private placements to infrastructure projects from institutions. Yet the number of capital market refinancings of bank loans via new project bond issues hasn’t matched this trend, partly due to the disincentives of breaking the swaps associated with bank financings.

However, with the prospect of a low-rate cycle coming to an end, this picture changes. As swap rates go up, the breakage costs for swaps are reduced on a mark-to-market basis, making breakage costs less punitive. Accordingly, refinancings of infrastructure project debt in the capital markets may receive a boost as a consequence.

Standards & Poor’s Ratings Services’ research shows that institutional investor interest and refinancing conditions for loans made and priced at the height of the global financial crisis are now ripe for capital market takeouts. Our simulations show that the mark-to-market swap breakage cost saving could be as high as 40% for some project loans if swap rates rise by 100 basis points (bps) from where they are today.

We have determined, based solely on the developments described herein, that no rating actions are currently warranted. Only a rating committee may determine a rating action and, as these developments were not viewed as material to the ratings, neither they nor this report were reviewed by a rating committee.

The report is available to subscribers of RatingsDirect at www.globalcreditportal.com and at www.spcapitaliq.com. If you are not a RatingsDirect subscriber, you may purchase a copy of the report by calling (1) 212-438-7280 or sending an e-mail to [email protected]. Ratings information can also be found on Standard & Poor’s public Web site by using the Ratings search box located in the left column at www.standardandpoors.com. Alternatively, call one of the following Standard & Poor’s numbers: Client Support Europe (44) 20-7176-7176; London Press Office (44) 20-7176-3605; Paris (33) 1-4420-6708; Frankfurt (49) 69-33-999-225; Stockholm (46) 8-440-5914; or Moscow (7) 495-783-4009.

Primary Credit Analyst: Michael Wilkins, London (44) 20-7176-3528;
[email protected]

Research Contributor: Xenia Xie, London;
[email protected]


Moody's Requests Comment on Proposed Approach and Methodology for Assessing Green Bonds.

New York, January 14, 2016 — Moody’s Investors Service is requesting market participants to comment on its proposed approach and methodology for evaluating an issuer’s management, administration and reporting on environmental projects financed through green bonds.

The Green Bonds Assessment (GBA) described in Moody’s proposed approach and methodology will apply to fixed-income securities — both taxable and tax-exempt — that raise capital for use in projects or activities with specific climate or environmental sustainability purposes.

These include debt obligations with direct recourse to issuers, project finance or revenue bonds — with and without recourse to issuers — and securitizations that collateralize projects or assets whose cash flows provide the first source of repayment.

A reported $36.6 billion of green bonds were issued during 2014 and an additional estimated $42.0 billion came to market during 2015.

Moody’s proposed assessment of green bonds will focus on five primary factors: (1) organization structure and decision making, (2) use of proceeds, (3) disclosure on the use of proceeds, (4) management of proceeds, and (5) ongoing reporting and disclosure.

As part of the proposed approach and methodology, Moody’s is introducing a scorecard that will assign weights to each of the aforementioned factors, which Moody’s considers most important in assessing the framework adopted by green bond issuers.

GBAs are not credit ratings; rather, they are forward-looking opinions of the relative effectiveness of the issuer’s approach for managing, administering, allocating proceeds to and reporting on environmental projects financed by green bonds.

As such, GBAs assess the relative likelihood that bond proceeds will be invested to support environmentally beneficial projects as designated by the issuer.

Moody’s is seeking market feedback on its proposed methodology by February 12, 2016 and will adopt and publish its GBA following appropriate consideration of any comments it receives. Market participants should submit their comments on the Request for Comment page on www.moodys.com.

For more information, including the full text of the RFC, please access this link. (Subscription required.)

Recent Moody’s publications on the credit implications of these developing environmental trends are available here.

This publication does not announce a credit rating action. For any credit ratings referenced in this publication, please see the ratings tab on the issuer/entity page on www.moodys.com for the most updated credit rating action information and rating history.

Henry Shilling
Senior Vice President
Project & Infrastructure Finance
Moody’s Investors Service, Inc.
JOURNALISTS: 212-553-0376
SUBSCRIBERS: 212-553-1653

Richard Cantor
Chief Credit Officer
Credit Policy
Moody’s Investors Service, Inc.
JOURNALISTS: 212-553-0376
SUBSCRIBERS: 212-553-1653

Releasing Office:
Moody’s Investors Service, Inc.
250 Greenwich Street
New York, NY 10007
U.S.A.
JOURNALISTS: 212-553-0376
SUBSCRIBERS: 212-553-1653


Fitch: Tax-Supported Criteria Revision to be Published by End of 1Q16.

We are in the process of making modifications to address broad-based, constructive market feedback on our US state and local government rating criteria. We expect the final criteria to be published by end of 1Q16.

Overview

Unprecedented challenges in US Public Finance and a divergence of opinion between major credit rating agencies led Fitch Ratings to conduct an in-depth review of factors that drive resilience—and spur divergent recoveries—in municipal credits. Leveraging qualitative judgment, fundamental data and an experienced analytical team, we are proposing revisions to our approach to state and local government ratings to more clearly articulate our assessment of credit quality to the market.

The criteria revision designates key factors that help differentiate credits in a concentrated, municipal ratings scale and shows why some credits are more resistant to risk than others. The framework also better differentiates between credits, defines triggers that change ratings, improves consistency of rating assessments, and highlights our through-the-cycle rating approach.

The comment period for the proposed changes has closed. We will be assessing all comments provided and will be finalizing the criteria by the end of 1Q16.


Fitch Updates Criteria for Rating Public-Sector Counterparty Obligations in PPP Transactions.

Fitch Ratings-New York-15 January 2016: Fitch Ratings has published an update of its ‘Rating Public-Sector Counterparty Obligations in PPP Transactions’. The updated report replaces the existing criteria (published July 23, 2015) without modifying Fitch’s analytical approach. There will be no rating changes as a result of the updated criteria.

The criteria establish a globally consistent framework to determine if the public private partnership (PPP) framework agreement qualifies for assignment of a counterparty rating. It then defines the extent of notching from the general credit quality of the public sector counterparty applied to reflect any perceived higher risk of default under a framework agreement. It also provides guidance on how to consider the PPP obligation in the public sector counterparty’s general credit rating as well as how late payment or rejection of an obligation under the framework agreement would be reflected in the counterparty’s Issuer Default Rating (IDR).

The updated report notes that where the debt of a project company is to be rated either publicly or privately on a monitored basis, the public grantor’s IDR and counterparty obligation ratings will also be subject to monitoring, but not necessarily on the same basis (public or private). There are no other changes to the criteria.

Contact:

Thomas J. McCormick
Group Credit Officer, Global Public Finance
+1-212-908-0235
Fitch Ratings, Inc.
33 Whitehall Street
New York, NY, 10004

Laura Porter
Managing Director
+1-212-908-0575

Media Relations: Elizabeth Fogerty, New York, Tel: +1 (212) 908 0526, Email: [email protected].

Additional information is available at ‘www.fitchratings.com’.


Nossaman: Top Public Finance Attorneys Urge Regulatory Changes To Foster More P3's.

We all know how hard it is to change federal statutes these days—you need an Act of Congress and the President to sign the bill. Last week, a group of the top public finance lawyers in the US offered an approach relating to the use of tax exempt bonds that wouldn’t require a change in tax statutes but instead could be accomplished through a change in the regulations relating to the so-called “private use” test. As the group pointed out in its letter to high ranking US Treasury officials, Congress itself has made it clear that Treasury had the authority to adopt other, more flexible rules.

The US is unique in the world in its use of tax exempt financing to finance a variety of infrastructure. To benefit from this source of debt capital, a project must not have private use nor can debt service be repaid from private business revenues. The issue for P3’s arises because of the long-term operation and maintenance responsibilities that are a feature of many P3 contracts. Current IRS rules limit the length and method of compensation payable to a private party in a way that makes it almost impossible to effectively transfer long-term life cycle risk to the private sector. There are notable exceptions to these rules for specific types of infrastructure, such as qualified transportation facilities, airports and ports and water/wastewater facilities but in many cases there are so many requirements applicable to issuing these “private activity bonds” tax exempt financing is not available.

The question for P3’s is when do long-term operation and management services and payment for these services create “private use” for purposes of the tax exempt bond rules? In the past the IRS has published somewhat prescriptive revenue procedures that describe “safe harbor” provisions for management contracts relating to the term of the contract and the manner of compensation. The problem is these “safe harbor” provisions predate the development and growth of the P3 delivery model. Over the last several years, through published notices and private letter rulings, the IRS has indicated that strict adherence to the “safe harbor” provisions may not preclude the use of tax exempt financing. Furthermore, the IRS recently published regulations relating to the allocation and accounting of revenues from a bond financed facility that recognize merely sharing these revenues with a private entity will not adversely impact the tax exempt financing for the project. And recent private letter rulings for water/wastewater facilities, solid waste disposal facilities and electrical transmission and distribution systems recognize the need for flexibility in this area. The Treasury Department released a 2014 white paper on “Expanding our Nation’s Infrastructure through Innovating Financing” describing in detail the use of an availability payment contract where the public owner makes service fee payments to a private manager subject to compliance with specific performance standards and provided the facility is available for general public use.

In addition to several specific “fixes” to the “safe harbor” provisions on the term of the contract and how compensation is paid, the attorney group is proposing a general framework that focuses on the primary purpose of the project—is the arrangement designed to transfer the benefit of the lower cost of tax exempt financing to a private party or are there sufficient controls on the activities of the private party exercised by the public owner to achieve the primarily public purpose of the project.

This simple fix to the current “safe harbor” rules relating to private management contracts could go a long way to increasing the use of the P3 delivery approach for much needed public infrastructure.

Last Updated: January 12 2016

Article by Barney A. Allison

Nossaman LLP

The content of this article is intended to provide a general guide to the subject matter. Specialist advice should be sought about your specific circumstances.


U.S. Local Government: Growing Tax Bases and Good Management Underpin Stable Outlook, Despite Some Pension and OPEB Stress.

The local government sector has historically been characterized by solid credit quality and stable rating performance. Following this trend, Standard & Poor’s Rating Services expects this sector to demonstrate another year of stable credit quality in 2016. Despite a small handful of struggling issuers (including Chicago, Detroit, and Atlantic City), we believe that the overall stability and growth of local economies, generally strong-to-very strong institutional framework (IF) scores, managements’ ability to direct revenue and spending, and reliability and resilience of local revenue sources such as the property tax (even through the Great Recession) continue to support the stable credit quality outlook. This outlook is Standard & Poor’s view of possible rating performance within the sector or specific geographic region in the medium term as gauged in part by the ratio of upgrades versus downgrades, a trend of positive versus negative outlooks, and broader key trends and issuer-level credit drivers.

The macroeconomic conditions and general financing conditions in North America, as well as those risks identified by Standard & Poor’s Credit Conditions Committees, provide the foundation for our U.S. Public Finance sector outlooks (see “Volatility Risk Lingers As North America Readies Itself For Less Accommodative Credit Conditions,” published Dec. 4, 2015, on RatingsDirect). Our rating outlooks are informed by our macroeconomic forecast of the U.S. down to the regional and sector level, if applicable (see “U.S. Public Finance 2016 Credit Conditions Outlook: Expect Growth But Hold The Cheer,” published Jan. 11, 2016). Our focus in this article is on those broader industry trends that can have a large impact across our rated universe as well as developments we are seeing at the issuer-level that could drive credit quality.

Overview

13-Jan-2016


S&P: U.S. Higher Education – Amidst Continuing Pressures, the Ratings Outlook is Bifurcated.

For 2016, Standard & Poor’s Ratings Services’ outlook on the U.S. higher education sector is bifurcated. Higher education in the U.S. has always been a relatively stable sector, and we’ve generally affirmed most of our ratings in any given year. During the past few years, of the rating changes we have seen, downgrades have outnumbered upgrades by a significant and increasing ratio. Although we expect downgrades to outpace upgrades again this year, we anticipate fewer downgrades than in previous years. In addition, while the sector continues to face longer-term challenges and opportunities, we believe most institutions have adapted to the “new normal” of more competition for students and limited tuition flexibility and are taking advantage of their individual strategic positions to continue operating successfully. However, these factors are not affecting all institutions equally. Schools with national or international reputations and growing resources will likely be able to capitalize on opportunities to further strengthen their positions, while smaller, regional schools will continue to struggle to differentiate their brands, which will require additional investment and resources that could weaken their credit profiles in 2016.

This outlook is our view of possible rating performance within the sector over the intermediate term, as gauged in part by the ratio of upgrades to downgrades, the trend in positive versus negative outlooks, broader key trends, and issuer-level credit drivers. The macroeconomic conditions and general financing conditions in North America, as well as those risks Standard & Poor’s Credit Conditions Committees have identified, provide the foundation for our U.S. public finance sector outlooks. (See “Volatility Risk Lingers As North America Readies Itself For Less Accommodative Credit Conditions” dated Dec 4, 2015). Our macroeconomic forecasts for the U.S., down to the regional and sector level, if applicable, also inform our outlooks. (See “U.S. Public Finance 2016 Credit Conditions Outlook: Expect Growth But Hold The Cheer” dated Jan. 11, 2016.)

We recently published revised criteria for rating not-for-profit colleges and universities. This outlook and the following discussion of overall trends in the sector reflects our view of the possible effects such trends could have on the credit of a college of university, without regards to changes in our rating methodology. For additional information on our revised criteria, please see “Methodology: Not-For-Profit Public and Private Colleges and Universities” published Jan. 6, 2016, on RatingsDirect.

Overview

Continue reading.

14-Jan-2016


Mediation Ends Longstanding Firefighter Pension Dispute in New Orleans.

In several cities where pension reform has failed, this type of problem-solving has proved beneficial.

Earlier this month, New Orleans Mayor Mitch Landrieu stood with Nick Felton, president of the firefighters union, at a press conference calling for voters to approve a small property tax increase. The symbolism was significant. Felton and Landrieu had been on opposite sides in a bitter battle over firefighter pension funding and backpay for the past half-decade. The tax increase they’re asking for would help the city meet its part of a deal that would put an end to the longstanding dispute.

What finally got both sides to budge in a fight that predates Landrieu’s administration was going through a roughly 14-month mediation. The process involved a pension task force made up of business and community members who worked with consultants to find a unanimous plan for saving the failing pension.

New Orleans is now the third city to turn to this type of help for pension reform, and the process is so far proving successful in places where tensions are running high and strong-arming — by both sides — has failed. New Orleans has been the toughest test yet, said consultant Vijay Kapoor, who has been a mediator for pension task forces in Chattanooga, Tenn., and Lexington, Ky. “The first time we brought everyone together, it lasted 20 minutes before [each side] was shouting,” Kapoor said. “We decided to meet separately after that.”

The issues and resentments on both sides were deep. Despite several court rulings, the city still had not paid firefighters the $75 million it owed them in backpay. The dispute had been going on so long — the original lawsuit dates back to the mid-1990s — that dozens of firefighters have died without getting what they were owed. At one point in 2014, Landrieu had agreed to pay the settlement, but then balked, saying the city first had to get relief from its mounting pension bill.

That pension, which Kapoor said was in the “worst shape I’d ever seen for a public fund of its size,” was nearing insolvency and putting unprecedented pressure on the city’s budget. In 2016, the city’s actuarially required contribution was set for $60 million — more than five times its entire parks department budget. The high bill is because the pension has about one-fifth of the money it needs to meet its liabilities.

From the city’s viewpoint, the pension’s leaders were mainly to blame. In the 2000s, the pension board sucked millions out of the fund via botched investments and now-defaulted loans to the entertainment industry. When Landrieu took office in 2011, he cited the city’s fiscal crisis as his reason for continuing the previous administration’s underfunding of the pension. Still, not putting more money into the system at a time when the stock market has gained two-thirds in value only worsened the pension’s financial state.

Kapoor, who was hired in 2014 as a consultant by the New Orleans Business Council, said it took months for the two sides to even agree on the numbers — this, despite the help of an actuarial firm. Six months into negotiating a funding plan, it became clear that the firefighters union wouldn’t agree to anything until the city paid what it owed in backpay. Without a unanimous agreement, the outside task force dissolved. Still, the parties kept working at a solution.

Late last year, the long process paid off. The two sides struck a deal that puts in place a 12-year payment plan for the $75 million in backpay, including $21 million upfront; triples the city’s contribution to the pension plan to about $32 million this year and guarantees that payments will stabilize going forward; eliminates retirees’ cost-of-living increases until the pension is nearly fully funded; and gives the city oversight of the fund’s investments and governance.

Kapoor believes New Orleans’ complicated story shows how this type of problem-solving could be beneficial for other cities facing sticky pension issues, but others note that mediation should be a last resort. “If we thought we could have gotten the city council to pay out [the backpay] more quickly,” said Pension Board Treasurer Thomas Meagher III, “then we would have proposed legislation and gone that route.”

GOVERNING.COM

BY LIZ FARMER | JANUARY 14, 2016


One of the Biggest Bond Market Players Has No Employees.

One of the most prolific issuers in the $3.7 trillion municipal market is a Wisconsin agency with no employees, coveted tax-exempt bond status and a nationwide client list.

The Public Finance Authority last year issued bonds for more than 30 charter schools, senior living facilities, universities and real estate developers in 15 states. None were from Wisconsin. The University of Kansas sold $327 million of tax-exempt bonds last week through the authority for the first time so it didn’t have to wait on the legislature’s approval to raise money for a new 285,000 square-foot science building, a student union and housing.

“We’re expecting a larger class in 2017,” said Theresa Gordzica, the university’s chief business and financial planning officer. “We needed to keep the project moving so we can get the residence hall done.”

The deal highlights an obscure corner of the state and local-government debt market where pass-through agencies rent out their ability to sell tax-exempt bonds to out-of-state companies and non-profits in exchange for a fee. The practice has drawn criticism from some public officials, who say it can allow debt issuers to skirt their oversight by financing projects through authorities beyond their jurisdiction.

“The university is owned by the state, both the facilities as well as the good faith and credit,” said Representative Mark Hutton, a Wichita Republican, who called the university’s decision a “dangerous” precedent. “The reality is that they answer to the taxpayers of the state of Kansas, and we’re that voice.”

Such agencies sell securities and immediately lend the proceeds to borrowers, whose projects qualify for the tax exemption the federal government awards to debt for public works. The authorities aren’t on the hook if the money isn’t repaid. That makes the bonds among the riskiest in the municipal market: They make up as much as 30 percent of outstanding debt but account for almost 60 percent of defaults, according to Matt Fabian, a partner at Concord, Massachusetts-based Municipal Market Analytics.

State Competition

Wisconsin is one of seven states, including Florida and Arizona, that allow so-called conduit authorities to issue debt for projects beyond their borders, according to the Columbus, Ohio-based Council of Development Finance Agencies.

Wisconsin lawmakers approved legislation in early 2010 that allowed for the creation of the Madison-based PFA, which has since sold $3.4 billion of bonds. Started by the Wisconsin Counties Association, working with the National Association of Counties and the National League of Cities, its goal is to provide governments and eligible private entities with access to low-cost financing for projects that contribute to social and economic growth. Last year, the PFA was the most active conduit issuer, according to data compiled by Bloomberg.

Mike LaPierre, president of Walnut Creek, California-based GPM Municipal Advisors, which manages the day-to-day operations of the PFA, said all of its bond sales are first approved by local governing bodies such as city councils. The university’s board of regents authorized last week’s sale.

“We’re going to the elected body most impacted by the projects,” said LaPierre, whose firm was paid $1.5 million by the authority in 2014. “We’re not doing anything unless that local agency has vetted it before a public hearing.”

“As local public officials ourselves, we want to to ensure that those most impacted by the project have a chance to weigh in,” said William Kacvinsky, the former Bayfield County supervisor who chairs the PFA.

Most of the authority’s bond sales have been for out-of-state issuers. About $150 million of the money it has raised was for nine standalone Wisconsin projects and four multi-state deals for work based in the state, according to LaPierre.

Last year, 17 of its bond issues, or more than half, didn’t have credit ratings, a step frequently used by borrowers that are unlikely to receive an investment grade, according to data compiled by Bloomberg. Only qualified institutional buyers or accredited investors can buy those securities, and those rated below BBB-, LaPierre said.

No Defaults

No PFA debt has had a payment default. But one charter school in Palm Beach County, Florida, that borrowed through the agency has had to draw on its reserves to pay bondholders, a sign of distress.

“The investors are big boys, they’re doing their due diligence,” LaPierre said. “We don’t want unrated debt being held in the hands of mom and pop.”

The PFA shares a mailing address with the Wisconsin Counties Association in a building across the street from the state capitol. Its seven-member board includes four directors nominated by the counties group, and one director each from the National League of Cities, the National Association of Counties and the League of Wisconsin Municipalities. The groups receive fees for endorsing the PFA. Last year, the National Association of Counties received about $130,000, said spokesman Brian Namey.

The University of Kansas, with 25,000 students at its main campus in Lawrence, sold debt to finance projects include a $138 million science building. It was the first time the university used an out-of-state conduit, said Rebecca Floyd, the general counsel of the Kansas Development Finance Authority, which handles bond deals for local borrowers.

“I think it was one of those circumstances that the legislature didn’t foresee,” she said.

Some charter schools in North Carolina have turned to the PFA rather than issue debt through North Carolina’s Capital Facilities Finance Agency. Pamela Blizzard, the managing director of the Research Triangle High School near Durham, said the North Carolina authority’s conditions were more restrictive and would have delayed the sale by months.

Other conduits have also been competing for business. In Connecticut, a retirement community last March used the PFA to issue $34.5 million of bonds rated BB, two steps into junk. After the deal, Connecticut’s Health and Educational Facilities Authority dropped its policy of only issuing investment grade bonds. It will now allow for public offerings of bonds rated BB and BB+ and sold to qualified institutional buyers or accredited investors, said Executive Director Jeanette Weldon.

“We wanted to make sure we’re giving these borrowers the access to capital that they need,” Weldon said.

Bloomberg Business

by Martin Z Braun

January 12, 2016 — 9:01 PM PST Updated on January 13, 2016 — 6:28 AM PST


The Hidden - and Outrageously High - Fees Investors Pay for Bonds.

If you are a retail investor who purchases or sells corporate or municipal bonds, do you know the costs you are paying to transact in those securities? Chances are you don’t. Because of a regulatory loophole, broker-dealers are currently allowed to withhold essential pricing information from retail investors in fixed-income transactions.

When a retail investor purchases stocks, the broker-dealer is required to disclose the transaction costs the investor paid in the form of a commission on the customer’s confirmation statement. However, when a retail investor purchases bonds, the broker-dealer is not required to provide comparable disclosures of the transaction costs the investor paid in the form of a markup or markdown.

Because broker-dealers are not required to provide transaction cost information to retail customers in fixed-income transactions, and because retail investors don’t see any transaction costs on their confirmation statements, retail investors may mistakenly believe that they aren’t paying any trading costs at all. This opacity allows broker-dealers to charge higher transaction costs than they otherwise would if they were required to disclose.

As a result, retail investors pay substantially more to trade in corporate and municipal bonds than they pay to trade in stocks, where disclosure is required. And, they pay substantially more to trade in corporate- and municipal-bond transactions than sophisticated traders, who are better informed than retail investors and know where to access and how to interpret this information.

Research on retail investors’ trading costs for municipal bonds has found that the average cost of a $20,000 municipal-bond trade to be almost 2%. That cost arguably would be quite high even in the context of a normal interest-rate environment. However, in today’s low-interest-rate environment, that cost would be even more pronounced–equivalent to almost eight months of the total annual return for a bond with a 3% yield to maturity. Retail investors simply can’t afford to pay these sorts of high transaction costs on a low-yield investment.

Relevant cost information is available on FINRA’s Trade Reporting and Compliance Engine (TRACE) (for corporate bonds) and MSRB’s Electronic Municipal Market Access (EMMA) (for municipal bonds) websites, and some astute investors may know how to find and interpret that data. However, most retail investors likely are not in a position to use those websites with any reasonable degree of expertise. Doing so would require the investor to know not only that those websites exist, but also how to find the precise information one is looking for and, most critically, how to understand and make use of that information to determine the costs one is paying and whether those costs are fair.

The only way to ensure that retail investors receive critical cost information is to provide it directly to them. Such cost information would put them in a better position to assess whether they are paying fair prices and allow retail investors to make more informed investment decisions. That would have the added benefit of fostering increased price competition in fixed-income markets, which would ultimately lower investors’ transaction costs.

Even within the highly fractured Securities and Exchange Commission, there seems to be unanimous support among the commissioners to require broker-dealers to disclose transaction costs directly to their retail customers. Commissioner Mike Piwowar has gone so far as to characterize this issue as “low-hanging fruit.”

But while there seems to be bipartisan support for forceful action, the two self-regulatory organizations tasked with addressing the issue, FINRA and the MSRB, have offered differing proposals. In my view, FINRA’s proposal is stronger and less susceptible to evasion by broker-dealers than the MSRB’s proposal and, therefore, any final coordinated approach should follow FINRA’s proposal.

Meanwhile, as the respective regulatory agencies debate the technical details of the various proposals, which is likely to complicate and lengthen the process, retail investors remain in the dark.

THE WALL STREET JOURNAL

BY MICAH HAUPTMAN

Jan 13, 2016

Micah Hauptman (@MicahHauptman) is the financial services counsel for the Consumer Federation of America.


Kramer Levin: Sorting Through the Options as Green Bonds Gain Popularity.

Global green bond issuance approached $40 billion in November, the busiest month for the environmentally minded fixed-income products to that point in 2015. This increase in activity pushed green bonds past the total amount from 2014, when issuers produced $36.59 billion worth of green bonds – the proceeds of which are used by public and private entities alike to fund investments with environmental benefits, such as to reduce carbon emissions or the construction of renewable energy infrastructure.

Although final figures for 2015 are not yet available, global rating agency Moody’s expects the surge to continue through the end of the year, particularly following the United Nations Framework on Climate Change Conference that was held in Paris in December. Banks, companies and organizations as diverse as The World Bank, HSBC Holdings, GDF Suez and Southern Power have all completed green bond offerings, illustrating the bonds’ popularity with a diverse set of issuers.

The bonds have also proved popular with investors, who continue to search out green assets for their portfolios. The New York Common Retirement Fund and Goldman Sachs recently formed a $2 billion fund to invest in low carbon emitters, part of an overall $3.4 trillion divestment from fossil fuels. In addition, Microsoft founder Bill Gates is leading an investor group – including Soros Fund Management chairman George Soros, Facebook CEO Mark Zuckerberg and Virgin Group founder Richard Branson – forming a $2 billion fund focused on clean energy investments. The Forum for Sustainable and Responsible Investment identified $6.6 trillion worth of AUM invested in sustainable projects in the U.S. in 2014, a 76% increase from 2012.

However, as a growing number of funds and other investors seek to add these bonds to their portfolios, a key question remains largely unanswered: What specifically qualifies as a green bond? Significant ambiguity exists as the category remains vaguely defined and without a universally recognized standard. As a result, some issuances may not necessarily be as “green” as others.

One benchmark that has emerged as a recognized measure of a green bond’s level of authenticity is the International Capital Market Association’s (“ICMA”) Green Bond Principles. Created in 2014 and updated in 2015 in response to the rapidly developing market, the set of guidelines was developed in consultation with both investors and issuers. They have since gained the support of 55 of the world’s biggest investors, bond issuers and intermediaries, including Bank of America Merrill Lynch, Citibank, Credit Agricole, JPMorgan Chase, Goldman Sachs and HSBC.

The principles include four primary components:

Through these guidelines, ICMA is not attempting to act as a regulator or enforcement agent. Rather, the principles are intended to encourage transparency and disclosure and “promote integrity in the development of the green bond market” and increase environmental benefits “without any single authority or gate keeper.”

The not-for-profit Climate Bonds Initiative also manages a certification scheme that assesses, prior to a bond issuance, whether a bond meets certain standards, as determined by an appointed third-party verifier. The group’s standards board then confirms the certification once the bond has been issued and the proceeds have been allocated to recognized projects and assets.

Green bond principles align well with the increased origination of property assessed clean energy (“PACE”) assessments and PACE bonds in the U.S. All proceeds of PACE assessments are allocated to the construction of renewable energy and energy efficiency improvements to real property. According to the federal Energy Information Administration, residential and commercial buildings accounted for 41% of total U.S. energy consumption in 2014, demonstrating the tremendous potential that exists for such energy efficiency programs to reduce demand. Since 2011, Renovate America’s HERO program, in conjunction with several California municipal entities, has financed more than $1 billion worth of environmentally friendly home improvements, resulting in five PACE bond securitizations. The most recent HERO Funding Trust PACE bond securitization indicated that it satisfied the ICMA Green Bond Principles, establishing a significant precedent for energy efficiency projects.

Gaining designation as a green bond is highly valuable for the issuer, as it opens the door for funds and others with assets to invest in environmentally friendly products. It also benefits green-specific fund managers, as it demonstrates to investors that they’re fulfilling their objective of investing in sustainable projects. With an estimated gap of $650 billion to $860 billion of investment required to combat climate change every single year between now and 2030, the prominence of green bonds – and the importance of properly identifying them – is likely to continue.

Article by Laurence Pettit

Last Updated: January 5 2016

Kramer Levin Naftalis & Frankel LLP


The content of this article is intended to provide a general guide to the subject matter. Specialist advice should be sought about your specific circumstances.


CDFI Fund Opens Application Period for FY 2016 CDFI Bond Guarantee Program.

Up to $750 Million in Bond Guarantee Authority Available

The U.S. Department of the Treasury’s Community Development Financial Institutions Fund (CDFI Fund) today opened the fiscal year (FY) 2016 application period for the CDFI Bond Guarantee Program. Application materials are available on the CDFI Fund’s website in anticipation of the publication of the Notice of Guarantee Authority (NOGA) in the Federal Register later this week. The NOGA makes up to $750 million in bond guarantee authority available to eligible Community Development Financial Institutions (CDFIs) in FY 2016.

Through the CDFI Bond Guarantee Program, selected certified CDFIs or their designees will issue bonds that are guaranteed by the Federal government and use the bond proceeds to extend capital for community development financing and for long-term community investments. Authorized uses of the loans financed through bond proceeds may include a variety of financial activities, such as supporting commercial facilities that promote revitalization, community stability, and job creation/retention; housing that is principally affordable to low-income people; businesses that provide jobs for low-income people or are owned by low-income people; and community or economic development in low-income and underserved rural areas.

In FY 2016, the Secretary of the Treasury may guarantee bond issues having a minimum size of $100 million each, up to an aggregate total of $750 million. Multiple CDFIs may pool together in a single $100 million bond issuance provided that each eligible CDFI participates at a minimum of $10 million.

Deadlines

Please reference the NOGA and application instructions for detailed information regarding the following application deadlines for consideration for FY 2016 bond guarantee authority.

CDFI Certification Applications must be submitted through AMIS by 11:59 p.m. EDT on February 12, 2016.

Qualified Issuer Applications must be submitted through AMIS by 11:59 p.m. EDT on March 4, 2016.

Guarantee Applications must be submitted through AMIS by 11:59 p.m. EDT on March 18, 2016.

The last day the CDFI Fund will accept questions regarding the FY 2016 application period for the CDFI Bond Guarantee Program is March 9, 2016 at 11:59 p.m. EDT. All questions must be submitted electronically to the program office: [email protected].

Qualified Issuer Applications and Guarantee Applications received in FY 2015 that were neither withdrawn nor declined in FY 2015 will be considered under the FY 2016 round.

Application Materials

In addition to being available through AMIS, the FY 2016 NOGA and application materials are available via the CDFI Fund’s website, www.cdfifund.gov/bond.

Application Workshop

The CDFI Fund will conduct a two-day application workshop for potential applicants regarding the FY 2016 Qualified Issuer and Guarantee Application requirements. Specifically, the workshop will include an in-depth discussion of the financial structure of the program, including:

Attendees will have the opportunity to ask CDFI Fund staff questions and receive clarification about the topics discussed during each module.

The two-day application workshop will be held in February 2016 in Washington, DC, at the CDFI Fund’s office at 1801 L Street NW.

As the workshop is held in a secure federal building, registration is required. There is no registration fee; however, due to limited space, registration will be honored on a first come, first served basis. Up to 100 potential applicants may attend. The CDFI Fund will release information on how to register for the workshop soon.

For interested parties unable to attend the in-person application workshop, the presentation materials will be posted to the CDFI Fund’s website, www.cdfifund.gov/bond.

Questions

Inquiries regarding legal documents related to the CDFI Bond Guarantee Program should be directed to the CDFI Fund’s Office of Legal Counsel via email at [email protected].

For more information about the CDFI Bond Guarantee Program, please visit www.cdfifund.gov/bond, or email the CDFI Fund’s Help Desk at [email protected].

Tuesday, January 5, 2016


Beware Of Pension Obligation Bonds.

These three little letters—POB—can be a pox on your portfolio if you own them or were pressured into buying them. Pension Obligation Bonds do not belong in your portfolio. The reasons are simple. These taxable municipal bonds are issued by state or local governments for payment of obligation to their employee pension fund. Issuing such bonds allow the state or local government that cannot make its payments to the pension fund to borrow the money, then invest it in the stock, bond, private equity or real estate markets. A gamble if there ever was one.

What happens when, like in 2015, stocks and U.S. Treasurys have flat returns? Or, also as happened last year, when investment grade and high yield corporate bonds returned little or (gasp) suffered losses? It’s a disaster. Sometimes returns from the POB issuance are below the interest rate the issuer paid to borrow the money. Then, the pension shortfall is actually increased. POBs are a gambler’s substitute for not making the required pension contribution with current tax revenues. Sure, the returns can be smoothed out over time. But the biggest offenders have the largest unfunded liabilities.

Some of the most chronically underfunded state pensions are: Illinois, Connecticut, Kentucky, Kansas, Alaska, New Hampshire, Mississippi, Louisiana, Hawaii and Massachusetts.

Then there are city offenders like Chicago, whose pension liabilities are stacking up rapidly causing the city’s tax-free municipal bond rating to fall into the junk pile. Any way you look at unfunded pensions and their Pension Obligation Bonds, it’s a toxic situation.

If you are seeking taxable income and want to stay away from corporate bonds, here are two taxable munis with good credit metrics, no unfunded pension problems and decent liquidity.

Dignity Health is a health care provider in California. Its services include urgent care, surgery, home health, lab and wound healing care. Dignity Health is a well run not-for-profit corporation whose revenues have exceeded expenses in this most challenging ObamaCare environment. The 3.125% coupon bonds maturing November 1, 2022 at par yield 3.125% to maturity. Bonds are non-callable and rated A3 by Moody’s. Its CUSIP is 254010AA9 and bonds should be carefully shopped for.

Another taxable municipal that won’t cause pension angst is Virginia Housing Development Authority Rental Housing Bonds. The title is a mouthful but in short: The VHDA’s mission is to finance affordable housing for Virginia residents. Rated AA+ by Standard & Poor’s, this experienced management team has overseen $8 billion in assets, increased net income in 2014 by 48% from 2013 according to S&P, increased their return on assets and continues to be profitable.

As with all taxable municipal bonds, investors are not exposed to dollar gyrations, China’s on again, off again economy, or geopolitical events.

Buy Virginia State Housing Development Authority Taxable Rental Housing Series C, 3% coupon maturing August 1, 2024 at roughly 99.75 for 3.03% yield to worst call and maturity. The CUSIP is 92812Q229. Do not pay much of a premium due to prepayments and the Authority’s special redemption rights.

With corporate downgrades and defaults expected to increase in 2016, taxable municipal bonds are a good substitute as long as they are not Pension Obligation bonds.

Forbes

Marilyn Cohen, Contributor

Jan 5, 2016

Marilyn Cohen is president of Envision Capital Management, Inc., a Los Angeles fixed-income money manager.


S&P’s Public Finance Podcast (Our Updated Criteria For Rating Not-For-Profit Public And Private Colleges And Universities).

This week’s segment of Extra Credit features Director Carolyn McLean, who explains the key revisions to our methodology for rating not-for-profit public and private colleges and universities. In addition, we highlight last week’s rating actions and discuss the key factors behind our rating on Illinois.

Listen to the podcast.

Jan. 8, 2016


S&P Methodology Update: Not-for-Profit Public and Private Colleges and Universities.

1. Standard & Poor’s Ratings Services is updating its methodology for assigning stand-alone credit profiles (SACPs), issuer credit ratings (ICRs), and issue credit ratings to not-for-profit public and private colleges and universities globally.

2. The update provides additional transparency to help market participants better understand our approach in assigning ratings to not-for-profit public and private colleges and universities globally, to enhance the forward-looking nature of these ratings, and to enable better comparison between these ratings and ratings in other sectors and asset classes.

3. These criteria supersede “Approaches To Rating U.K. Universities Amid Growing Credit Diversity”, published March 28, 2003. These criteria also partially supersede the “Higher Education” criteria, published June 19, 2007. Specifically, the sections “Private College and University Credit Ratings”, “Management and Governance”, “Debt”, and “Rating Public Colleges and Universities” are superseded by these criteria. This methodology is related to our criteria article: “Principles Of Credit Ratings”, published on Feb. 16, 2011.

4. All terms followed by an asterisk (*) are defined in the glossary in Appendix.

Continue reading.


Moody’s Launches New Issuer Comment Report For Local Government Issuers.

Moody’s has launched a new research publication, the Issuer Comment Report. The Issuer Comment Report provides an assessment of the most recent credit information for most US local government issuers with outstanding Moody’s general obligation and related ratings. The reports present a summary of key economic, demographic, financial and operating information within the context of Moody’s ratings methodology and do not announce rating actions.

The Issuer Comment Reports will provide the bond market with updated credit information for US cities (including other municipalities such as towns and villages), counties and school districts, including for many issuers with no current or recently-published Moody’s research. Many of these are small and infrequent debt issuers, but have ratings that Moody’s reviews annually.

The new reports will also benefit issuers because they provide them with a single reference source for their Moody’s general obligation (and related) ratings, annually updated research on their credit, and updated economic and demographic data used in Moody’s local government general obligation methodology.

If you have any questions regarding this new research report, please contact either Chandra Ghosal at 212.553.1095 and [email protected] or Brien Wigand at 212.553.0299 and [email protected].


All But Two States and Puerto Rico Can Issue More PABs in 2016.

WASHINGTON – All but two U.S. states and the Commonwealth of Puerto Rico will be able to issue more private-activity bonds in 2016, based on government data.

The states — Illinois and Connecticut — and Puerto Rico had population losses and lower PAB volume caps for this year, based on recent data published by the U.S. Census Bureau the Internal Revenue Service’s formula for PABs. California is, by far, the state with the largest PAB volume cap for 2016, followed by Texas and Florida.

But Colorado had the highest percentage increase in its cap for the year. The Rocky Mountain State, Texas and Florida were among nine states with PAB caps that rose more than 1%.

Private-activity bonds generally are issued by state and local governments or authorities to provide low-cost financing for the projects of nonprofit organizations or companies that serve a public purpose.

Most PABs must be issued under state volume caps, which are based on a formula established annually by the IRS. These include exempt facility qualified PABs bonds such as those issued to finance mass commuting facilities, water and sewer projects, and single-family and multifamily housing projects. They also include qualified small issue industrial development, student loan, and redevelopment bonds. States can carry over any unused cap for up to three years.

Some PABs are not subject to volume caps. These include qualified PABs for docks and wharves, environmental enhancements of hydro-electric generating facilities, and governmentally-owned solid waste facilities. Also included in this category are qualified 501(c)(3) bonds and veterans’ mortgage revenue bonds.

The formula for the PAB cap for 2016, published by the IRS in October, is $100 per capita or $302.88 million, whichever is higher. While the per capita amount did not change this year from last, the minimum increased to $302.88 million from $301.52 million for states with lower population figures.

The total PAB volume cap for the 50 states, the District of Columbia and Puerto Rico this year is nearly $32.49 billion, $245.07 million or 0.76% higher than the cap for last year.

The increase is due to population gains, as well as a higher minimum amount of cap allowed by the Internal Revenue Service.

But Illinois, Connecticut and Puerto Rico lost population in 2015, according to the latest figures published by the Census Bureau late last month. The population estimates have a reference date of July 1.

Puerto Rico had the biggest population and PAB cap drop. Its population fell by 60,706 to 3.47 million in 2015 from 3.53 million the year before. Its PAB cap fell 1.72% to $347.42 million for 2016 from $353.49 million for last year. Illinois’ population slipped 22,194 to 12.86 million in 2015 from 12.88 million the previous year. As a result, its cap fell 0.17% to $1.286 billion this year from $1.288 billion in 2015.

Connecticut’s population edged down by 3,876 to 3.591 million from 3.595 million. Its PAB cap fell 0.11% to $359.09 million this year from $359.48 million.

California has the largest PAB volume cap, at $3.91 billion, after a 0.91% increase in its $3.88 billion cap for 2015.

Colorado had the highest gain in its cap — a 1.89% increase to $545.66 million for this year from $535.56 for 2015. The increase was due to a population gain of 100,986 to 5.46 million.

The eight other states with increases in PAB volume caps above 1% are: Florida, up 1.84% to $2.03 billion; Texas, up 1.82% to $2.75 billion; Washington State, up 1.52% to $717.04 million; Arizona, up 1.48% to $682.81 million; Oregon, up 1.45% to $402.90 million; South Carolina, up 1.39% to $489.61 million; Georgia, up 1.17% to $1.02 billion; and North Carolina, up 1.03% to $1.00 billion.

Twenty-one states have the minimum cap of $302.88 million for 2016.

The PAB volume cap figures do not include American Samoa, Guam, the Northern Mariana Islands and the U.S. Virgin Islands because they were not included in the recently released population estimates from the Census Bureau.

THE BOND BUYER

by Lynn Hume

JAN 5, 2016 10:22am ET

© 2016 SourceMedia. All rights reserved.


Fitch Webcast Replay: Request for Comment - U.S. Public Finance Waterworks, Sanitary Sewer, and Drainage Utility Systems.

Standard & Poor’s Ratings Services held a live Webcast and Q&A on Thursday, January 8, 2015, at 11:00 a.m. Eastern Time on the recently issued Request for Comment regarding proposed criteria for waterworks, sanitary sewer, and drainage utility revenue pledges of local and regional governments (LRG) issue credit ratings, issuer credit ratings (ICR) and stand-alone credit profiles (SACPs) in the U.S.

Listen to the replay.

Jan. 8, 2015


Fitch 2016 US Public Finance Outlooks.

Read the report.

Fitch Ratings | Jan. 8


Where to Find the $64 Billion of Distress in Muni-Market's Calm.

General-obligation bonds, long seen as one of the safest niches of the U.S. municipal market, are starting to look like one of the riskiest and it’s all because of Puerto Rico.

There was $64.2 billion of distressed state and local debt outstanding as of Jan. 4, or about 1.7 percent of the total, according to data compiled by Bloomberg. General-obligations, which are backed by a promise to repay instead of earmarked revenue or taxes, accounted for $12.9 billion, or 20 percent, the second-largest category after securities backed by legal-settlement money from tobacco companies. The financially drowning island was almost exclusively to blame: All but $400 million of it was issued by Puerto Rico.

The U.S. territory of 3.5 million hasn’t skipped any payments on its general-obligation bonds, which have the highest priority under its constitution. It opted to default on other debt this month instead. The securities are classified as distressed because in August the government decided to stop putting money into the account that’s used make interest and principal payments, a step it took to conserve cash.

Bloomberg’s tally is a broader category than outright defaults because it includes cases where borrowers draw down reserves below specified levels or violate other terms of the loan agreements.

The figures mask an otherwise positive turn in the municipal market, where borrowers’ finances have been given a lift by rising real estate prices and the economy’s more than six-year expansion. Last year, just 55 issuers missed bond payments for the first time, the fewest since at least 2010 and down from 62 in 2014, according to Municipal Market Analytics Inc. The amount of debt involved totaled $3.85 billion, down from $9.4 billion a year earlier.

A cumulative picture emerges from the the Bloomberg data, which include bonds that have been distressed for years. Among them are $200 million of still outstanding debt from Detroit and $100 million from Jefferson County, Alabama, both of which filed for bankruptcy after the recession. While such filings remain a rarity, the decisions rattled some investors’ confidence in struggling municipalities general-obligation bonds, which have traditionally been seen as secure because governments can raise taxes to pay them.

“Some of the actions taken in the high profile bankruptcy cases, to hit bonds hard and challenge all legal structures, are evidence of increased risk for GO bonds and all bonds when distress hits,” said Peter Bianchini, managing director with Mesirow Financial Inc. in San Francisco.

Smoking’s Risk

The single most-distressed category, accounting for $17.6 billion of the debt, is tobacco bonds, which state and local governments sold to get an advance on the money they’re due to receive from the 1998 legal settlement with cigarette companies. Those payments are tied to cigarette shipments, which have declined more than anticipated since the securities were first sold. As a result, many may not be repaid on schedule.

Ohio’s Buckeye Tobacco Settlement Financing Authority disclosed last month, for example, that it had to draw in $35.85 million of reserves to pay part of the interest due Dec. 15.

Further down the distressed list are public power systems ($8.1 billion), economic and industrial development projects ($3.9 billion) and securities backed by specific taxes ($2.8 billion), according to data compiled by Bloomberg.

The scale of the figures in some cases represent the length of time it takes to resolve a default.

“The numbers have been creeping up,” said Matt Fabian, an analyst with Municipal Market Analytics.  “Situations are lingering and lingering. Builds up to a large pile of problems after a few years.”

Bloomberg Business

by Darrell Preston

January 6, 2016 — 9:01 PM PST Updated on January 7, 2016 — 4:55 AM PST


Muni Market Still ‘Constructive’ Despite A More Hawkish Fed: MMA

Short-term Treasuries hit a new five-year high earlier today, but Municipal Market Analytics’ Matt Fabian and Lisa Washburn turn their attention to municipal bonds Monday, writing that despite the Federal Reserve’s rate hike, the muni market still looks constructive.

They write that it’s “hard to expect much dynamism in the next few days” in this short holiday trading week. Aside from lower volumes they write that bond levels and valuations are “rich across the curve” with tight spreads that are not likely to entice buyers to jump in at the moment, nor is the steady influx of fresh capital to municipal mutual funds helping.

In this environment, Fabian and Washburn write that it’s no surprise that both fixed and floating tax‐exempt yields have outperformed their peers, a situation they expect to continue near-term, especially as the U.S. Treasury curve flattening may be losing steam. “This is more a signal for unchanged taxable term spreads than a shift to bear steepening.

However, they note that at some point in the future, this outperformance for munis will being to limit additional relative value gains, as well as tie their prices even more directly to Treasuries.

Their advice:

Municipal bond valuations are indicating that bonds are somewhat to largely over‐ bought at the 5yr mark and longer. Buyers who need to spend cash before year end should strongly consider the front of the curve where ambivalence over future rate hikes should work to their advantage. Sellers can be less choosy as current spreads reward taking gains.

Barron’s

By Teresa Rivas

December 28, 2015, 2:58 P.M. ET


Where Have All the Muni-Bond Dealers Gone?

The number of municipal-bond dealers declined in 2015 as shrinking underwriting fees, record-low trading and growing regulatory costs led firms to abandon the $3.7 trillion market or merge with larger competitors.
Guggenheim Securities closed its local-government bond business last month after profits shrank. In October, Bank of Montreal sold its division to Piper Jaffray Cos. And in June, Birmingham, Alabama-based Sterne Agee Group Inc. was purchased by Stifel Financial Corp., which acquired local rival Merchant Capital about five months earlier.

“All businesses are becoming more scaled because of regulatory and compliance” costs, Ronald Kruszewski, the chief executive officer of St. Louis-based Stifel, said in a telephone interview. “It’s difficult to be a niche player in any business in financial services today.”

The pressures have steadily thinned the ranks of firms that sell municipal bonds, with more than one out of every five merging or closing over the last five years. Underwriting fees slipped in 2015 to the lowest level in seven years, spurred by competition that’s likely to keep driving the industry’s consolidation.


The contraction mirrors the cost-cutting that’s happening more broadly in the financial industry, where banks including Barclays Plc, Nomura Holdings Inc. and Bank of America Corp. have been cutting jobs as trading become less profitable. Morgan Stanley is eliminating about 25 percent of its fixed-income staff.

About 1,520 state and local bond dealers were registered with the Municipal Securities Rulemaking Board last month, down 6 percent from October 2014. Regional firms are buying competitors to expand their reach and snatch more business away from Wall Street’s biggest banks.

“It’s harder and harder for smaller and middle-market firms to be profitable,” said Mike Nicholas, CEO of the Bond Dealers of America, a Washington-based trade group. “You’re going to continue to see mainly small regional firms looking for partners either in a merger or pure acquisition.”

While sales of municipal debt rose 16 percent to $420 billion this year, the fees banks earned for underwriting declined. Fees on negotiated deals, which comprise three-quarters of the market, fell to $4.80 per $1,000 of bonds, the lowest since 2008. In a negotiated sale, a municipality selects a bank in advance rather than offering bonds to the lowest bidder in an auction.


Low interest rates are one reason for the heightened competition. With yields holding near a five-decade low, trading has dried up because the buy-and-hold investors who dominate the tax-exempt market have been unwilling to part with securities that provide higher income. Trading volume fell during the third quarter to the lowest level since records began in 2005, according to the MSRB, the market’s self-regulator.

As a result, firms that want to offer the bonds to customers have been competing for underwriting business to get them, said Matt Fabian, a managing director at Concord, Massachusetts-based Municipal Market Analytics.

“With so little trading, in order to be able to deliver bonds to your investors you need to underwrite them,” Fabian said. “That only has increased competition.”

Crisis Legacy

The legacy of the 2008 credit crisis is also having an impact. Since then, states and cities have eschewed the once-lucrative financings that paired floating-rate bonds and interest-rate swaps, which hit governments with unexpected costs after markets seized up. In part because of that crisis, firms have been dealing with new regulations that have increased expenses or threaten to make the businesses less profitable.

Rules placed on financial advisers have limited the ability of underwriters to pitch transactions to state and local governments. The U.S. Securities and Exchange Commission has been cracking down on banks that fail to police whether their government clients are making adequate financial disclosures after bonds are sold. And pending or newly adopted rules will require dealers to disclose trading markups and take steps to ensure that clients receive the most favorable available prices for their securities.

“There’s something new being pumped out every week by the SEC or the MSRB,” said Nicholas. He said one of his member firms reported that its legal and accounting costs have more than doubled since 2008.

Bigger Seen Better

That’s given an advantage to larger dealers that have more ability to bear the expense, helping to hasten consolidation by companies such as Stifel. In addition to buying Sterne Agee and Merchant, Stifel expanded in California last year by acquiring De La Rosa & Co., the biggest independent California-based investment bank that focused on municipal debt. In 2011, it purchased the San Francisco-based underwriter Stone & Youngberg.

The acquisitions vaulted Stifel to eighth-biggest municipal underwriter in 2015, according to data compiled by Bloomberg. Five years ago, it ranked 14th.

Minneapolis-based Piper bought Bank of Montreal’s municipal division to boost its sales, trading and Illinois business. That follows its purchase two years ago of Seattle-Northwest Securities Corp. Piper ranked 10th in U.S. municipal bond underwriting this year, up from 11th in 2014, according to data compiled by Bloomberg.

“We’re in a strong position because our public-finance business is so well diversified, by geography, industry sector and client type,” said Piper CEO Andrew Duff in a telephone interview.

Bloomberg Business

by Martin Z Braun

December 29, 2015 — 9:01 PM PST Updated on December 30, 2015 — 4:39 AM PST


States’ Pension Woes Split Democrats and Union Allies.

A $1 trillion U.S. pension gap is dividing two longtime allies: Democrats and unions.

Left-leaning politicians from Rhode Island to California are increasingly supporting more aggressive overhauls of government pension benefits despite opposition from labor officials, traditionally one of the Democratic Party’s biggest policy and electoral supporters.

The erosion of Democratic backing for conventional retirement benefits prized by teachers, firefighters and police officers is a sign of how strained government budgets are as obligations for 24 million public workers and retirees continue to mount.

The latest clash is unfolding in Pennsylvania, where Democratic Gov. Tom Wolf has been seeking to end a six-month budget impasse with a Republican-controlled Legislature by agreeing to approve retirement cuts for new state hires and current workers. The Keystone State has $50 billion in unfunded pension obligations, one of the deepest retirement holes in the country.

“I know you’re not going to be happy,” Mr. Wolf told union leaders in private phone calls during recent weeks, those labor officials said. Union officials said the cuts aimed at current workers violate state laws.

A spokesman for Mr. Wolf said the governor understands that some people would be upset with the pension cuts, but his priority has been boosting education spending. “The governor absolutely wants to make sure state workers have a secure retirement, but this was a compromise budget and he’s dealing with an overwhelmingly Republican-led Legislature,” the spokesman said.

Since 2009, 25 out of 34 states that had Democratic governors in office have rolled back retirement benefits for public workers, a result that is proportionally in line with states run by Republicans, according to a Wall Street Journal analysis of National Association of State Retirement Administrators data. Most of those governors also have survived attempts by union interests to remove them from office. At present, 17 states have Democratic governors.

Pension-cutting Democrats can come off as the lesser of two evils for union officials, because they have curtailed some benefits in an effort to make retirement plans more sustainable. Republicans often pursue more drastic steps such as ditching traditional pensions altogether in favor of the 401(k)-like plans common in the private sector.

The amount states and local governments are paying each year to fund retirement systems has risen to 4% of annual spending, up from 2.3% in 2002, according to U.S. Census data. Meanwhile, large retirement systems now have just three-quarters of the assets they need to fund future obligations, according to consultant Milliman Inc., leaving a gap of $1 trillion.

Democrats rarely tried to roll back pensions before 2008, according to politicians and pension officials. But as deficits surged because of deep investment losses in the wake of the financial crisis and chronic underfunding of retirement plans, Democrats said they had little choice but to revamp benefits, leading to conflicts with what has usually been a large and loyal bloc of voters.

In West Virginia, Democratic Gov. Earl Ray Tomblin this year backed pension cuts that raise mandatory worker contributions for new hires and block those workers from retiring as young as 55.

In California, Democratic Gov. Jerry Brown traded jabs with the state’s largest retirement system when he said a proposal to lower investment targets was irresponsible because it didn’t go far enough and would likely reduce the expected rate of return over a longer period, in effect papering over looming deficits. The California Public Employees’ Retirement System said its approach was measured and balanced.

Public-sector unions have countered by filing lawsuits to block cuts, saying the pension plans have legal protections, and spending big to support alternate political candidates. Unions have prevailed in reversing pension cuts in several states, including Illinois, Oregon and Arizona.

“If it’s a Democrat undermining our members, they’ll feel the heat as much as if they were a Republican,” said Steven Kreisberg, the national director of research and collective bargaining at the American Federation of State, County and Municipal Employees, or Afscme.

Pension overhauls are one of several issues straining relations between Democrats and unions. Some unions have battled Democrats who opposed the Keystone XL oil-pipeline project and others who back charter school expansion.

Mr. Wolf opposed cutting benefits earlier this year before breaking with his party and agreeing to numerous changes in a swap for more spending on education. Those changes include higher contributions for new hires and putting some of those workers’ retirement savings into 401(k)-style accounts. Current workers would also have more limits imposed on how much their pensions can increase in their final years of service, according to the proposed law.

“Do I have members that say Gov. Wolf sold us down the road?” said David Fillman, executive director of Afscme Council 13, the Pennsylvania union representing state and municipal workers. “Sure, there are some.”

Pennsylvania’s pension problems date at least to the early part of the last decade, when unions won a boost in benefits that was followed by stretches of economic weakness and poor investment returns. The plans also suffered from chronic underfunding. State lawmakers increased retirement ages and changed funding formulas in 2010, but the gap widened.

The state is projected to spend $2.4 billion out of its general fund on pensions this year, up 43% from $1.7 billion last year, according to a December report by the state’s independent fiscal office. The cost is forecast to hit $3.5 billion, or more than 10% of the state’s roughly $31 billion budget, by 2020. The state systems cover more than 730,000 public school and state employees and retirees.

The Pennsylvania AFL-CIO and other labor groups who backed the governor’s campaign have lobbied hard against Mr. Wolf’s changes, arguing that workers’ retirement security will be compromised. In recent weeks, union members have sent more than 100,000 emails to state legislators opposing the pension cuts.

“It’s a false choice,” said Rick Bloomingdale, president of the Pennsylvania AFL-CIO. “You don’t have to cut pensions in order to get school funding.”

The Republican-controlled Senate passed a pension bill that includes cuts to current workers’ benefits, and Mr. Wolf said he would sign the legislation. But the Republican-controlled House has failed to pass it. Every Democrat in the chamber voted against the bill, and some Republicans blocked it because it was linked to a full budget that increased taxes.

On Tuesday, with public schools threatening to close, Mr. Wolf said he would approve a stopgap budget that didn’t include pension overhauls or increased education spending. The governor’s spokesman said Mr. Wolf still wants a full-year budget that includes both items.

There are already signs that some Democrats who take a harder line on pensions can survive politically. Pension-cutting Democrats can still come off as more friend than foe to union officials, because Republicans often target deeper benefit cuts.

Former Rhode Island Treasurer Gina Raimondo won election as governor in 2014 after battling with unions on a pension overhaul.

Ms. Raimondo ultimately reached a settlement with workers this year that locked in $4 billion in savings. The cuts included shifting some current workers and new hires onto plans that include a 401(k)-style account, plus reducing the cost-of-living adjustments for retirees.

“There’s still a core group that’s angry, and in many ways I understand why they’re angry,” Ms. Raimondo said. “I tell them, ‘Don’t be mad at me. Be mad at people who made promises that were unaffordable.’ ”

THE WALL STREET JOURNAL

By TIMOTHY W. MARTIN and KRIS MAHER

Dec. 29, 2015 7:12 p.m. ET

Write to Timothy W. Martin at [email protected] and Kris Maher at [email protected]


Municipal Market Contracts at Record Pace as Refunding Dominates.

For an unprecedented fifth-straight year, investors saw more bonds leaving the municipal market than being sold by states and localities.

Net issuance is ending the year at about negative $15 billion, according to data compiled by Bloomberg. The figure is calculated monthly by subtracting amounts being redeemed early or maturing from what was issued, based on the date at which interest begins to accrue. Though some analysts predicted a pickup in bond sales for infrastructure projects, nearly two-thirds of the almost $400 billion in debt offered in 2015 refinanced higher-cost debt, suppressing market growth, Bank of America Merrill Lynch data show.

More than six years after the recession ended, state and local governments remain in an age of austerity as they grapple with pension obligations and other expenses. Bond sales fell off the record pace to start the year during the final months of 2015 as the Federal Reserve prepared to increase borrowing costs for the first time in almost a decade. That flipped net issuance into negative territory.

The scarcity of new debt has kept benchmark muni yields near the lowest relative to U.S. Treasuries in more than a year as demand for tax-exempt bonds outstripped the supply. That’s been a boon to investors: After flat returns through the first six months of the year, munis ended 2015 up 3.5 percent, compared with 0.6 percent for Treasuries. Investment-grade corporate debt lost 0.8 percent and high-yield company securities plunged 4.7 percent.

“The net negative supply in 2015 has really come to roost as we close out the year,” said Peter DeGroot, a strategist at JPMorgan Chase & Co. Next year is “still a highly supportive environment for municipal securities in terms of relative performance to taxable fixed-income counterparts.”

Individuals own the majority of the $3.7 trillion municipal market either through specific bonds or mutual funds. They usually invest in the bonds as part of a strategy to cut their tax burden, meaning they’re likely to reinvest their debt payments back into the asset class. The negative issuance figure is even larger when assuming individuals put all that cash back into munis, DeGroot said.

As investors flocked to munis in 2015, the debt became expensive to Treasuries on a relative basis. The ratio of 10-year AAA rated muni yields to those on federal debt is about87 percent, compared with an average of 101 percent over the past five years, Bloomberg data show.

Even with relatively low yields, investors are likely to continue putting their money into munis, particularly the tax-free interest payments they get from their current holdings, said Chris Mier at Loop Capital Markets.

“There’s a core, base demand for municipal bonds,” said Mier, chief strategist at Loop in Chicago. “For higher tax-bracket individuals, they’re a core element of any portfolio and that isn’t expected to change much in 2016.”

Long-term muni sales are poised to decline by about 1 percent in 2016 from this year’s level, according to a survey of 10 underwriters released last week by the Securities Industry and Financial Markets Association. Yet refunding will fall to 55 percent of issuance from 62 percent in 2015, according to the report.

With fewer refinancing deals, the market may grow in 2016. Without accounting for coupon reinvestment, net supply will be $50 billion in 2016, according to DeGroot at JPMorgan. That’s in line with the $45 billion estimate of Vikram Rai, head of muni strategy at Citigroup Inc. Michael Zezas at Morgan Stanley says net issuance could swell to $99 billion.

Even with the potential market growth, munis should still post positive returns in 2016, according to the trio of strategists.

“It’s a number that sounds large compared to what we just experienced, but in the entire history of the muni market, it’s not a number that is indigestible,” Zezas said. “There’s a substantial amount of deferred capital needs throughout the municipal infrastructure system.”

Bloomberg Business

by Brian Chappatta

December 30, 2015 — 9:00 PM PST Updated on December 31, 2015 — 4:48 AM PST


Fitch Replay: 2016 US Public Power, Water & Sewer Outlook.

Teleconference discussing the 2016 outlook for the US Public Power and Water and Sewer sectors.

Key insights include:

– Effect of environmental regulation
– Improving cost of renewable energy
– Supply and infrastructure challenges

Listen to the Teleconference.


Fitch Replay: US Transportation Outlook 2016.

Listen to teleconference discussing the 2016 Outlook for US Transportation Infrastructure.

Key insights include clarity on federal transportation plans and US macroeconomic improvements driving growth across transportation sectors.


Fitch Replay: USPF Nonprofit Healthcare 2016 Outlook.

Listen to analysts discuss the 2016 outlooks for the US Healthcare sector.

Key insights include operating variability, reimbursement, and need for size and scale.


Fitch Replay: US States & Locals 2016 Outlook.

Listen to analysts discuss their 2016 outlook for US states and local governments.

Insights include manageable budget challenges and new criteria.


The Rieger Report: Bonds In 2016?

2015 had been a year of low or no returns for major asset classes. Income asset classes such as preferred stock and municipal bonds did outpace the S&P 500 Index and did so without the volatility but others did not bode as well. What about 2016? Let’s look at the leaders for 2015 first:

From a total return perspective the S&P U.S. Preferred Stock Index returned over 5.4% in 2015 with investment grade municipal bonds tracked in the S&P National AMT-Free Municipal Bond Index returning just over 3.25%. Investment grade corporate bonds issued by ‘blue chip’ companies tracked in the S&P 500 Investment Grade Corporate Bond Index barely held even and corporate junk bonds ended in the red. The traits of each market may give us a hint as to what 2016 may look like.

What might impact the 2016 investment grade bond market?

Table 1: Select indices and their 2015 total returns

2015 Yr End

What might impact the 2016 ‘junk’ bond markets?

Table 2: Select high yield indices and 2015 total returns

2015 HY Big Picture Yr End

Table 3: Select U.S. high yield corporate indices and their total returns

2015 HY Yr End

Seeking Alpha

By J.R. Rieger

Jan. 2, 2016 4:49 PM ET

Disclosure: © S&P Dow Jones Indices LLC 2015. Indexology® is a trademark of S&P Dow Jones Indices LLC (SPDJI). S&P® is a trademark of Standard & Poor’s Financial Services LLC and Dow Jones® is a trademark of Dow Jones Trademark Holdings LLC, and those marks have been licensed to S&P DJI. This material is reproduced with the prior written consent of S&P DJI. For more information on S&P DJI and to see our full disclaimer, visit www.spdji.com/terms-of-use.


Fitch Replay: 2016 US Education & Nonprofit Outlook.

Listen to teleconference discussing our 2016 Outlook for US Education & Nonprofit.

Key insights include demographic challenges, state support for universities, and affordability challenges.


S&P General Obligation Medians for Counties: Update as of Oct. 9, 2015.

Standard & Poor’s Ratings Services derives the general obligation (GO) county medians from rating reviews completed under our GO criteria (USPF Criteria: Local Governments General Obligation Ratings: Methodology And Assumptions, Sept. 12, 2013, on RatingsDirect). The county medians are derived from the 947 counties Standard & Poor’s rated as of Oct. 9, 2015.

We present the medians by rating category. These medians exclude municipalities and special districts such as school districts. We are publishing a separate GO municipality median report concurrently with this article.

We calculate the metrics, for which we provide the medians, based on raw data, or in some cases, data that we have adjusted (for more information, see the related research article below), and they are only one component of the rating analysis. The metrics play a part in the quantitative analysis in five factors: economy, budgetary flexibility, budgetary performance, liquidity, and debt and contingent liabilities. Qualitative adjustments within each factor (which the medians do not reflect) also play an important part in the analysis.

Standard & Poor’s plans to update the medians for both municipalities and counties semi-annually.

Continue reading.

03-Dec-2015


S&P General Obligation Medians for Municipalities: Update as of Oct. 9, 2015.

Standard & Poor’s Ratings Services derives the general obligation (GO) municipal medians from rating reviews completed under our GO criteria (USPF Criteria: Local Governments General Obligation Ratings: Methodology And Assumptions, Sept. 12, 2013, on RatingsDirect). The municipal medians are derived from the 3,287 municipalities Standard & Poor’ rated as of Oct. 9, 2015.

We present the medians by rating category. These medians do not pertain to counties and special districts such as school districts. We are publishing a separate GO county median report concurrently with this article.

We calculate the metrics, for which we provide the medians, based on raw data, or in some cases, data that we have adjusted (for more information, see the related research article below), and they are only one component of the rating analysis. The metrics play a part in the quantitative analysis in five factors: economy, budgetary flexibility, budgetary performance, liquidity, and debt and contingent liabilities. Qualitative adjustments within each factor (which the medians do not reflect) also play an important part in the analysis.

Standard & Poor’s plans to update the medians for both municipalities and counties semi-annually.

Continue reading.

03-Dec-2015


Why Florida May Be the Next Big Source of PACE Bonds.

Property Assessed Clean Energy (PACE) loans have been available in Florida since 2010, but lending as well as securitization of these loans has lagged far behind California, largely due to a series of lawsuits challenging the program’s validity.

A ruling by the Florida Supreme Court in October could change that, allowing the Sunshine State to live up to its potential for green energy projects. Under the Florida PACE law, local governments can issue revenue bonds to provide financing for residents and businesses that agree to make energy conservation, renewable energy, and wind resistance improvements, and have non-ad valorem assessments placed on their property tax bills to repay the debt.

The lawsuits argued that the financing agreements for the PACE programs included the unlawful use of judicial foreclosure if the assessments would wrongfully allow PACE administrators to use the courts to foreclose on delinquent borrowers.

Florida is no California. It is neither as populous nor as wealthy, nor does it have the same laws promoting energy efficiency. And while it gets plenty of sunshine, solar panels are far less popular than they are in the Golden State. The biggest use of PACE financing in Florida, by far, is to make houses and other buildings hurricane-proof.

Ygrene Energy Fund has closed about $55 million in projects in Florida to date which represents $110 million in energy savings, according to Stacey Lawson, the company’s president and CEO. The company administers programs for Clean Energy Green Corridor District, which includes Miami, South Miami, Pinecrest, Palmetto Bay, and Miami Shores, communities that total about 650,000 people.

Ygrene partners with municipalities and helps them set up PACE programs and they provide financing and administration for the program. It has $150 million warehouse facility which allows it to provide capital to fund the upgrade for the property owner. The tax lien is placed on the property tax bill and the homeowner pays that back over 20 years. Ygrene gets the 20-year cash streams from the property taxes. Once it collects a large enough warehouse of projects it securitizes them.

The company completed its first securitization of Florida PACE bonds in July 2015. The transaction privately placed $150 million of bonds backed by both California and Florida PACE assessments; as well a mixture of residential and commercial PACE (though a significant majority of the assessments were residential). Kroll Bond Rating Agency assigned ‘AA’ ratings to the class A notes, which were privately placed with an unnamed insurance company. It was the first rated securitization to include multi-state PACE.

Lawson expects the program to take off in 2016. “The districts that we have opened are still relatively contained to Miami-Dade and Broward counties, but now that we have the court ruling in favor of PACE we are seeing fast expansion of municipal and county interest,” she said. “Going into 2016 we will see the trend of expansion in terms of service territory really take off”.

The Florida ruling cleared up a clause in documents that allowed for judicial foreclosure, which is a mortgage remedy, as a recovery remedy for PACE administrators. According to Jonathan Schaefer, Program Manager Florida PACE Funding Agency, “the insertion of judicial foreclosure was never in the spirit of the PACE legislation law.”

The ruling essentially declares that judicial foreclosure should not be part of PACE and concluded that the only remedy for the investor is the uniform method of collection, which is standard way that all property taxes are repaid via.

The ruling also dismisses the Florida Banker’s Association claim that argued that the PACE law is unconstitutional because it gives the special assessment on a tax bill a lien that supersedes the payment of a mortgage on the property. “The court basically decided that the challenge was not valid – the Florida Bankers did not have standing, nor evidence that that they had been injured by PACE,” said Lawson. “That was a big win for PACE in Florida and PACE in general because it indicated that there was court support for PACE.”

The Supreme Court ruling probably means the matter is resolved for now, said Schaefer. “At this point in time legislation is clear and cities and counties that were sidelined because of the lawsuits are certainly going to be looking to do PACE,” he said.

Florida’s PACE legislation allows for PACE financing on renewable energy improvements, which is the installation of any system in which the electrical, mechanical, or thermal energy is produced from a method that uses one or more of the following fuels or energy sources: hydrogen, solar energy, geothermal energy, bioenergy, and wind energy.

Unlike California’s PACE law, Florida’s PACE statute also permits improvements to buildings that make them more resistant to damage from wind and severe weather events.

The state has seen a rise in sea level (sea levels in South Florida have risen nine inches over the past century and by the end of the century, scientists predict sea levels could rise another 6 feet from climate change, according to clearpath.org) and severe storms have contributed to increasing floods in Florida counties.

It is therefore not surprising that public programs, like PACE, that help drive better protection and resiliency to homes from these risks is a very central topic of public policy now, according to Lawson.

PACE in Florida can fund projects like water barriers to prevent water intrusion or lifting the foundation of homes to protect homes against sea level rise. PACE can also finance a whole range of projects related to hurricane resiliency – such as storm windows, foundation strengthening and roof strengthening. “In terms of other measures on energy side, Florida homeowners are very consistent with what we see in CA – popular measures are heating & air conditioning, rooftop solar and energy efficient roofing,” said Lawson. “But I would estimate that hurricane resiliency is about 40% the project volume in Florida.”

California on the other hand is largely driven by renewables mostly because of the state’s mandate for clean energy.

Cisco DeVries, president of Renew Financial, the financing company behind CaliforniaFirst, a PACE financing program for residential and commercial properties, says that the potential for Florida is big, though maybe not California big. He is currently in the state setting up shop. On Sept. 29, Renew announced that it acquired ECOCity partners, a leading PACE program administrator based in St. Petersburg in Florida that serves local governments from South Florida to the Panhandle.

CaliforniaFirst provides financing for the purpose of renewable energy, efficiency upgrades, water management or seismic retrofit. Loans are secured by bonds, and the reimbursement is billed through the annual property tax bill. So the loan has the same seniority as the government’s property taxes. The loan can have a term to up to 25 years. DeVries said it’s a similar set up in Florida.

In the past year, Renew has completed financing for over $68 million in energy efficiency projects, expanded market coverage from 30% of California to 70%.

DeVries said that the Florida model is based on CaliforniaFIRST. “We expect the integration to be smooth and to greatly enhance the PACE experience in Florida very shortly, ” he said. He sees potential for varied PACE lenders to fund energy upgrades on roughly 50,000 to 75,000 Florida homes per year for about $1 billion in loans annually. Projects would include some solar-panel installations but also lots of replacements for air conditioning, windows, roofs and other basics in more efficient formats.

PACE lenders could fund another $1 billion per year in energy upgrades on businesses in the Sunshine Statin Florida, especially for small- and mid-sized companies, said DeVries.

This low-risk lending structure has opened up a sizable pool of third party capital providers. The bonds benefit from their senior lien position and its treatment as a property tax that is collected through standard tax mechanism. That means that the bonds are exceptionally secure and of very high credit quality. Repayment rates are near 100% and though there is a delay in cash flows the recovery is near perfect. “The great competitive proposition of PACE is that the loan is not tied to property owner, but to the property,” said Devries. “So credit score issues and property transfer issues are almost eradicated.”

Renew issued its first securitization of PACE bonds on September 3. The company issued $50 million of privately placed notes backed by California PACE bonds.

Ygrene’s first transaction to include Florida PACE, included loans that financed energy efficiency, renewable energy, and water conservation upgrades to both commercial and residential buildings. The loans are repaid via annual property assessments with terms of five to 30 years that are based on the property’s value, not the borrower’s credit score.

“The market will continue to see deals that incorporate geographic diversity as well as asset diversity, said Lawson. Ygrene is currently working on a second securitization of multistate PACE bonds.

A third player, Florida PACE Agency, is administering a program to several counties in Florida’s through its statewide PACE program called E-VEST.

Like, Ygrene and Renew, the Agency secured private capital to fund financing for projects. In 2013 it inked a deal for $500 million in funding through Irvine, Calif.-based Samas Capital LLC.

However, unlike other PACE administrators in the states, Schaefer said that the Florida Finding Agency doesn’t need to tap the securitization market. That is because Samas’ capitalization is equity so there isn’t a real need to takeout the lending via a securitization.

“Other PACE administrators in the state have secured financing through a line of credit so they are in a bigger hurry to free up that capital and need to tap the securitization market as a result,” said Schaefer.

THE BOND BUYER

NORA COLOMER

DEC 22, 2015 2:10pm ET


The Latest Weapon Against Climate Change: Property Tax Bills.

Private finance is pumping millions of dollars into green retrofits in some of the U.S.’s most vulnerable areas.

Miami, if you haven’t heard, is in trouble. Like, fish swimming in the streets kind of trouble. Like, sinking into the ocean kind of trouble.

And while Florida’s leaders are having their own kind of trouble processing the reality of bigger hurricanes and badder floods, businesses and property owners are taking action. In October, for instance, big-box retailer BrandsMart USA completed a $3.1 million upgrade to their Miami Gardens store, toughening it up for future hurricanes and making it more energy efficient.

But the most innovative part of the project may be how it was paid for—through the Property Assessed Clean Energy, or PACE, program. PACE is a framework that provides low-risk financing for efficiency and resiliency upgrades to buildings by putting payments on property tax bills, stretched out over up to 20 years. According to a tally by the nonprofit PACENation, 31 states and the District of Columbia currently have PACE-enabling legislation, most implemented since California pioneered the program in 2008. PACENation has tracked just under $1.4 billion in completed PACE projects during that time.

BrandsMart’s project was financed by Ygrene, one of the larger PACE servicers. Ygrene (pronounced “why green”—and the name is energy spelled backwards) sets up and administers PACE programs for municipalities, with revenue coming from borrower fees. The company has funded or approved more than $750 million in projects since its founding in 2010, making it among the largest players in a growing ecosystem that also includes California’s CleanFund and Connecticut’s Greenworks Lending.

According to Ygrene CEO Stacey Lawson, PACE is part of a broader trend of climate and infrastructure programs teaming public and private efforts. As Ygrene’s numbers make clear, energy efficiency projects are long-term financial winners (to say nothing of the benefits of surviving a hurricane or saving the planet), but paying for them up front is a high bar for property owners.

Now, because of the repayment certainty of having the debt attached to property taxation, PACE loans can be bundled into in-demand securities. Lawson says “they’re triple A assets,” attributing past AA ratings to the newness of the market. In fact, there’s been concern that PACE assets are a little too good, since they get tax-like priority over mortgage repayments. That has in some cases thrown a wrench into home sales and refinancing.

“Governments are thinking about what kind of change to [they] want to effect?” says Lawson. “But business is all about, how do we have that happen, and have that happen sustainably and profitably?” She thinks aggressive marketing of PACE to building owners, in particular, is more a private-sector strength.

Lawson knows quite a bit about getting government and business to work together. In addition to her a tech career, the Californian made a run for Congress in 2012. “You’re getting Wall Street to move green—you couldn’t do that without the government component,” she says. “But also, government couldn’t effect that without private industry players.”

Of course, there are limits to what even the largest building-level projects can do to fight the effects of climate change. It’s widely believed that saving Miami is going to take massive intervention—think Dutch-style seawalls and massive pumps. Projects on that scale will go far beyond the private improvements property owners are making, and mean the government will have to get its hands dirty, too.

Fortune

by David Z. Morris

December 16, 2015, 4:41 PM EST


SIFMA Survey Forecasts Issuance, Interest Rates, Trends for 2016.

Municipal participants who responded to a recent survey conducted by the Securities Industry & Financial Markets Association predict a total of $431.5 billion of new issuance arriving in the market in 2016.

The survey was conducted from Nov. 11 to Dec. 18. The forecasts represent the median values of all submissions of individual member firms that participated, including Citigroup, First Southwest Company, FTN Financial, JPMorgan, Loop Capital Markets LLC, Piper Jaffrey, Raymond James & Associates Inc., RBC Capital Markets, Wells Fargo Advisors, William Blair & Co.

The prediction on volume includes both short and long-term issuance — and is up slightly from the $428.8 billion of issuance that was estimated in 2015, according to the New York and Washington, D.C.-based U.S. securities industries group. Actual issuance for the year to date has totaled $377.29 billion of long term bonds and $32.30 billion of short term notes.

According to the survey, respondents predict $388.5 billion of long term issuance and $43 billion of short term next year.

Long-term tax-exempt issuance will reach $347.5 billion in 2016, according to respondents’ predictions, while issuance of alternative minimum tax securities is forecasted at $10.5 billion in 2016.

Participants expect to see issuance of $30.5 billion of taxable municipal debt.

Refundings are predicted to comprise less of the total issuance, falling to 55%, according to the participants, from the 62.2% they had predicted for 2015.

Variable-rate demand obligation issuance will trend away from the record lows predicted for this year as $8.0 billion of VRDO paper is forecasted to come to market in 2016.

Floating rate note issuance debt to the tune of $12.5 billion is expected to surface in the coming year – after the 2015 volume of about $5.3 billion missed respondents’ expectations on last year’s survey for $12.5 billion in FRN debt in 2015.

In terms of use of proceeds, 62.5% of respondents believe that the largest issuing sector will be general purpose, followed by transportation, education and housing. The general purpose sector has been the largest issuing sector by gross amount in prior years, according to SIFMA.

Meanwhile, the curtailment of the tax-exemption on municipal bond interest once again ranked as a top concern among respondents going into the New Year. Participants said its elimination would have the greatest impact on the municipal market, while fiscal pressures resulting from underfunded pensions and the possibility of a default by one single, large and prominent issuer are also among their chief concerns.

For the purpose of the survey, a default was defined as the occurrence of a missed interest or principal payment or a bankruptcy filing, according to SIFMA.

Overall, respondents said they expect 30 issuers to default on a total par value of $69 billion in 2016 – with a bulk of the par amount in defaults consisting of defaults in Puerto Rico-related debt.

At least one respondent named Basel III capital and liquidity requirements among the factors with the highest importance in 2016, while two others cited “oil bust” and “authority to access Chapter 9” as their primary concerns in the New Year.

Interest rates were another hot topic for the participants, who predicted that the federal funds rate will rise to 0.50% by the end of March 2016, up from 0.38% at the end of December.

They expect it to gradually increase to 1% by the end of 2016, according to the survey.

The ratio of municipals to Treasuries, participants said, is expected to decline before again rising at the end the coming year.

Predictions call for the ratio of the yield on 10-year triple-A general obligation municipal securities to the 10-year Treasury benchmark to fall to 88.5% by the end of December 2015, after peaking to 103.21% at the end of September. However, respondents said that ratio will rise to 90.5% by December 2016.

Respondents expect the two-year Treasury note to increase to 1.65% by the end of 2016 from 1% at the end of December 2015. Additionally, they predict that the 10-year Treasury note yield will increase to 2.75% from 2.33% at the end of December 2015.

THE BOND BUYER

BY CHRISTINE ALBANO

DEC 23, 2015 1:50pm ET


Report Says 2016 Could Be New Era In Bond Refinancing In The Project Finance Sector.

OVERVIEW

LONDON (Standard & Poor’s) Dec. 22, 2015–With the end of the low interest rate cycle now clearly in sight, and the likely consequence of this on swap rates, Standard & Poor’s believes 2016 could herald a new era in project finance bond refinancings.

“Assuming that deal flow matches the high demand for infrastructure investment within the institutional investor market, we believe financing conditions for long-dated debt transactions in the capital markets can only get better,” said Standard & Poor’s credit analyst Michael Wilkins, in the report published today, “Project Finance: Rate Rise May Herald A Wave Of Refinancing In The Bond Market.”

Rising rates could actually provide a boost to refinancings of infrastructure project debt in the capital markets.

In today’s low-yield environment, insurers and asset managers are particularly eager to invest in real assets such as infrastructure. That’s because these projects provide inflation-linked, relatively attractive risk-adjusted returns, with a low correlation to the economic cycle and healthy cash flow and income yield. Also, those low interest rates have meant banks have been able to fund themselves at a historically low cost. This has led to ample liquidity in the market and has helped increase bank lending to project finance and infrastructure (see “Are Rumors For Global Project Finance Bank Lending’s Demise Greatly Exaggerated?” published Jan. 14, 2015, on RatingsDirect).

At the same time, the amount of issuance in the project bond market has ticked higher over the last couple of years, which has also been partly due to low interest rates. Low interest rates have also been a factor in the upsurge in direct lending and private placements to infrastructure projects from institutions. Yet the number of capital market refinancings of bank loans via new project bond issues hasn’t matched this trend, partly due to the disincentives of breaking the swaps associated with bank financings.

However, with the prospect of a low-rate cycle coming to an end, this picture changes. As swap rates go up, the breakage costs for swaps are reduced on a mark-to-market basis, making breakage costs less punitive. Accordingly, refinancings of infrastructure project debt in the capital markets may receive a boost as a consequence.

Standards & Poor’s Ratings Services’ research shows that institutional investor interest and refinancing conditions for loans made and priced at the height of the global financial crisis are now ripe for capital market takeouts. Our simulations show that the mark-to-market swap breakage cost saving could be as high as 40% for some project loans if swap rates rise by 100 basis points (bps) from where they are today.

We have determined, based solely on the developments described herein, that no rating actions are currently warranted. Only a rating committee may determine a rating action and, as these developments were not viewed as material to the ratings, neither they nor this report were reviewed by a rating committee.

The report is available to subscribers of RatingsDirect at www.globalcreditportal.com and at www.spcapitaliq.com. If you are not a RatingsDirect subscriber, you may purchase a copy of the report by calling (1) 212-438-7280 or sending an e-mail to [email protected].

Ratings information can also be found on Standard & Poor’s public Web site by using the Ratings search box located in the left column at www.standardandpoors.com. Alternatively, call one of the following Standard &
Poor’s numbers: Client Support Europe (44) 20-7176-7176; London Press Office (44) 20-7176-3605; Paris (33) 1-4420-6708; Frankfurt (49) 69-33-999-225; Stockholm (46) 8-440-5914; or Moscow (7) 495-783-4009.

Primary Credit Analyst: Michael Wilkins, London (44) 20-7176-3528;
[email protected]

Research Contributor: Xenia Xie, London;
[email protected]


Muni Experts Lament Rates, Credit Concerns, Volume as Year Ends.

Municipal experts awaiting this week’s Federal Reserve’s decision on interest rates said a host of other stressors — from a lack of supply and credit concerns to unfunded pension liabilities and yield-curve positioning — were high on their list of concerns.

It’s been a year of headline-making news for troubled municipalities, political and government leaders, municipal legislation, market trends and federal regulation, but municipals took it in stride, according to analysts.

“Municipal investors have undergone a nerve-wracking couple of years, having to contend with the irrational threat of rising rates, the downgrade of very high-profile credits, the potential for market dislocating defaults, a shrinking high-yield sector and sporadic liquidity flare-ups — just to name a few,” Vikram Rai, head of Citi’s municipal strategy group wrote in a Dec. 3 municipal outlook called “A Year on the Edge.”

And 2015 was no different. It had its share of everything from general market and seasonal volatility, to credit distress and fiscal debacles, and high-profile bankruptcies and defaults. Municipal analysts, strategists, portfolio managers, and experts reflecting on 2015 said, at times, there were more downs than ups.

Dan Heckman, senior fixed-income strategist at U.S. Bank Wealth Management, said a lack of net new supply was most problematic for him this year.

He said he was challenged to find municipal bonds that fit into his investment-grade quality bias and longer-term investment parameters. U.S. Bank Wealth Management manages $130 billion of total assets, but declined to disclose the amount of municipal assets under management.

Initially, heavy refunding activity in the first half of 2015 gave Heckman hope for more robust volume throughout the second half of the year.

“That really gave us a firm confidence that the market would do very well this year in the face of rising rates,” he said on Dec. 1. But his thesis “took a hit” mid-year, and “the decline in new issuance is actually getting worse, not better as we finish this year,” Heckman said.

LACK OF SECONDARY TRADING

“We have tried to overcome a lack of supply in investment-grade bonds,” he said. “We have tried very aggressively buying everything we see, but it’s very hard when there is not a lot of secondary trading.” He said recent layoffs in fixed-income trading operations contributed to the lack of trade flow and availability of bonds this year.

In a market and economic report released a day after his interview with The Bond Buyer, Heckman held out hope for a late-year supply burst.

“We expect issuance to surge in the month of December due to an above-average maturity schedule,” he wrote in a report for the week of Nov. 30. “In addition, this may be the last chance for issuers to refinance their debt prior to the Fed beginning to normalize the policy rate. The recent flattening of the yield curve could also add to the issuer incentive to refund in December,” he said in the report.

Heckman said the prospect of rising rates could have a swifter impact on the short end of the yield curve, and that he continues to be pressed to find long-term paper to fit his needs at year end.

“We believe bond portfolios should focus on an average maturity of five to seven years, and should include normal allocations to longer-term bonds, rather than focusing on short-term bonds,” he wrote in his Dec. 2 report.

“We would emphasize credit exposures since spreads are fair relative to high-quality securities, and the premium offered for lower-quality credits tends to compress in rising interest rate regimes,” he said. Heckman said buyers can find some benefits from the relatively steep muni yield curve since it mirrors the Treasury curve.

“This offers investors some ‘extra’ yield to compensate for the risk of longer maturities in a rising rate environment,” Heckman added. He is, however, avoiding certain credits, particularly those struggling with pension liabilities.

Anthony Valeri, senior vice president and investment strategist at LPL Financial, said the potential Fed rate hikes will be a headwind for municipals going into 2016.

“While they have historically held their value slightly better than comparable Treasuries during periods of rising rates, [municipal bonds] cannot completely disconnect from rate hikes,” he wrote in a Dec. 8 fixed-income outlook.

Valeri believes a significant increase in overall municipal debt growth is unlikely in the remainder of 2015. “States and municipalities battle with still-tight budgets that will likely keep bond issuance for new infrastructure projects limited,” he wrote in his report.

Valeri also believes net supply is likely to be limited in 2016, which should provide support to prices. “Like taxable bonds, municipal bonds are likely to witness a low-return environment as well and not escape the challenges facing all bond investors in 2016,” he wrote.

John Mousseau, director of municipal investments at Cumberland Advisors, said the relative attractiveness of municipal bonds was one thing that remained consistent through the year, amid volatility in credit, liquidity and issuance. He said there may be some added opportunities to pick up attractive municipals if a late December supply burst surfaces as issuers attempt to current-refund bonds with 2016 call dates.

“This will be large, but not like the bulge we saw last year,” he said in a recent interview. “In any case, munis of higher- grade variety at 4% are still a giveaway, in our opinion.”

But the opportunity could be short-lived depending on when the Fed decides to act, Mousseau said. He said once the Fed hikes begin, muni-Treasury yield ratios could decline, partly due to higher Treasury yields and declining municipal yields as the municipal supply subsides.

AVOIDING NEGATIVE ARBITRAGE

“If you go to decently lower ratios, that will prompt a flood of advanced refundings with calls out in the 2021 range,” he said. He said many issuers have largely focused solely on advance-refunding bonds out to 2018 and 2019 to avoid the negative arbitrage beyond those years eating into the cost savings.

That behavior could change, however, based on potentially declining ratios.

“With a roll-down the yield curve and lower ratios, refundable bonds with calls from 2021 to 2023 come into play,” Mousseau said. The municipal-to-Treasury ratios will most likely end 2015 near their five-year average, according to Valeri of LPL.

As of Dec. 1, the 30-year ratio was at 104% and the 10-year at 95% — just slightly lower than the start of November, when there was intermediate- and long-term bond outperformance, he said. “We think that the recent strength signals near-term caution, but believe that municipal bonds have attractive long-term valuations,” Valeri noted.

Peter DeGroot, managing director at JPMorgan Securities predicts municipals will outperform Treasuries on a relatively modest lift in long-dated yields. By mid-year 2016, “we believe that the Federal Reserve will have established a gradual approach to normalizing interest rates,” DeGroot wrote in a Nov. 25 municipal market outlook.

He estimates that the two, five, 10-year and 30-year U.S. Treasury yields will be at 1.35%, 2.10%, 2.50% and 3.15%, respectively, about halfway through 2016, and further rising to 1.75%, 2.50%, 2.75% and 3.25%, respectively, by year end.

“Below expected economic growth would serve to limit the Fed tightening cycle and keep the curve closer to its current shape and absolute levels than we have forecast,” DeGroot added.

POLICIES DIVERGE

Dawn Mangerson and Jim Grabovac, co-portfolio managers at McDonnell Investment Management in Oakbrook, Ill., said economic and monetary policy divergence was the key driver of capital market returns and valuations across global markets in 2015.

The consequence was a further strengthening of the dollar that added downward pressure on commodity prices broadly.

“This guided our expectations toward a benign outlook for inflation and limited upside potential for longer-term interest rates in the U.S.,” the managers wrote in a Nov. 30 email.

Going forward, they expect economic and monetary policy to play an “outsized” role in 2016. Economic recovery entering its seventh year and additional labor market gains could afford the Federal Reserve “the opportunity to boost short-term rates off the zero-lower bound for the first time since 2008,” they wrote.

“With global growth moderating, however, and relatively large interest rate differentials in favor of the U.S., we expect a stronger dollar will continue to dampen inflation and U.S. growth at the margin, thereby limiting both the scope and the alacrity with which the Fed pursues its attempt at policy normalization.

Analysts said 2016 should offer a fresh start and new value opportunities for municipal investors, even if volume is down.

JPMorgan forecasts net supply of negative $58 billion in 2016, and approximately negative $58 billion in issuance over 2016 — a 20% decrease from the negative $73 billion expected for full year 2015.

The seasonal factors approaching 2016 appear to be displaying a typical pattern with heavy mid- and end-of-year coupon and redemption periods showing low net supply, according to DeGroot of JPMorgan.

In addition, net supply is expected to support prices during January and February, with net negative $16 billion in supply over the two month period, he said.

“In 2015, expected richening of ratios in the January-February period failed to materialize as 10-year U.S. Treasury yields fell to two-year lows of 1.67%, and supply for the two months was a near record $62.5 billion,” DeGroot wrote.

July and August saw net negative supply of $34 billion, or 24% above forecasted net supply for these months, he added. DeGroot called the relative performance in 2015’s June to August period “solid,” with average 10-year muni-Treasury ratios of 99% versus an average of 102% for the March to May period.

The firm anticipated positive October and November net supply of $4.7 billion, but recently reported that net supply is trending to about negative $6 billion after leaner-than-expected issuance over the two months.

DeGroot is among those keeping an eye on potential defaults in Puerto Rico-based issuers. The commonwealth had a tumultuous year that brought intense fiscal and economic strain and included several credit downgrades, an admission by Gov. Alejandro Garcia-Padilla that the island’s debtors couldn’t meet their responsibilities in the current economy, and a call for federal government assistance and pleas for special legislation allowing Chapter 9 bankruptcy.

“Fortunately, the impact to the broader fund community is far less dramatic given relative concentrated representation of Puerto Rico bonds across mutual funds and that Puerto Rico bond prices have been marked down considerably,” DeGroot said in his report.

“Moreover, credit and cash flow difficulties in Puerto Rico are not systemic across the asset class and are highly idiosyncratic in nature,” DeGrooted added.

Heckman said he will remain bullish through the first quarter of 2016 as he monitors two key market factors — the possibility of continuing interest rate increases and municipalities that have “severely underfunded pension liabilities.” He believes the Fed will be “slow” and “methodical” when it comes to rate hikes in the New Year.

“Once they get into a rising interest-rate environment it’s very difficult to see where they may stop, and that might have some dynamic impact on the yield curve,” he said. “We have seen it flatten to a degree already.”

He said a rising rate environment could benefit the long end of the curve and trigger some changes to his municipal portfolio strategy. “We could see an environment where we go from a longer-dated portfolio to a barbell strategy,” he said.

STAYING CAUTIOUS

He, too, will be cautious about some sectors, including higher education, which faces changes to demographics and declining student population. And he’ll keep an eye on Puerto Rico as it continues its fiscal and economic “saga,” focusing on how Puerto Rico handles a $1 billion coupon payment due Jan. 1. He currently doesn’t own any Puerto Rico paper.

DeGroot said there are risks ahead and investors should be prepared for the unexpected, as was the case this year.

“The forecast for the shape and magnitude of yield changes in 2016 is remarkably similar to our forecast heading into this year,” DeGroot said in his report. However, the expected yield changes in 2015 did not materialize as gross domestic product growth of 2.1% underperformed an estimate of 2.7% and “the Fed chose to be more deliberate than we had anticipated,” he said.

“Not surprisingly, we view lower growth and inflation as the primary risks to our 2016 forecast as well,” DeGroot said. “Our interest rate forecast does not portend a repeat of this year’s spike in advance refunding volume and steep drop in longer dated yields, but a recurrence is clearly a risk to performance as we progress through 2016.”

THE BOND BUYER

BY CHRISTINE ALBANO

DEC 15, 2015 10:18am ET


GASB Statement 68: What's the Impact on Higher Education?

In this CreditMatters TV segment, Standard & Poor’s Director Jessica Wood describes the effect of GASB 68–a reporting requirement related to pension reporting–on higher education entities and certain charter schools.

Watch the video.

Dec. 21, 2015


Reed Smith: Green Bonds – How to Unlock Its Full Potential?

The green bond market is currently one of the fastest-growing fixed-income segments, with issuances tripling between 2013 and 2014. There is a sense of excitement and optimism surrounding the market – initially led and developed by the multilateral development banks (MDBs) and international financial institutions (IFIs), but now actively promoted, sponsored and supported by the private sector.

However, an estimated US$65.9 billion worth of green bond issuance taking place in 2015 is merely scratching the surface for the potential growth in the green bond markets. If the target to limit the increase of average global temperatures to well below 2 degrees Celsius – as envisaged in the Paris climate change agreement – is to be met, it will only be possible with the use of climate finance, raised predominantly from the private sector, supporting the investments necessary to change the way in which we currently source our energy.

The purpose of this paper is to examine the current state of play for green bonds, and the impediments to unlocking that growth potential.

Read the full Briefing.

16 December 2015

Reed Smith Client Alerts

Author(s): Peter Zaman, Ranajoy Basu, Claude Brown, Gábor Felsen, Adam Hedley, Nathan Menon


Forever Green.

Green bonds proved to be more than a passing fad in the municipal market this year, as issuers tapped into demand for socially responsible investment.

As of Dec. 17, green bond volume has increased 48% to $4.27 billion from $2.88 billion in 2014 and $693 million in 2013, according to data from Thomson Reuters.

“It’s a developing market, but we think it’s here to stay and it has the potential to grow even further,” said Jamison Feheley, head of banking and public finance at JPMorgan.

Environmental Finance Magazine ranked JPMorgan first globally as lead manager of green bonds through the third quarter. Feheley said that while green bonds are a global product, the U.S. municipal market has seen more growth in green bond issuance than anywhere else.

The green bond market is still relatively new, and subject to a learning curve, Feheley said.

“A lot of this past year was continuing to educate issuers on the green bond market generally, the fundamentals of the green bond principles and the developing market of socially responsible investors,” he said. “As the market continues to develop, we expect many of the large bond funds to increase their allocations to green projects and other social responsible components.”

The District of Columbia Water and Sewer Authority has been very active in the green bond market over the past few years. Back in July of 2014, DC Water came to market with a $350 million taxable fixed rate green bond with a 100-year final maturity, which was the first U.S. municipal water/wastewater utility to issue a century bond and the first U.S. green bond issuance to include an independent second party opinion.

The green bond mentioned above, financed a portion of the DC Clean Rivers Project, a $2.6 billion effort to construct tunnels that will transport combined sewer overflows to DC Water’s Blue Plains treatment facility. In October of 2015, DC Water issued another $100 million of green bonds, which included a strategy of offering a priority order period for green portfolio and retail investors, which is believed to be the first issue to give green portfolio investors priority order status. The sale generated over $180 million in orders.

“The green bond market has represented a great opportunity for DC Water,” said Mark T. Kim, DC Water’s chief financial officer. “As an issuer, we are committed to the green bond market and have established a very robust program.”

According to Thomson Reuters, DC Water ranks fifth since 2013 in green bond issuance with $450 million, behind the New York City Housing Development Corp. with $494 million; The New York State Environmental Facilities Corp. with $693 million:, the Central Puget Sound Regional Transportation Authority, with $942 million and the state of Massachusetts with $1.02 billion.

Although DC Water is not first in the rankings as far as total issuance, they are constantly pushing the envelope when it comes to best practices and standardization.

“We were the first issuer to have a second party opinion on a green bond and now we are looking to improve on our own best practices,” said Kim. “Right now, we are in the middle of doing a third party “attestation” on our green bond reporting and disclosures. The purpose of the attestation is to provide our investors with additional assurance on the core elements of our green bond program. Specifically, did we spend the money the way that we said we would? Did we meet all of the commitments we made to our investors to report on the environmental outcomes and metrics of the project? The hope is that this will establish a new best practice and investors will demand it going forward.”

Kim said that the hope is that the upfront investment in these best practices today will result in improved pricing for DC Water’s green bonds in the future. Kim also stated that because the municipal green bond market is so new and that issuance volume has only picked up in the last year or two, there are evolving standards and best practices that DC Water is trying to establish to prevent ‘green washing’, which is when issuers claim their bonds are green without offering any proof or evidence to back it up.

“The market is moving towards standardization, but it will be challenging to come up with a single definition of what a green bond is across all industries and sectors,” said Kim. “It would be great if we could reach consensus on a universal definition, but what should happen in my mind is that market discipline would help establish best practices. In other words, if investors simply refuse to buy less-credible green bonds and demand more rigorous and transparent reporting and disclosure practices from green bond issuers, then the expectation is that best practices will begin to emerge.”

Feheley agreed, saying that while the green bond principles are voluntary, market standardization is an important consideration in order to maintain the integrity of the green bond market.

“Not everything is green so a reasonably standardized framework for the offering of green bonds will enhance the overall market,” said Feheley.

While green bond sales have surged, issuers have yet to generate the expected advantage in financing costs due to demand from socially conscious investors. “In the market right now, we don’t see a significant pricing differential between green bonds and traditional bonds, but we expect this may change going forward as allocations to green projects increase,” Feheley said.

Kim agrees that the issue of cost of funds of green bonds versus “traditional” bonds has generated a lot of controversy as there has not been enough empirical evidence to establish whether green bonds offer a pricing benefit.

“I can say without a doubt that green bonds have diversified DC Water’s investor base, but I can’t say that green bonds have offered a definitive pricing benefit at this time” said Kim. “It is still a young market, still in its early days, but I don’t think anyone would claim that there is a pricing penalty associated with issuing green bonds, the real question is how much of an upside benefit is there from a pricing standpoint?”

David Goodman, partner, Squire Patton Boggs LLP, who has worked on green bond deals as a bond counsel, said the green bond market can reach its full potential, as green bonds come naturally to sectors like transportation, water and sewer, education and housing – all of which are in need of more new money deals.

“With all of the unmet demand for project demand for infrastructure and the opportunities within each of those areas to accomplish projects that are green friendly and sustainable, I don’t see why the trend would not continue to increase as there are financial and reputational benefits from green bonds,” Goodman said.

Though growth in green municipal bonds may slow from this year’s pace, issuers say green bonds are here to stay, and that efforts to educate the investors and increase transparency about the environmental benefits of projects will pay off.

“There is no question in my mind that there is a pool of capital in the market that is looking for sustainable green investments and when issuers can credibly come to market with green bonds, they can achieve investor diversification and successful bond sales,” said Kim.

THE BOND BUYER

BY AARON WEITZMAN

DEC 22, 2015 12:13pm ET


S&P: Fixing America's Surface Transportation Act's Passage Does Not Affect Grant Anticipation Vehicle Revenue Debt Ratings.

NEW YORK (Standard & Poor’s) Dec. 8, 2015–Standard & Poor’s Ratings Services today said that its ratings on 25 issuers in the grant anticipation revenue vehicle (GARVEE) sector are unaffected by the enactment of Fixing America’s Surface Transportation (FAST) Act, which President Barack Obama signed into law Dec. 4, hours before previous funding was set to expire. However, we believe FAST generally supports the sector’s credit quality, due to a longer period of funding certainty and the increased funding levels that the Act provides. Funded mainly by gasoline and diesel fuel taxes deposited in the Highway Trust Fund (HTF) and $70 billion from various sources within the general fund, the five-year, $305 billion dollar transportation reauthorization act marks the first long-term solution for highway and transit funding since 2005.

FAST replaces the Moving Ahead for Progress in the 21st Century, which was enacted in 2012 but provided funding for just slightly more than two years, and was extended several times for a few months, or even weeks at a time, as Congress debated various bill components. The Act covers funding through fiscal 2020 (year ended Sept. 30), which we view as preferable compared with what had become commonplace: eleventh-hour short-term extensions. Furthermore, FAST provides a 5.1% increase in highway fund distributions to states for fiscal 2016, and growth rates of 2.1% to 2.4% thereafter. Previous funding growth rates were lower, and until the FAST Act, Standard & Poor’s had cited federal budget deficits as a concern affecting highway funding levels. Overall, the FAST Act authorizes $230 billion for highways, $60 billion for public transportation, $10 billion for passenger rail, and $5 billion for highway safety programs. This is an approximately 11% increase from current funding levels over five years.

Standard & Poor’s ratings in the GARVEE sector range from ‘A’ to ‘AA’ for transactions where only federal funding is pledged, and as high as ‘AAA’ where state agencies blend the federal funding with an additional pledge of state funding. We base the relatively strong ratings in the sector on the issuers’ pledge of HTF grants from the federal government.

Overall, we believe, the FAST Act’s signing confirms Standard & Poor’s views of ongoing and widespread Congressional support for preserving and expanding the national highway system. States and local transportation agencies that receive distributions from the HTF can confidently move forward with complex multiyear transportation projects because the questions surrounding federal funding no longer loom. We will continue to monitor the sector to evaluate how each individual state issuer might adjust its debt or capital spending plans, given the new law.

Separate from the impact on GARVEE debt, other provisions of the FAST Act includes 70% in cuts to the Transportation Infrastructure Finance and Innovation Act (TIFIA) program, from $1 billion per year in 2015 and $750 million in 2014 to $275 million-$300 million per year during fiscal years 2016-2020, although the scope of eligible TIFIA projects has been expanded. Furthermore, FAST provides $6.2 billion for a new national freight program, and increases funding for public transportation to $12.6 billion in 2020 from
$10.7 billion in 2015.


Cashing In on the Public Right of Way.

From parking meters to freeway lighting, governments are finding new ways to turn infrastructure liabilities into assets and improve services.

State and local governments can unlock substantial public value by discovering new ways to conceptualize their assets or operations. There is no better example than how more and more cities are now viewing their rights of ways as underdeveloped resources rather than as liabilities merely requiring costly maintenance.

This revolution in thinking began a few years ago in street parking, when cities such as Indianapolis and San Francisco sparked an entirely new way to manage it. Cities today are partnering with technology providers to replace coin-operated meters with systems that accommodate more cars, dynamic pricing, mobile payment platforms and solar-powered pay stations. Somewhat similarly, New York City is converting its obsolete streetside payphones into revenue-producing interactive kiosks, which will use advertising revenue to bring city residents gigabit-speed wireless Internet free of charge.

Now the state of Michigan has implemented a unique public-private partnership to save money on a smart lighting solution for state freeways in the Detroit metro area. The state government is responsible for maintaining the some 15,000 freeway lights that illuminate those roads. In the past, the vast majority of those lamps have been low-efficiency, high-maintenance sodium or metal-halide fixtures. Due to obstacles including fiscal constraints, chronic vandalism and copper theft, the lighting system was operating at only about 70 percent of its potential service level at this time last year. Poor lighting on freeways is associated with increased traffic accidents and diminished regional economic activity, so suboptimal performance of the lighting system was no small problem.

Brighter freeways are safer freeways, but Michigan found a way to make them cheaper freeways, too. With Gov. Rick Snyder pushing his procurement team to look closely at alternative delivery methods for infrastructure projects, the state chose to change its existing way of doing business. Rather than simply continuing to pay for maintenance activities, the Department of Transportation now purchases freeway lighting as a service from a private consortium of equity owners, designers, contractors and operations managers.

This new model — state officials say it is the first of its kind in the United States — no longer encourages contractors to replace bulbs unnecessarily but instead rewards energy efficiency and vigilant upkeep. The consortium is responsible for bringing the performance level of the lighting system up to 100 percent over the next two years by replacing inefficient bulbs with high-efficiency LED fixtures, and it also is required to monitor, maintain and repair the system. State officials estimate that the project will save $18 million in energy costs over the course of the 15-year contract — money that, in turn, is helping to fund the project.

In essence, Michigan has pioneered a way to mitigate the liability the lighting system poses by shifting risk to the private sector, which is more agile than slow moving government procurement models in adapting to rapidly changing technology. But even this breakthrough is only the beginning. Other jurisdictions are looking to rethink their lighting liabilities as powerful data gathering assets.

Earlier this year, for example, San Diego partnered with GE to outfit the city’s lights with sensor-equipped LEDs that can collect ambient data. The pilot is testing the ways that the system could, in the future, enhance a host of municipal government functions, such as reducing traffic congestion, detecting open parking spaces and providing emergency responders with real-time views of an area before they arrive on the scene. Almis Udrys, San Diego’s director of performance and analytics, said the purpose of the pilot is to explore the best hardware and software options for building a “strong analytic platform,” one that also could provide information to the public in an open-data format.

We will continue to follow breakthroughs like these as governments find ways to convert liabilities into assets. What is already clear is that the staples of municipal infrastructure are beginning to emerge as connected platforms for producing broad safety and operational advantages for residents.

GOVERNING.COM

BY STEPHEN GOLDSMITH | DECEMBER 16, 2015

Craig Campbell, a research assistant at the Ash Center for Democratic Governance and Innovation at the Harvard Kennedy School, contributed research and writing for this column.


What the Fed Rate Hike Means for the Municipal Market.

Short-term interest rates will be rising for the first time in nearly a decade, the Federal Reserve Board announced Wednesday. The move means mixed results for the states and localities that borrow money in the municipal market.

Citing “considerable improvement in labor market conditions this year,” the board announced a scheduled rate hike of one-quarter percent starting in 2016. It would be the first of several small rate hikes, meaning interest rates could rise by more than 1 percent a year from now. In a statement, the Federal Open Market Committee said it is “reasonably confident that inflation will rise over the medium term to its 2 percent objective.”

The move is a signal that the board believes the economy is strong enough to keep growing without as much help from the nation’s central bank. The Fed slashed rates to zero — and has kept them there — following the 2008 financial crisis, in an effort to reboot the nation’s economy. Now, as the fiscal outlook has continued to improve, this week’s announcement was widely expected.

For those who issue municipal bonds, the rate hike has no immediate implications on any outstanding government debt. But it will likely place a slightly higher price tag on the cost of issuing debt in the coming year.

Still, many do not expect it to have a dampening effect on the municipal bond market as a whole.

For one, any government refinancing its debt will still be doing so at a significantly lower interest rate to generate savings.

Another big reason the rate hike will have a muted effect on the muni market is that the Fed’s decision only impacts short-term interest rates, not long-term ones. In fact, sometimes a hike in short-term rates can actually cause a downward tick in long-term rates — saving money for governments that can afford to issue long-term debt.

For example, between 2004 and 2006, the Fed raised the short-term rate from 1 percent to 5.25 percent. During that time period, the rates on a 10-year Treasury bond only went up a half percentage point. And yields on the 30-year bonds actually went down slightly. The reason is because when short-term interest rates are increased, it actually dampens the impact of inflation, which is what plays the larger role in setting long-term interest rates.

“The expectation is the yield curve will flatten and influence the longer term much less,” said Tim Barron, chief investment officer at Segal Rogerscasey. “So if you’re refinancing a 20-year bond, it is likely to have very modest effects.”

But the mere act of raising the rate, even though it was expected, does create a little volatility. That’s because municipal investors will be closely watching to see how soon — and by how much — the Fed raises rates again. Another small step-up next year would signal that the economy is on track with expectations. A bigger hike would indicate a faster-growing economy. If there’s not another rate hike, then it could be a sign of an economy that’s slowing down again.

So, while the impact on government issuers remains to be seen, some entities will see more immediate benefits. Pension funds welcome a higher rate because it likely means more interest income will be generated from their bond investments, said Gail Sussman, managing director at Moody’s Investors Service. The shift comes just months after pension funds reported they had meager earnings in fiscal 2015, due in part to poor returns from global public equities.

Housing finance agencies also benefit from the rate hike. They “will see higher profit margins, greater financing flexibility, and an opportunity to grow loan portfolios in a higher-rate environment,” Sussman said.

GOVERNING.COM

BY LIZ FARMER | DECEMBER 17, 2015


Public Pensions’ Latest Challenge: Longer Lives.

Increases in retirees’ longevity are likely to make an already dismal fiscal picture look worse.

There is no shortage of self-inflicted wounds plaguing state and local government pension systems. Among the most common are failing to address funding problems even after they become clear, using pension enhancements rather than salary increases to attract and retain employees, and employing unrealistic assumptions about pension-fund investment returns to make their finances appear artificially rosy.

But San Francisco’s current pension troubles are less of the city’s own making. Sure, the fund assumes a 7.5 percent return on its investments and is currently reaping just 4 percent, but there’s a bigger problem: The city’s retirees, like Americans in general, are just living too long.

Last year the nonprofit Society of Actuaries released its first updated projections on Americans’ longevity since 2000. The organization found that the average 65-year old male would live 86.6 years, about two years longer than previously forecast, and that the average 65-year-old female would live 88.8 years, an increase of nearly two and a half years. For public and private pension funds, those additional years of drawing retirement benefits translate into a 4-8 percent jump in funding obligations.

San Francisco’s voter-approved 2011 reforms changed the pension formula for new hires and capped some payments. As a result, pension obligations were expected to peak last year, but they’re still growing, and a large part of that growth is related to retiree longevity. Pension funding is the biggest cause of a $99 million hole in the city’s 2016-17 budget.

The numbers are particularly disheartening because in a booming economy city leaders assumed that controlling pension costs would free up money for transportation infrastructure and other upgrades. Instead, they’re left to figure out how to close a budget gap — and to worry about what to do when the local economy slows down.

What’s happening in San Francisco will likely be seen across the pension landscape as the new longevity numbers are factored in. More and more, the pension crises state and local governments face resemble the Hans Brinker story about the little Dutch boy trying to plug holes by sticking his finger in the dike. Whether self-inflicted or otherwise, there appears to be no end to the new problems.

It’s no wonder that the vast majority of private-sector employers have moved away from traditional but more expensive defined-benefit pensions. And while public-to-private-sector comparisons are often problematic, it seems unrealistic to think governments can resist that trend, as most continue to do, and still deliver the range of public services their constituents expect. I have long advocated for public pension systems to transition to a defined-contribution model, but with a “cash balance” option for the risk-averse that guarantees a set interest rate on both employer and employee contributions.

Governments can continue to offer more-generous retirement benefits than their private-sector counterparts, but taxpayers can no longer afford to shoulder the entire risk for the seemingly endless variables that increase pension liabilities. While few would wish anything but the longest lifespans for retired public servants, it’s becoming clear that increasing longevity is one of the variables that are likely to continue to bedevil the world of pension funding.

GOVERNING.COM

BY CHARLES CHIEPPO | DECEMBER 18, 2015


Public Pension Network Opposes Additional Pension Reporting in Puerto Rico Specific Legislation.

National Conference of State Legislatures (NCSL)
International Association of Fire Fighters (IAFF)
United States Conference of Mayors (USCM)
Fraternal Order of Police (FOP)
National Association of Counties (NACo)
National Education Association (NEA)
National League of Cities (NLC)
International City/County Management Association (ICMA)
National Association of Police Organizations (NAPO)
National Association of State Auditors Comptrollers and Treasurers (NASACT)
American Federation of State, County and Municipal Employees (AFSCME)
Government Finance Officers Association (GFOA)
International Public Management Association for Human Resources (IPMA-HR)
National Conference of State Social Security Administrators (NCSSSA)
National Conference on Public Employee Retirement Systems (NCPERS)
National Council on Teacher Retirement (NCTR)
National Association of State Retirement Administrators (NASRA)

December 11, 2015

VIA FACSIMILE: (202) 224-2499

The Honorable Mitch McConnell
Majority Leader
United States Senate
Washington, DC 20510

Dear Majoriy Leader McConnell:

On behalf of the national organizations listed above, representing state and local governments,
elected officials, employees and retirement systems, we are writing to express our strong
opposition to public pension requirements contained in the Puerto Rico Assistance Act of 2015
(S. 2381). These provisions are not limited to the territory of Puerto Rico, but impose a federal
mandate on all state and local governments in areas that are the fiscal responsibility of sovereign
States and localities, and are conflicting, administratively burdensome and costly.

The provisions are not germane to the underlying legislation, nor do they protect benefits, save
costs or improve retirement system funding. They also have neither been introduced this
Congress as stand-alone bills nor received consideration under regular order, including in the
many hearings pertaining to Puerto Rico.

State and local government retirement systems are established and regulated by state laws and, in
many cases, further subject to local governing policies and ordinances. State and local
governments have and are taking steps to strengthen their pension reserves and operate under a
long-term time horizon. Since 2009, every state has made changes to pension benefit levels,
contribution rate structures, or both. Many local governments have made similar modifications to
their plans. A compendium of information that corrects many misperceptions regarding the
financial condition of these governments and their retirement plans can be found here: State and
Local Fiscal Facts: 2015.

Federal interference into the fiscal affairs of state and local governments is neither requested nor
warranted. Therefore, we strongly urge the exclusion of provisions impacting state and local
government retirement systems from legislation relating to Puerto Rico assistance or any other
legislation under consideration.

If you have any questions or would like additional information, please feel free to contact any of
our organizations’ legislative staff listed below. We would be more than happy to meet with your
office to discuss this important matter further.

Sincerely,

Jeff Hurley, NCSL, (202) 624-7753
Barry Kasinitz, lAFF, (202) 737-8484
Larry Jones, USCM, (202) 293-2352
Timothy Richardson, FOP, (202) 547-8189
Michael Belarmino, NACo, (202) 942-4254
Alfred Campos, NEA, (202) 822-7345
Carolyn Coleman, NLC, (202) 626-3000
Elizabeth K. Kellar, ICMA, (202) 962-3611
Bill Johnson, NAPO, (703) 549-0775
Cornelia Chebinou, NASACT, (202) 624-5487
Ed Jayne, AFSCME, (202) 429-1188
Emily Swenson Brock, GFOA, (202) 393-8467
Neil Reichenberg, IPMA-HR, (703) 549-7100
Maryann Motza, NCSSSA, (303) 318-806
Hank Kim, NCPERS, (202) 624-1456
Leigh Snell, NCTR, (540) 333-1015
Jeannine Markoe Raymond, NASRA, (202) 624-1417


Fixed Income Outlook 2016: Have Rising Interest Rates Been Priced Into Bonds?

With the Fed finally raising rates — and more hikes likely to come — we look at the opportunities and dangers in fixed income in the New Year

The markets yawned when the Federal Open Market Committee raised its target by 25 basis points for the federal funds rate on Dec. 16, since the widely anticipated move had already been priced into the market. When the Third Avenue Focused Credit Fund halted redemptions from its high-yield fund in early December, there was much consternation but no contagion into other junk bond vehicles.

In a November interview, Kathy Jones, chief fixed income strategist for the Schwab Center for Financial Research, pointed out that the markets had already priced in the Fed rate hike. “Look at two-year notes,” she said, “they’re yielding almost 90 bps; a year ago they were yielding 22, 23, so clearly the market has discounted a couple of rate hikes at the short end.”

However, the pace of further Fed increases in 2016 and the prospects for more volatility, especially in the currency markets, along with more quantitative easing by the European Central Bank and its counterparts in Japan and China, may well affect yields next year.

As for the Fed itself, in a Dec. 22 note to investors, George Rusnak, co-head of global fixed income strategy for Wells Fargo Advisors, pointed out that in its Dec. 16 statement, the Fed “included the word ‘gradual’ twice when referring to the path and probability of future rate hikes. The addition of this word indicates that the Fed will be quite cautious before making future rate increases.”

Just as the Fed communicated regularly before taking action on Dec. 16, Rusnak believes the Fed “will work to clearly guide the markets prior to rate hikes in order to avoid market disruptions.”

As Treasuries are expected to fade, here’s where the biggest money managers are finding value.
Below, we look at the outlook for some specific fixed income sectors. As for the bigger picture for bonds, Timothy Paulson, fixed income investment strategist for Lord Abbett, said in a note to investors on Dec. 21 that the consensus in 2016 is for rising interest rates and a flattening yield curve, in which rates on shorter-maturity issues rise faster than those of longer maturity.

Despite that consensus, Paulson reminded investors that “markets move when expectations change, and those expectations could be volatile as we get more information on economic data” throughout the year. Paulson also reports that Lord Abbett has already seen “some increase in risk premium in asset classes like high yield, emerging-market bonds, and leveraged loans, where yield spreads widened meaningfully in 2015.”

Wells Fargo’s Rusnak said he expects the Fed to raise rates “only two to three times in 2016” and thinks it “very unlikely that the Fed will consider going back down to a zero interest rate policy (ZIRP) anytime soon.”

Jones said Schwab’s view on how fixed income investors should react to higher rates “is that if we’re going to see a flatter yield curve and higher volatility, then we’re cautious on credit — we’re neutral on high yield, we’re underweight EM bonds and international developed market bonds because we think the dollar will continue to go up.”

So what does Jones like? “We’re looking at the upper tranches of the credit quality spectrum,” she said.

Moreover, she suggested that investors might want to use a barbell strategy, where you have some short-term paper — CDs, cash — that will adjust as short-term rates move up and add to the bond portfolio “some high-quality intermediate term bonds to generate the income” that clients need.

Municipals

Dan Solender, director of municipal bonds at Lord Abbett, is bearish on munis for 2016, arguing that “supply should remain on the higher side” but will be matched by “consistently strong” demand. Writing in a Dec. 21 note, Solender said he believes that “other than the few high-profile troubled issuers in the headlines, credit quality should remain on a positive trend, based upon tax revenue strength and the volume of upgrades compared to downgrades from the credit rating agencies.” Munis from those “high-profile” issuers — Illinois and Puerto Rico — will “remain under pressure,” he predicts, but “their issues should remain isolated and not affect the entire market.

Among the trends he thinks will continue in 2016 is that individual investors will decrease holding individual bonds in favor of managed products, while banks will decrease their municipal bond holdings due to regulatory pressure and to reduce their risk. Solender thinks Fed rate hikes could increase investor demand for munis and concludes that the muni market “has had a good 2015; we think it is well positioned for 2016.”

Emerging Markets

Schwab’s Jones says she is underweight EM bonds moving into 2016, and PIMCO analysts Richard Clarida and Andrew Balls agree, saying that “emerging markets remain a potential source of volatility.” Writing in the firm’s December Cyclical Outlook, Clarida and Balls say their “baseline view is there will be less macro spillover from China to the rest of the world, via commodity and trade channels, in the next 12 months compared with the past 12 months.” They argue that China’s slower growth trajectory “is now priced into macro forecasts and markets.” They warn, however, that the Chinese government’s policy, “especially foreign exchange policy, is a key source of risk.”

Overall, the PIMCO analysts see fixed income opportunities not in EM debt, but “across investment-grade, high-yield, U.S. bank senior debt and bank capital in Europe.”

High-Yield Bonds

Steven Rocco, high-yield portfolio manager at Lord Abbett, acknowledges that the high-yield space showed turbulence in 2015, “owing in large part to weakness in the energy and mining and metals sectors.” For 2016, unless the U.S. economy heads into recession, which he calls “not a likely outcome,” he is bullish on high yield. Should U.S. consumer spending continue to advance at a 3% clip in 2016, that would benefit “key high-yield sectors such as retail and restaurants.”

As Treasuries are expected to fade, here’s where the biggest money managers are finding value.
Lord Abbett sees the default rate on high-yield issues “rising to about 4.5% during 2016, versus a level of around 2% in 2015, with most of the increase coming from energy and metals issuers.” But even that development could yield “some buying opportunities within the high-yield market if the default number comes in below the expected level.” Rocco argues that “the real wild card in the market … will be demand for crude oil; any bounce in demand could help spark a rally in energy bonds in the late second half of 2016.”

Writing on Dec. 15, Anthony Valeri of LPL Financial says that “the origin of high-yield weakness has come from the lowest-rated tiers of the high-yield market but has infected the broader market.” While volatility will persist, he nevertheless believes the high-yield bond market “offers good value at current prices for suitable long-term investors but the near-term still looks challenging. Current default expectations in both the overall high-yield market and in the energy sector, 9% and 16%, respectively, are overly pessimistic, but they take a backseat to trading flow dynamics, which can overpower fundamental drivers in the short run.”

Russ Koesterich, BlackRock’s global chief investment strategist, sounds a cautious note. “While we believe high yield (outside of issues from energy and other natural resources firms) can stabilize in 2016, the reality is that we’re getting late in the credit cycle.” To Koesterich, that suggests that “U.S. stocks and bonds may continue to struggle, unless we see a more meaningful acceleration in the global economy.

ThinkAdvisor

By James J. Green

Group Editorial Director
Investment Advisor Group
ThinkJamieGreen

December 23, 2015


U.S. Municipal Bonds on Solid Footing Heading Into 2016.

CHICAGO/NEW YORK Dec 23 – Manageable supply, healthy demand and stable credit outlooks should aid U.S. municipal bond performance in 2016 despite the Federal Reserve hiking interest rates, analysts and investors said.

While municipal bonds are ending 2015 on top of the fixed-income heap, some market analysts expect positive but smaller returns next year.

Tax-exempt bonds beat U.S. Treasuries and corporate and mortgage debt on Bank of America Merrill Lynch’s master indices, with year-to-date total returns of 3.27 percent as of Dec. 17. Barclays’ muni index returns as of Monday of 3.23 percent also outperformed every other U.S. and Canadian fixed-income index.

BofA believes munis can generate about 3.1 percent in returns next year, according to Philip Fischer, a municipal research strategist.

“We think the muni market is in good condition,” he said.

Morgan Stanley’s forecast calls for more-modest returns of 1.25 percent. However, Barclays’ muni analysts project total tax-exempt returns to turn slightly negative at -1.0 percent to -0.5 percent in the coming year.

“Higher Treasury rates, rich valuations and headline risks are set to make 2016 a lackluster year for the municipal market,” Barclays said in a Dec. 4 research note.

Last week’s Fed rate hike and the promise of fatter yields could entice investors who have been sitting on the sidelines with cash to come back into the muni market.

“I think the odds are pretty good that the damage to munis specifically from (federal monetary policy) will be very modest,” said Chris Mier, a managing director at Loop Capital Markets.

Yields on Municipal Market Data’s benchmark triple-A scale are ending 2015 close to where they began the year, with 10-year bonds at 1.93 percent and 30-year bonds at 2.82 as of Tuesday.

But tax-exempt munis, which spent much of the year yielding more than comparable taxable U.S. Treasuries, were yielding less heading into 2016. The 10-year muni/Treasury ratio stood at 86.3 percent and the 30-year at 95.2 percent on Tuesday. Past periods of tightened monetary policy have lowered the ratio, signaling munis were outperforming taxable debt, according to analysts at Janney.

As of Friday, states, cities, schools and other issuers sold $376.6 billion of munis, 20 percent more than in the same period in 2014, with refunding volume outpacing new money issuance, according to Thomson Reuters data.

Projections for 2016 issuance range from $325 billion to $450 billion as still-low interest rates, even after the Fed’s rate hike and an anticipated yield curve flattening, should continue to accommodate refundings, while pent-up infrastructure needs could spur an uptick in new money deals.

Nicholos Venditti, portfolio manager at Thornburg Investment Management, said supply may initially climb as the Fed rate hike could set off a scramble by muni issuers seeing their “last chance to issue at these incredibly low rates.”

Still, Dan Heckman, senior fixed-income strategist at U.S. Bank Wealth Management, foresees a “big issuance problem.”

“Refundings are increasingly going to dwindle,” he said. “It’s very hard to get ballot initiatives passed that might translate to new issuance.”

Demand remains strong with 11 straight weeks of hefty net inflows to muni funds as of the week ended Dec. 16, according to Lipper.

REUTERS

BY KAREN PIEROG AND HILARY RUSS

(Reporting by Karen Pierog and Hilary Russ; Editing by Dan Grebler)


Not Your Grandfather's Municipal Market: Investors Eye Recovery Value.

Tainted from the Detroit bankruptcy and mired in the Puerto Rico debt crisis, investors are re-evaluating the former safe haven of the bond world, municipals, and emphasizing recovery values in their credit work.

Bonds that had what is known as an unlimited tax general obligation pledge once held the apex of security for muni investors as debt offering documents promised that a municipality would tax its citizens as much as needed in order to make good on its debt payments. Plummeting tax collection rates and a population exodus made this difficult for the Motor City, leading to its historic bankruptcy.

The Detroit case left holders of the unlimited tax GOs with a recovery of 74 cents on the dollar while retirees kept almost all of their benefits, inciting an about face in investor calculus. Now, lawmakers are pushing legislation to assure bondholders of the formerly sacred debt’s “secured status” in bankruptcy.

California passed Senate Bill 222 into law this year, while Illinois’ bankruptcy bill HB 4214 floats in the legislature. Michigan and Nebraska have legislation on the table promising investors a statutory lien on revenue sources. Meanwhile, investors embroiled in Puerto Rico’s debt crisis are battling bankruptcy eligibility in and of itself.

Lawyers agree that the statutory lien could improve recovery values in a Chapter 9 bankruptcy, making bondholder claims secured. The feature helped bondholders in the Central Falls, Rhode Island case, although it was not litigated.

These legal developments may affect the bargaining power afforded to capital markets creditors in future bankruptcies, as they make lien protection unambiguous for bondholders, said Robert Christmas of Nixon Peabody.

And the market seems to agree. Detroit tested its market access in August for the first time since emerging from bankruptcy, coming to market with $245 million in debt, backed by a lien on income tax revenues. The formerly-insolvent city managed to woo investors with 4.5% yields, high for the A credit rating, but arguably low for a city that gave bondholders a haircut.

The successful issuance highlights an evolving approach to municipal investing. Investors are pricing in the statutory lien status, which is only relevant in a bankruptcy, noted William Bonawitz, director of research at PNC Capital Advisors.

Lower yields mean lower costs for borrowers, which leads some to argue that the legislation would be beneficial to cities and school districts nationwide. Others claim it creates an uneven playing field for creditors.

As muni players catch up to their corporate counterparts in the area of recovery analysis, they may hit a brick wall. There is little precedent to determine whether the new legalese will provide investors the security they hope for. Moreover, municipalities can’t simply cease to exist.

If a judge is faced with deciding between funding the public safety and health requirements of a municipality or paying bondholders, the judge might favor tax-paying citizens, investors tell Debtwire.

Recovery analysis is distinctly different in public finance. Buyers of distressed corporate debt can walk away with equity in a company, while a municipality’s biggest assets are its taxpaying citizens. There is no way to boost value so that investors walk away with a bigger piece of the pie.

Municipalities granting secured status to more and more bonded debt could reach a point where the revenue stream backing the bonds becomes diluted, and the value of the lien itself deteriorates, Bonawitz concluded.

Forbes

By Gunjan Banerji

Gunjan Banerji is a reporter for Debtwire Municipals covering distressed credits, particularly in Illinois and Michigan. She also covers education. She can be reached at [email protected].

DEC 22, 2015 @ 10:34 AM


The Muni Trades That Pushed Pimco to the Top in Year of Distress.

Pacific Investment Management Co.’s high-yield municipal-bond mutual fund is jockeying for the top returns of 2015 after picking winners among pockets of distress. Here are the calls that put it there:

Puerto Rico, the junk-rated Caribbean commonwealth saddled with $70 billion of debt and a stagnant economy? Stay away.

Chicago, which lost its investment grade from Moody’s Investors Service in May because its pensions are underfunded by $20 billion? Jump in.

Tobacco bonds, 80 percent of which Moody’s predicts will eventually default as cigarette consumption declines faster than anticipated? A buying opportunity.

“Those were our big credit decisions,” said David Hammer, who co-manages the $583 million fund with Joe Deane in New York.

The fund returned 5.9 percent through Friday, continuing a neck-and-neck race with Invesco Ltd.’s high-yield muni portfolio for the first-place title among open-end funds with at least $100 million in assets, data compiled by Bloomberg show.

Together, the decisions are a microcosm of the year that was in the $3.7 trillion municipal market. Bond buyers sought extra yield as interest rates remained near generational lows, yet many were hesitant to invest in Puerto Rico and Chicago until their financial paths became clearer.

Zero Puerto Rico

In Puerto Rico, the way forward only got murkier in 2015. So Pimco kept its allocation to commonwealth bonds at zero as Governor Alejandro Garcia Padilla said the island needs to restructure its debts to emerge from a severe fiscal crisis. This month, he said the U.S. territory could default on Jan. 1, when almost $1 billion of interest is due.

It took the Puerto Rico Electric Power Authority more than a year to reach a tentative agreement last week with bondholders and insurers to lower its $8 billion debt, showing how difficult such talks are without the threat of filing for bankruptcy. Getting Chapter 9 extended to the commonwealth hasn’t gained traction in Congress. The U.S. Supreme Court in 2016 will rule on the island’s Recovery Act, a measure allowing for the Puerto Rico’s publicly owned corporations to restructure debt that was struck down in court.

“A key part of our decision to not invest in Puerto Rico up until now is the lack of a clear set of rules to provide Puerto Rico debt relief, which we think is inevitable,” Hammer said. “We want to know what the rules are before we’re willing to commit investor capital.”

The call paid off: Junk-rated Puerto Rico bonds have plunged 13 percent this year, the third worst of all market segments tracked by Barclays Plc.

“I’d expect us to remain very cautious on Puerto Rico until we have a set of investable rules,” Hammer said. “There will be a lot of noise without a lot of clarity, and that’s not good for bond prices.”

Chicago as Junk

Some investors extended their caution to Chicago, the only big city besides Detroit that Moody’s deems junk. Some of its securities fell by more than 10 cents on the dollar in less than a week after the May downgrade, on speculation that Chicago would face a liquidity crisis because the rating cut exposed it to as much as $2.2 billion of payments to banks if it couldn’t refinance its debt.

Pimco saw it as a buying opportunity. The high-yield fund took a $9 million position in general obligations due in 2033 that the city issued in July, making it the fund’s sixth-largest single holding by Sept. 30, Bloomberg data show. The debt priced at 98.5 cents on the dollar to yield 5.64 percent. It last traded in October at 103.6 cents to yield 5 percent.

Chicago avoided a cash squeeze by refinancing. The securities went on to rally after Mayor Rahm Emanuel in October pushed through the biggest property-tax increase in the city’s history — $543 million over the next four years — to help pay the pension-fund bills at the root of the its distress. Emanuel, a Democrat who won re-election in 2015, had resisted raising the levy for years even though it was lower than surrounding localities.

“Our view was that we would get a property-tax increase out of Chicago, that it would go a long way in beginning to address their fiscal imbalances when it comes to underfunded pension liabilities, and that the market would reward Chicago for demonstrating that they have not just the ability but the willingness to raise revenues,” Hammer said.

While the city has challenges ahead, the property-tax increase “does fundamentally improve their credit outlook,” Hammer said.

Tobacco Overload

On the topic of credit outlooks, no major segment of the municipal market seemed to have a worse prognosis heading into 2015 than tobacco bonds.

The agencies that sold the debt, which is repaid from legal-settlement money that states and localities receive from cigarette companies, didn’t anticipate that smoking would decline as much as it has since they started issuing the securities more than a decade ago. Because of that oversight, four out of five will eventually default, Moody’s said in a September 2014 report.

While that could still be the case, failures to pay may be pushed back. Cigarette consumption held steady this year for the first time since 2006. That sparked a rally in the riskiest tobacco bonds: they’ve gained 14 percent in 2015, the second-best of any market segment.

That’s been a boon for Pimco because the three largest holdings in its high-yield fund are tobacco bonds from New Jersey and Ohio.

“The tobacco sector has had pretty significant outperformance versus the broader high-yield muni market,” Hammer said. “Tobacco is still pretty attractive versus other traditional, less-liquid, lower-rated muni names.”

Bloomberg

by Brian Chappatta

December 21, 2015 — 9:01 PM PST Updated on December 22, 2015 — 5:10 AM PST


Judge Rejects San Bernardino’s Bankruptcy Proposal.

Judge says plan doesn’t contain enough information for bondholders

A federal judge said San Bernardino’s leaders need to explain their plan to have the southern California city exit bankruptcy protection by repaying a fraction of its debts instead of raising taxes.

U.S. Bankruptcy Judge Meredith Jury Wednesday rejected—for a second time—the city’s proposal to cut debts, saying it didn’t contain enough information for bondholders, retirees who face health-care cuts and others to vote on the proposal. She agreed to consider another draft of the plan at a March 9 hearing in U.S. Bankruptcy Court in Riverside, Calif.

Several groups protested the bankruptcy-exit plan’s wording, arguing that city leaders should explain why they can’t pay a class of debt valued between $130 million and $150 million more than 1 cent on the dollar. That includes $52 million owed to bondholders who extended money to the city so it could pay pensions.

Bondholders’ lawyers have objected to the plan, saying the city should raise taxes instead. In court papers, they pointed out that voters in northern California city of Stockton approved a sales tax of at least $28 million annually to help that city emerge from bankruptcy earlier this year, according to their projections filed in U.S. Bankruptcy Court in Riverside, Calif.

A sales tax increase of 0.25% to 8.50% for San Bernardino could bring in more than $150 million over the next 17 years, they said in court papers filed earlier this year.

At Wednesday’s hearing, Judge Jury didn’t say whether she thought the 1% payment rate was fair. Instead, she said city leaders need to better explain why that amount has remained the same since they suggested new ways to cut costs.

“The city does need to disclose further why it has arrived at a decision that you can’t raise taxes or otherwise increase revenues that way,” Judge Jury said. “The city’s position on that needs to be clarified.”

San Bernardino officials plan to continue making full payments into the pension fund run by California Public Employees’ Retirement System, also known as Calpers, which distributes that money to thousands of retired city workers.

City officials decided to make pension payments, even though federal judges in charge of Detroit and Stockton’s bankruptcy cases ruled that pensions could indeed be cut. In its plan, San Bernardino said it considered breaking ties to Calpers but determined that it wasn’t realistic if the city wanted to attract workers.

Pension benefits enjoy strong protections by states. Some pension plans have tried to overcome shortfalls by cutting benefits for future hires or reducing cost-of-living adjustments. But filing for bankruptcy protection gives a city or county the power to cut contracts, including pension agreements that promise payments for retired and current city workers.

Bondholder officials have criticized that decision through San Bernardino’s bankruptcy.

THE WALL STREET JOURNAL

By KATY STECH

Dec. 24, 2015 9:14 a.m. ET

Write to Katy Stech at [email protected]


Pension Risks Point to Higher 2016 Borrowing Costs for Some U.S. Cities.

NEW YORK — Some U.S. cities may have to pay higher interest rates to borrow money in 2016 as they contend with a host of new pressures on their underfunded public pensions, including new reporting rules and the impact of this year’s tepid investment returns.

The recession-era ghost of public pensions problems will continue haunting the $3.7 trillion U.S. municipal bond market next year, investors and analysts told Reuters.

Investors are expected to demand greater compensation, especially for financially weak municipalities that for the first time will have to move unfunded pension liabilities from the footnotes of financial statements to their balance sheets.

“A lot of local (general obligation bonds) don’t have, in my opinion, the cheapness to compensate for this new information flow we’re going to get,” said R.J. Gallo, senior portfolio manager at Federated Investors in Pittsburgh.

When interest rate spreads widen on a city’s general obligation (GO) debt, its existing debt underperforms and usually leads to higher rates for new borrowing.

Investment losses during the last U.S. recession – which ended in 2009 – laid bare the fact that many states and cities shortchanged their public employee retirement systems for years. In the third quarter of 2015, unfunded liabilities rose nationally to a near three-year high of $1.71 trillion combined, according to Federal Reserve data.

To be sure, municipal bonds outperformed every other U.S. fixed income product in 2015, returning 3.23 percent as of Dec. 21, according to Barclays’ Municipal Bond index.

But well-known pension problem spots like Chicago, and states such as Illinois, New Jersey, Pennsylvania, Connecticut and Kentucky will continue to be causes for investor concern.

In addition, a new rule from the Governmental Accounting Standards Board (GASB) that moves unfunded liabilities onto city and state balance sheets is expected to highlight new problem areas.

The rule, GASB 68, will make lesser-known places like Billings, Montana appear in worse shape than previously thought, according to a forthcoming report by the Center for Retirement Research at Boston College.

Reuters exclusively reviewed a draft of the report, which is expected to show that in 92 cities that pay into a cost-sharing state pension plan, unfunded liabilities as a percentage of city revenues will nearly double, to 70 percent in aggregate from 37 percent.

Cities that participate in such state plans do not always have control over their contributions or shortfalls. But other cities that run their own independent plans, such as New Haven, Connecticut, are also expected to look worse.

The rule is in effect for fiscal years ending June 30, 2015 and later. While it will not increase actual liabilities or change required pension contributions, it will make shortfalls more apparent and potentially raise risk premiums.

Moody’s Investors Service has a stable 2016 outlook for both state and local government sectors – with the exception of those “unable to make progress toward funding large pension liabilities.”

Compounding the picture is a changing perception about the GO bond pledge itself after the cities of Detroit and Stockton bankruptcy judgments put bondholders below pensioners – making an under-funded pension a bigger potential problem for investors which buy GO debt.

“The GO pledge, the pledge that the municipal market for its entire existence viewed as sacrosanct, now isn’t,” said Nicholos Venditti, portfolio manager at Thornburg Investment Management in Santa Fe. “Given the strength of the muni market this year, I don’t believe investors have been compensated in general for that incremental risk.”

By REUTERS

DEC. 22, 2015, 1:54 P.M. E.S.T.

(Reporting by Hilary Russ; Additional reporting by Lisa Lambert; Editing by Daniel Bases and Bill Rigby)


GASB Issues Guidance for External Investment Pools and Pool Participants Ahead of SEC Rule Change.

Norwalk, CT, December 23, 2015 — The Governmental Accounting Standards Board (GASB) today issued guidance addressing how certain state and local government external investment pools and participants in external investment pools may measure and report their investments in response to changes contained in a U.S. Securities and Exchange Commission (SEC) rule due to take effect in April 2016. References to that rule were previously incorporated in GASB literature.

GASB Statement No. 79, Certain External Investment Pools and Pool Participants, permits qualifying external investment pools to measure pool investments at amortized cost for financial reporting purposes. The Statement provides guidance that will allow many pools to continue to qualify for amortized cost accounting.

For governments, these external investment pools function much like money market funds do in the private sector. Government investment funds pool the resources of participating governments and invest in short-term, high-quality securities permitted under state law. By pooling their cash together, governments benefit in a variety of ways, including from economies of scale and professional fund management.

GASB Chair David Vaudt said, “The new guidance for qualifying external investment pools and participants in external investment pools will help them to avoid confusion when the regulatory rule changes become effective. Statement 79 will allow those pools the option of continuing to measure and report their investments at amortized cost.”

Existing standards provide that external investment pools may measure their investments at amortized cost for financial reporting purposes if they follow substantially all of the provisions of the SEC’s Rule 2a7. Likewise, participants in those pools are able to report their investments in the pool at amortized cost per share.

Reporting at amortized cost reflects the operations of external investment pools when they transact with participants at a stable net asset value per share. Not having the option to report under amortized cost would represent a significant change from current practice for both pools and pool participants.

Statement 79 replaces the reference in existing GASB literature to Rule 2a7 with criteria that are similar in many respects to those in Rule 2a7. Although the Board considers those criteria to be relevant, it also believes that external investment pool accounting and financial reporting standards should not be subject to regulatory changes that might be made in the future when those changes were not originally intended to be applied to those pools.

The Statement also establishes additional note disclosure requirements for qualifying pools and for governments that participate in those pools. These required disclosures include information about limitations or restrictions on participant withdrawals.


GASB Issues Proposed Guidance on Fiduciary Activities, Asset Retirement Obligations, and Pensions.

Norwalk, CT, December 22, 2015 — The Governmental Accounting Standards Board (GASB) today issued three Exposure Drafts proposing accounting and financial reporting guidance related to fiduciary activities, certain asset retirement obligations, and pension issues.

The Exposure Draft, Fiduciary Activities, would establish guidance regarding what constitutes fiduciary activities for financial reporting purposes, the recognition of liabilities to beneficiaries, and how fiduciary activities should be reported. The proposed Statement would apply to all state and local governments.

The Exposure Draft, Certain Asset Retirement Obligations, would establish guidance for determining the timing and pattern of recognition for liabilities related to asset retirement obligations and corresponding deferred outflows of resources. An asset retirement obligation is a legally enforceable liability associated with the retirement of a tangible capital asset, such as the decommissioning of a nuclear reactor.

The Exposure Draft, Pension Issues, addresses practice issues raised by stakeholders during the implementation of Statements No. 67, Financial Reporting for Pension Plans, and No. 68, Accounting and Financial Reporting for Pensions.

“These proposed standards are designed to improve the reporting of important activities and transactions in governmental financial statements,” said GASB Chair David A. Vaudt. “The proposals addressing fiduciary activities and certain asset retirement obligations would establish guidance in areas where little or none exists today. The Exposure Draft addressing pension issues comes in response to issues raised by GASB stakeholders as they carried out the process of implementing the recent pension standards. Together, these proposals are designed to improve consistency, comparability, and clarity in governmental accounting and financial reporting.”

Read the Exposure Drafts.

Stakeholders are encouraged to review and provide comments on the Exposure Drafts by the following dates:

Pension Issues

The objective of this proposed Statement is to improve consistency in the application of accounting and financial reporting requirements for employers related to pensions and for pension plans by addressing certain practice issues.

Specifically, this proposed Statement would address issues regarding:

Fiduciary Activities

Governments currently are required to report fiduciary activities in fiduciary fund financial statements. Existing standards are not explicit, however, about what constitutes a fiduciary activity for financial reporting purposes. Consequently, there is diversity in practice with regard to identifying and reporting fiduciary activities.

The central objective of this proposed Statement is to enhance the consistency and comparability of fiduciary activity reporting by state and local governments. The proposal also is intended to improve the usefulness of fiduciary activity information, primarily for assessing the accountability of governments in their roles as fiduciaries.

Certain Asset Retirement Obligations

Existing laws and regulations require state and local governments to take specific actions to retire certain capital assets, such as the removal and disposal of wind turbines in wind farms, and the dismantling and removal of sewage treatment plants. Other obligations to retire certain capital assets may arise from contracts or court judgments.

Under this proposed Statement, a government that has legal obligations to perform future asset retirement activities related to its tangible capital assets would be required to recognize a liability and a corresponding deferred outflow of resources. The proposal identifies the circumstances that determine if and when to recognize these transactions.

The objective of this proposed Statement is to enhance the comparability of financial statements by establishing uniform criteria for governments to recognize and measure these asset retirement obligations, including obligations that previously may not have been reported. This proposed Statement also would enhance the usefulness of the information provided to financial statement users by requiring disclosures related to these asset retirement obligations.


CUSIP: New Municipal Bond Identifiers Issued at Fastest Pace Since July 2015.

CUSIP Global Services (CGS) today announced the release of its CUSIP Issuance Trends Report for November 2015. The report, which tracks the issuance of new security identifiers as an early indicator of debt and capital markets activity, suggests continued growth in new corporate and municipal bond issuance over the next several weeks.

Read the report.


Muni-Bond Buyers Say Forget the Fed as Market Set for Top Gains.

As municipal bonds head toward the strongest returns in the U.S. fixed-income markets this year, investors say the end of near-zero interest rates will do little to knock state and local-government debt off its stride.

Money has been pouring into muni funds at the fastest pace since January. Defaults are falling for a fifth straight year. State and cities are being aided by an influx of tax revenue, thanks to rising real estate prices and falling unemployment. And the push to lift borrowing costs comes after a years-long refinancing wave may have run its course: Most analysts predict that new bond sales will hold steady or even fall in 2016.


“Demand for munis has been tremendous,” said John Bonnell, a senior portfolio manager in San Antonio at USAA Investment Management Co., which oversees $20 billion of local debt. “There’s just so much cash in our market looking to get invested.”

The $3.7 trillion muni market has returned 3.1 percent this year, on track for a second straight annual gain, as the income bondholders pocketed from interest outstripped any drop in prices, according to Bank of America Merrill Lynch’s index. That’s three times the return for Treasuries and compares with a 0.6 percent loss in the corporate-bond market amid a selloff in the riskiest securities in anticipation of higher borrowing costs.

Long-Awaited Move

The Federal Open Market Committee unanimously voted to set the new target range for the federal funds rate at 0.25 percent to 0.5 percent, up from zero to 0.25 percent. The Fed signaled that the pace of subsequent increases will be ”gradual” in a statement on Wednesday. The bond markets have long been preparing for Fed Chair Janet Yellen to raise interest rates from near zero, where they’ve been since the depths of the credit crisis in 2008.

A gradual tightening of monetary policy may be a boon to some segments of the market, if history is a guide. That’s because long-term rates often fall in anticipation of slower economic growth and diminished expectations for inflation, which erodes the value of fixed interest payments. From 2004 to 2006, the last time the Fed was boosting rates, munis maturing in 22 years or more saw annual returns of 6.5 percent, more than triple the gains on securities due in 3 years or less, according to Bank of America’s indexes.


U.S. Bancorp., USAA Investment Management Co., Barclays Plc and Citigroup Inc. are all projecting a so-called flattening of the municipal yield curve, or a narrowing of the gap between short- and long-term rates. When that happens, bonds with longer maturities tend to outperform.

Investors appear to be expecting just that. In the week through Dec. 9, they added $742 million into tax-exempt funds, the most since January, according to Lipper U.S. Fund Flows data. More than $3 billion has flooded into long-term muni funds over the past 10 weeks.

Fiscal Recovery

The influx comes as governments continue to recover from the financial toll of the recession, which led then to pay down debt from 2011 through last year. State tax revenue rose by 6.8 percent in the second quarter from a year earlier, according to the Nelson A. Rockefeller Institute of Government in Albany. A survey by the National League of Cities released in September found that 82 percent said they were better off than a year earlier, the most since at least 1990.

Piper Jaffray Cos. and U.S. Bancorp say the pace of securities offerings will slow next year, while BlackRock Inc. predicts it will be little changed. While Citigroup Inc. projects that issuance will rise to $413 billion from about $397 billion this year, Vikram Rai, the bank’s head of muni strategy in New York, says demand will be strong enough to keep prices in check.

“Demand is strong; issuance is low,” said Peter Hayes, who oversees $111 billion as head of munis at New York-based BlackRock, the world’s biggest money manager. “Our theme for next year is really about maximizing carry, or income, in an environment where rates are fairly benign and don’t rise dramatically.”

This is probably the “most well-advertised rate hike” in Fed history, said Dan Heckman, senior fixed-income strategist at U.S. Bank Wealth Management, which oversees about $130 billion. He sees two to three rate increases coming next year, including one in the first quarter.

“All in all, I think that this is still very muni-positive,” Heckman said Wednesday after the Fed decision.

Bloomberg Business

by Elizabeth Campbell

December 15, 2015 — 9:01 PM PST Updated on December 16, 2015 — 11:48 AM PST


Muni Bonds Backed by Junk Companies Feel Pain of High-Yield Rout.

The corporate junk-bond rout has mostly left few ripples in the $3.7 trillion municipal market, with one exception: Tax-exempt debt issued by the high-yield companies.

Local-government bonds sold on behalf of U.S. Steel Corp., the nation’s second-largest producer, traded Monday at an average of about 67 cents on the dollar, the lowest price since they were issued in November 2009 and down from 113 cents to start the year, data compiled by Bloomberg show. They have a B2 rating from Moody’s Investors Service, five steps below investment grade. Trading in tax-free debt backed by Marathon Oil Corp. jumped to a two-month high on Dec. 11, with prices touching the lowest in nine days even though it has an investment-grade rating.

Fortunately for high-yield muni buyers, corporate-backed credits make up only a sliver of the tax-exempt market. There’s about $7 billion of fixed-rate, non-investment-grade and tax-free industrial-development bonds, Bloomberg data show. By comparison, Puerto Rico has $70 billion of debt outstanding, while states and localities have sold $23 billion of junk-rated tobacco securities, the data show.

“The drop in commodity prices and the plunge in oil has certainly had an impact on several of the corporate credits” in the municipal market, said Jim Colby, who runs the $1.7 billion Market Vectors High Yield Municipal Index exchange-traded fund, the largest of its kind.

Apart from corporate borrowers, “there’s healthy appetite for municipal high-yield,” he said. His fund has returned 3.9 percent this year, compared with a 6.8 percent loss for the largest ETF that invests in junk-rated companies. “There’s still plenty of cash for investment going into the end of this year.”

Individuals have poured money into high-yield muni mutual funds for 10 straight weeks, adding $1.8 billion over the period, Lipper US Fund Flows data show. By contrast, funds focused on junk-rated corporate borrowers saw $3.5 billion of withdrawals in the week through Dec. 9, the most since August 2014, the data show.

Bloomberg Business

by Brian Chappatta

December 14, 2015 — 9:51 AM PST


Puerto Rico Teaches OppenheimerFunds Perils of Hunting for Yield.

Puerto Rico had a strategy over the past decade to paper over its deficits: Issue billions of dollars worth of tax-free municipal bonds.

OppenheimerFunds Inc. had a strategy over the same period to deliver outsized returns to its muni mutual-fund shareholders: Buy billions of dollars worth of the commonwealth’s high-yielding debt.

For both the Caribbean island and the New York-based investment firm, 2015 marked an abrupt change in course. Puerto Rico is locked out of the public markets after its governor said it couldn’t pay all its debts. OppenheimerFunds is starting to see cracks in its long-held strategy of buying bonds that offer high yields. Ten of its 20 muni funds have at least a 15 percent stake in junk-rated Puerto Rico. Nine of those rank in the bottom 10 percent of their peer group this year, according to data compiled by Bloomberg through Dec. 10.

In a year when high-yield muni funds earned the top returns, OppenheimerFunds’s underperformance shows the disconnect between the market for Puerto Rico bonds and the $3.6 trillion of other state and local government securities. The island’s $70 billion of debt offers interest that’s exempt from federal, state and local income taxes, which attracted managers that have funds focused on a single state.

Starkest Examples

The OppenheimerFunds Maryland portfolio is the firm’s starkest example of following that strategy, with a 43 percent allocation to Puerto Rico securities, according to Morningstar Inc. data. It has trailed 94 percent of peers this year, Bloomberg data show. The firm’s Virginia fund is the next-most-concentrated, with a 37 percent stake in commonwealth debt. It has lost 2.65 percent in 2015, the worst of any muni mutual fund, even though it pays the second-highest dividend yield.

The only fund with a greater exposure to Puerto Rico than those two is the Franklin Double Tax-Free Income Fund, which buys territory debt, according to Morningstar. It has declined 2.1 percent this year.

“In bond funds, the total return is mostly driven by yield,” said Beth Foos, an analyst at Morningstar in Chicago. “But investors really have to pay attention to the portfolio and the makeup of the funds, because when you’re getting a higher yield for a particular security, there’s a reason why.”

Taking Risks

Meredith Richard, a spokeswoman in New York for OppenheimerFunds, said the company had no comment on its performance this year.

OppenheimerFunds has a “Puerto Rico Roundup” section of its website that provides the firm’s latest thoughts on the island’s fiscal crisis. The last post came on Dec. 11. It discussed a bill proposed last week by Senators Chuck Grassley, Orrin Hatch and Lisa Murkowski that would assist the commonwealth, as well as the Supreme Court’s decision to rule on the constitutionality of the island’s Recovery Act.

“We have seen the Puerto Rico securities held by our funds deliver highly competitive levels of tax-free income and what we believe to be high value relative to the risk they incur,” the website says. “We hope our shareholders have seen this, too.”

Speculative Investments

Out of 602 open-end muni mutual funds tracked by Bloomberg, OppenheimerFunds has seven of the 10 highest-yielding offerings. That’s because over the years, in addition to taking on Puerto Rico securities, the firm’s money managers have invested in airline-backed debt, small private colleges, tobacco bonds and real-estate development deals, all of which feature speculative qualities.

The strategy has often paid off because their funds pay out more interest than their competitors, padding returns. The $2.1 billion Oppenheimer Rochester AMT-Free Municipals Fund, with a yield that’s over 1 percentage point higher than any other peer, has ranked in the top 10 percent returns among peers over a one-, three- and five-year period, Bloomberg data show.

That used to be the norm across its suite of funds. Yet the $5.6 billion Oppenheimer Rochester Fund Municipals portfolio, with the third-highest dividend of any open-end muni offering, returned in the bottom 10 percent of comparable funds in the past one- and three-year stretches, the data show.

Only Segment

The difference between the two funds? The former has an 11 percent allocation to Puerto Rico, according to Morningstar. The latter has a 21.4 percent stake.

Puerto Rico bonds have plunged 7.3 percent this year, the only segment of the municipal market to lose money in 2015, according to Standard & Poor’s Dow Jones Indices data. And it might not get immediately better for investors in the coming months as the island veers closer to a restructuring of its debt.

“It’s hard to assume much in the way of positive price surprises in the near-term for any Puerto Rico securities,” Matt Fabian and Lisa Washburn at Concord, Massachusetts-based research firm Municipal Market Analytics wrote in a Dec. 7 report.


Puerto Rico bonds may have room to rally as the island’s path to restructuring becomes clearer. Some securities have been trading at dollar prices lower than the recovery rates assumed by Moody’s Investors Service. Any gain would be a boon to investors currently putting money into OppenheimerFunds’s muni offerings.

Puerto Rico Electric Power Authority securities reached the highest price since June 2014 after some investors agreed to take losses of 15 percent. Tax-exempt debt due in July 2017, which fell to 49.7 cents in July, climbed to 68.5 cents in November. OppenheimerFunds is the largest holder of the bonds, Bloomberg data show.

January Payments

Shareholders don’t appear to be waiting for a rebound. They’ve yanked almost $3 billion from the company’s 20 muni funds in 2015 through Nov. 30, according to Bloomberg data, which analyzes the change of assets net of performance. That outflow represents 11.4 percent of the $26.2 billion they had to start the year. Muni mutual funds as a whole have added $10.6 billion in 2015, Lipper US Fund Flows data show.

The firm’s three muni funds with the least exposure to Puerto Rico, however, saw net inflows through the first 11 months of the year, Bloomberg data show.

The commonwealth faces $958 million of bond payments in January that it may fail to make, even after the unprecedented step of clawing back revenue from some debt to pay general obligations. Add to that squabbling among lawmakers in San Juan and Washington about the best path to resolve the crisis, and it follows that fund flows show individuals are leery about investing in Puerto Rico.

“Holders not prepared for strange doings, confusion, and political interference should not still be holding Puerto Rico securities,” MMA’s Fabian and Washburn wrote.

Bloomberg Business

by Brian Chappatta

December 13, 2015 — 9:00 PM PST Updated on December 14, 2015 — 11:51 AM PST


Kramer Levin: Florida Open for Clean Energy Financing After Court Removes Barrier to PACE Programs.

In an Oct. 15 opinion, the Florida Supreme Court rejected a challenge to property-assessed clean energy (“PACE”) programs, which provide upfront financing to residential and commercial property owners that allows them to use green energy technology to improve their properties. The decision continues the trend of an increasingly friendly environment for clean energy producers and providers — as well as the investment funds that back them.

The decision is a victory for both the renewable energy industry and municipalities in Florida, as it should help expand the use of such programs across the state. Residential PACE programs — which surpassed their commercial counterparts in 2014 — represent a tremendous growth opportunity for financing activity. The ruling confirms Florida as the 30th state in the U.S. to authorize PACE programs, and the state could become the second-largest residential PACE market in the country, behind California. While some areas, including Miami-Dade County, already allowed PACE programs, Broward County and other jurisdictions had suspended implementation of local programs due to the uncertainty caused by the court challenge. In conjunction with the current political and regulatory focus on increasing the use of renewable energy, opportunities in this area are likely to increase now that the court has removed a barrier.

California has led the way on PACE projects to this point. Program administrators retained by counties and other municipal entities have successfully placed a series of rated securitizations of PACE assets. Leading the way has been the HERO program of Renovate America, which has issued five deals in its program. In July, Ygrene Energy Fund also announced a $150 million private securitization transaction to help fund 6,210 energy and water conservation projects in partnership with local municipalities.

In its decision, the Florida Supreme Court ruled against the Florida Bankers Association, saying the group did not have standing to fight the program. The bankers’ group — echoing concerns expressed by federal housing regulators — had argued that PACE loans could negatively affect mortgages should they be paid back before mortgages.

The Florida decision was significant for the future of residential PACE programs in Florida, where they have previously been used only on a limited basis. Combined with the Obama administration’s Clean Power Plan Rule, announced in August, these decisions further contribute to market conditions that are increasingly hospitable to investments in renewable energy projects

The content of this article is intended to provide a general guide to the subject matter. Specialist advice should be sought about your specific circumstances.

Last Updated: December 4 2015

Article by Laurence Pettit

Kramer Levin Naftalis & Frankel LLP


Vanguard's New Venture: Indexing Muni Bonds.

Stable market conditions and client demand signal the right time for the firm to launch the first tax-exempt index open-end mutual fund.

In August 2015, Vanguard launched the market’s first tax-exempt index open-end mutual fund, Vanguard Tax-Exempt Bond Index (VTEAX), which also features an exchange-traded fund share class, Vanguard Tax-Exempt Bond (VTEB).

Muni indexing isn’t a new concept for the firm. Vanguard had filed to launch three new muni index funds several years ago, and representatives argue that it had the mechanics in place to successfully track the indexes at that point. However, Vanguard withdrew the request with the Securities and Exchange Commission in January 2011 amid market turbulence and outflows. Volatile market conditions and a surge of outflows didn’t augur well for a successful muni index fund launch. More recently, however, muni market conditions have stabilized, with investors having returned anew to muni funds in 2014 and early 2015 amid improving issuer fundamentals and receding headline risk. This should allow a newly launched index fund to build assets more quickly and therefore better track its index.

While relatively stable market conditions go a long way toward answering the question of “Why now?”, client demand was also an important factor. Ultimately, Vanguard notes that the launch of Vanguard Tax-Exempt Bond Index was a response to a growing number of requests from clients looking for passive exposure to the muni market. Also, the ETF share class opens up a wider distribution network for investors interested in the strategy.

Run by muni portfolio manager Adam Ferguson, the fund tracks the S&P National AMT-Free Municipal Bond Index, a broad, market-value-weighted index designed to mirror the performance of the investment-grade muni market in the United States. By design, this benchmark focuses on the muni market’s most liquid issuers by requiring a minimum credit rating of BBB- for bonds included in the index and a minimum par amount outstanding, among other factors.

Given the benchmark’s emphasis on larger, more-liquid, high-grade issues and a duration that’s currently running longer than the category norm, Vanguard’s fund will likely be more interest-rate-sensitive than the typical intermediate-term muni fund. Over time, it’s expected that the fund’s duration, a measure of overall interest-rate sensitivity, will land between five and eight years.

Weighing the Options: Muni ETFs

Until the launch of Vanguard’s fund, passive investment options for muni investors consisted exclusively of ETFs with a municipal focus. As of November 2015, 34 muni ETFs appeared in Morningstar’s database. Of these 34 ETFs, 29 were passively managed, while the remaining five were actively managed. Only a handful of these funds offer broad-based coverage of the muni market and have garnered more than $1 billion in assets to date.

The largest of these is iShares National AMT-Free Muni Bond (MUB). Launched in September 2007, this ETF has gathered more than $5.5 billion in assets. Like Vanguard’s muni index offering, MUB tracks the S&P National AMT-Free Municipal Bond Index, providing national exposure to the investment-grade muni space and with an expense ratio of 25 basis points. Although that’s roughly double the fee of VTEB, both are relatively low when compared with most actively managed muni funds. For example, the median expense ratio for no-load shares in the muni-national intermediate Morningstar Category was 57 basis points in 2014.

Since its Sept. 7, 2007, inception, MUB’s average total return of 4.4% per year (through October 2015) carries a modest average annual tracking error of 12 basis points, indicating that the fund is performing as expected. Those results are also competitive when compared with active muni funds: Its since-inception annualized return has topped more than two thirds of actively managed muni funds in the category.

While the Vanguard and iShares funds are broadly similar, there are some initial differences to note. For one, MUB is a much larger fund, with more than $5.5 billion in assets versus VTEB’s roughly $73 million (as of Oct. 31, 2015). In the realm of ETFs, size tends to beget liquidity, as measured by trading volume in an ETF’s shares. Indeed, the iShares ETF is far more liquid than the Vanguard ETF at this point. Also, size also lends itself to broader sampling and thus (in theory) more-efficient tracking. However, it should be noted that VTEB has shown very modest tracking error to date despite its much smaller asset base.

Active or Passive: Things to Consider

Those looking for broad, high-quality exposure to the national investment-grade muni market would be well-served in considering a muni index fund. As with other high-quality index-based strategies, the passive nature of the structure significantly reduces manager risk. At the same time, rock-bottom fees on these strategies can burnish long-term results, especially in the current low-yield environment.

With that, the index’s longer duration and only limited exposure to the more risky segments of the market mean that it will have a different performance profile than funds in the muni-national intermediate category. It will likely be more rate-sensitive than the category and will lag more-aggressive peers, at least on a gross-returns basis, when muni markets are healthy and credit risk is rewarded.

Investors looking for a specific interest-rate risk profile, either shorter or longer than the average muni index, should consider an actively managed strategy tailored to that segment. Active managers typically stick to a defined interest-rate band but can add value by favoring different parts of the yield curve or by identifying mispricings in call risk.

Reasonably priced actively managed strategies are also a good option for those looking for more yield and total return from mid- to low-quality fare and a more credit-intensive approach. That’s particularly true post-credit crisis given the collapse of a number of muni-bond insurers and the shrinking of the AAA segment of the muni market. The combination of thousands of unique debt obligors, ambiguous legal pledges to repay debt, and the lack of timely and consistent disclosure on the part of municipal borrowers can create opportunities for active managers to add value through detailed research and analysis when investing in lower-quality securities. This is particularly true for below-investment-grade muni bonds, as this segment represents just a small portion of the overall municipal market but often offers higher yields for those willing to take on the risk.

Morningstar

By Elizabeth Foos | 12-10-15

About the Author Beth Foos is a senior analyst covering fixed-income strategies on Morningstar’s manager research team.


Baker Administration Introduces 'Modernization' Bill for Municipalities.

NORTH ADAMS, Mass. — Gov. Charlie Baker unveiled a raft of legislative amendments on Monday designed to remove outdated obstacles to efficient local government.

Baker and Lt. Gov. Karen Politio introduced “An Act to Modernize Municipal Finance and Government” after months of meetings with municipal officials across the state. The measure is supported by, among others, the Massachusetts Municipal Association and the Massachusetts Mayors Association.

“As two former local officials, the lieutenant governor and I promised to make partnership with cities and towns a focus and priority of our administration,” said Baker. “We were proud to establish a Community Compact Cabinet and keep our commitment to increase local aid by 75 percent of revenue growth in our first budget, the largest such boost in nearly a decade, and look forward to implementing greater independence and flexibility that empowers our local municipal officials to best serve their communities.”

Surrounded by state and local officials on the Grand Staircase at the State House on Monday afternoon, the state’s elected leaders said the amendments were the result of feedback solicited from hundreds of elected officials and municipal administrators. The Division of Local Services received more than 550 individual responses and more than 1,300 suggestions from over 215 municipalities and 20 regional school districts.

The MMA posted a summary of the legislation here.

Polito had also been querying officials about better ways to partners during her “Building Stronger Communities,” visiting more than 130 municipalities since taking office last year.

“Over the past 11 months, I have traveled across the commonwealth meeting with and listening to local officials as chair of the Community Compact Cabinet,” said Polito. “Signing over 70 commitments to promote best practices at the local level has afforded me the tremendous opportunity to connect with local officials and hear many great ideas that are reflected in this bill, including streamlining state oversight and eliminating obsolete laws.”

According to the administration, four foundational themes for the proposed municipal modernization bill are: eliminating or updating obsolete laws; promoting local independence; streamlining state oversight; and providing municipalities with greater flexibility. It noted some of the laws have not been modified since the early 1900s.

Among the many changes being proposed by the Baker-Polito administration are lifting caps and other limits on the use of municipal funds in procurement and transfers; permit more flexibility in revolving and stabilization funds; allow the use of online postings for contracts; allow local advertising to fall under Open Meeting Law rules rather than bylaws or attorney general approval; allow selectmen, with the approval of a finance committee, to make certain end-of-year transfers rather than calling town meetings to meet the July 15 deadline; let municipalities impose liens for delinquent utility ratepayers in other districts; to combine tax collector and treasurer posts without having to go through a special act; allow the use of 10-year bond anticipation notes; and allow a chief administrator to approve deficit spending for snow and ice accounts.

The bill would also repeal a retiree health cost sharing measure passed in 2010 that allowed municipalities to seek reimbursement from other towns in which its employees had worked. While supported by municipalities, a summary posted by the Massachusetts Municipal Association described the bill “as unworkable in practice.”

It would also change the three-year property evaluation process to five years and reduce state-owned land evaluations from four years to two.

MMA President David Dunford, an Orleans selectman, said the bill “will remove unnecessary and obsolete barriers to efficient government and effective service delivery.”

“These proposals will allow our communities to modernize their management systems, streamline their operations, and move faster than ever to grow our local economies.”

North Adams City Council President Lisa Blackmer, MMA vice president, agreed.

“Taken together, these proposals will allow our communities to modernize their management systems, streamline their operations, and move faster than ever to grow our local economies,” she said. “All of this will make our taxpayers happier, and our state stronger and more competitive than ever.

“I applaud Governor Baker and Lieutenant Governor Polito for building a powerful partnership with cities and towns, and for standing with us to make Massachusetts a model for the rest of the nation.”

iBerkshires

Staff Reports

10:51PM / Monday, December 07, 2015


Student Housing P3s Under Development.

Universities in three states are moving ahead with plans to use public-private partnerships to add to or replace their student housing stock.

The Regents of the University of California approved the UC Merced 2020 project, in mid-November, reported yourcentralvalley.com. The university can now issue a request for proposals to three teams that were shortlisted in January.

UC Merced 2020 will be the university system’s largest design-build-finance-operate-maintain (DBFOM) P3 and the first U.S. educational DBFOM that includes availability payments, reported Infrastructure Investor (paywall).

The developer will build academic, administrative, research, recreational, student residence and service buildings on a 219-acre, university-owned site and 136 undeveloped acres to allow the university to meet its goal of increasing enrollment from 6,600 to 10,000 students by 2020.

The university expects to receive proposals in 2016 and have construction begin in 2018.

Louisiana State University has shortlisted two teams to develop two new residence halls and related amenities on a 28-acre site on its main campus in Baton Rouge, the university announced Dec. 2.

American Campus Communities is competing with RISE Real Estate for the project, which attracted 10 bidders. The Nicholson Gateway Development Project will provide 1,670 beds, lounge spaces, study areas, community gathering areas, retail food service and up to 50,000 square feet of retail space on a former stadium site. The university expects to select the developer in spring 2016.

Eastern Kentucky University has selected a development team consisting of Grand Campus Properties and F2 Companies, a construction firm to build two residence halls on its Richmond campus. This will be the university’s first P3, reported KyForward.

The $75 million, 1,100-bed dorms will open in fall 2017, if the state General Assembly, which must approve all projects that cost more than $600,000, authorizes it, reported the Lexington Herald-Leader on Dec. 2.

By NCPPP

December 10, 2015


S&P’s Public Finance Podcast (Rating Activity For the Week Slows as 2015 Winds Down)

In this week’s segment of Extra Credit, Senior Director Dave Hitchcock explains our recent outlook revision on Massachusetts, and Directors Helen Samuelson and Nick Waugh discuss our rating changes affecting the City of Chicago Sales Tax Revenue Bonds and Boston University, respectively.

Listen to the podcast.

Dec. 4, 2015


S&P: Fixing America's Surface Transportation Act's Passage Does Not Affect Grant Anticipation Vehicle Revenue Debt Ratings.

NEW YORK (Standard & Poor’s) Dec. 8, 2015–Standard & Poor’s Ratings Services today said that its ratings on 25 issuers in the grant anticipation revenue vehicle (GARVEE) sector are unaffected by the enactment of Fixing America’s Surface Transportation (FAST) Act, which President Barack Obama signed into law Dec. 4, hours before previous funding was set to expire. However, we believe FAST generally supports the sector’s credit quality, due to a longer period of funding certainty and the increased funding levels that the Act provides. Funded mainly by gasoline and diesel fuel taxes deposited in the Highway Trust Fund (HTF) and $70 billion from various sources within the general fund, the five-year, $305 billion dollar transportation reauthorization act marks the first long-term solution for highway and transit funding since 2005.

FAST replaces the Moving Ahead for Progress in the 21st Century, which was enacted in 2012 but provided funding for just slightly more than two years, and was extended several times for a few months, or even weeks at a time, as Congress debated various bill components. The Act covers funding through fiscal 2020 (year ended Sept. 30), which we view as preferable compared with what had become commonplace: eleventh-hour short-term extensions. Furthermore, FAST provides a 5.1% increase in highway fund distributions to states for fiscal 2016, and growth rates of 2.1% to 2.4% thereafter. Previous funding growth rates were lower, and until the FAST Act, Standard & Poor’s had cited federal budget deficits as a concern affecting highway funding levels. Overall, the FAST Act authorizes $230 billion for highways, $60 billion for public transportation, $10 billion for passenger rail, and $5 billion for highway safety programs. This is an approximately 11% increase from current funding levels over five years.

Standard & Poor’s ratings in the GARVEE sector range from ‘A’ to ‘AA’ for transactions where only federal funding is pledged, and as high as ‘AAA’ where state agencies blend the federal funding with an additional pledge of state funding. We base the relatively strong ratings in the sector on the issuers’ pledge of HTF grants from the federal government.

Overall, we believe, the FAST Act’s signing confirms Standard & Poor’s views of ongoing and widespread Congressional support for preserving and expanding the national highway system. States and local transportation agencies that receive distributions from the HTF can confidently move forward with complex multiyear transportation projects because the questions surrounding federal funding no longer loom. We will continue to monitor the sector to evaluate how each individual state issuer might adjust its debt or capital spending plans, given the new law.

Separate from the impact on GARVEE debt, other provisions of the FAST Act includes 70% in cuts to the Transportation Infrastructure Finance and Innovation Act (TIFIA) program, from $1 billion per year in 2015 and $750 million in 2014 to $275 million-$300 million per year during fiscal years 2016-2020, although the scope of eligible TIFIA projects has been expanded. Furthermore, FAST provides $6.2 billion for a new national freight program, and increases funding for public transportation to $12.6 billion in 2020 from $10.7 billion in 2015.

We have determined, based solely on the developments described herein, that no rating actions are currently warranted. Only a rating committee may determine a rating action and, as these developments were not viewed as material to the ratings, neither they nor this report were reviewed by a rating committee.

Standard & Poor’s Ratings Services, part of McGraw Hill Financial (NYSE: MHFI), is the world’s leading provider of independent credit risk research and benchmarks. We publish more than a million credit ratings on debt issued by sovereign, municipal, corporate and financial sector entities. With over 1,400 credit analysts in 26 countries, and more than 150 years’ experience of assessing credit risk, we offer a unique combination of global coverage and local insight. Our research and opinions about relative credit risk provide market participants with information and independent benchmarks that help to support the growth of transparent, liquid debt markets worldwide.

Primary Credit Analyst: Peter V Murphy, New York (1) 212-438-2065;
[email protected]

Secondary Contacts: Mary Ellen E Wriedt, San Francisco (1) 415-371-5027;
[email protected]

Geoffrey E Buswick, Boston (1) 617-530-8311;
[email protected]

Research Assistant: Maegan Hearney, New York


Pension Funds: Diversity Rocks.

Two pension funds this week announced they were diversifying — albeit in quite different ways. The Oregon Investment Council this week announced it is taking steps to reduce the reliance of the state’s biggest pension fund on the stock market. It will invest $900 million in so-called alternative investments including timber and infrastructure, which are industries that are somewhat detached from the nation’s economic swings. More than half of the money is going into a private equity fund called KKR Americas Fund XII L.P. The Oregon Public Employees Retirement Fund has invested in funds managed by Kohlberg Kravis Roberts & Co. since 1981 and over that time they have generated average annual profits of 18 percent for Oregon.

Meanwhile in Texas, the $3 billion Dallas Employees’ Retirement Fund announced it wants more ethnic and gender diversity among its fund managers because such diversity typically drives up returns on investments. According to Asset International, nearly 90 percent of senior money managers in the U.S. are white and most of them are men, however. Meanwhile, small or new investment firms tend to include more minorities and women. The Dalles fund said this week it will now allocate 10 percent of its portfolio to new investment managers with strong performance records. It is already on its way to achieving that goal and the fund is now launching its Next Generation Manager program to generate interest more among women and minorities who may not have considered such careers and who otherwise wouldn’t get access to major investment opportunities.

Dallas isn’t the only pension fund seeking a tryout period with smaller fund managers in an effort to increase diversity — CalPERS also has an emerging managers program where it seeks out well-performing managers from small firms to handle a small — $20 million, for example — initial investment. If the manager performs well, the pension fund is likely to extend the relationship.

GOVERNING.COM

BY LIZ FARMER | DECEMBER 11, 2015


Is 'Fair Value' Accounting Actually Fair?

The practice is loved by government accountants and scorned by bankers and investors.

On Oct. 8, 2008, investors were desperate to understand why stocks were cratering and banks had quit lending. It was the height of the financial crisis. That day William Isaac, a former chair of the Federal Deposit Insurance Corporation, went on television and blamed an unlikely culprit: bankers’ accountants. “The Securities and Exchange Commission has destroyed $500 billion of bank capital by its senseless marking to market of these assets for which there is no marking to market,” he said. “That has destroyed $5 trillion of bank lending.” In other words, accounting rules enforced by the federal government were at the heart of the then-unfolding financial catastrophe. Many bankers and investors shared Isaac’s view.

By contrast, government accountants, led by the Governmental Accounting Standards Board (GASB), have embraced these same rules — known as “fair value” accounting — with the same enthusiasm that bankers’ and investors’ accountants have scorned them. In fact, during the past three years the people who write accounting standards for states and localities have made fair value a key factor in how governments manage their pensions, investments and retiree health care. Strange as it might sound, that’s a good thing.

How could fair value be deemed unfair by some and fair by others? It’s all in the eye of the beholder. If you ask an accountant what something is worth, you’ll get one of two answers. The usual one is “whatever you paid for it.” If a local government purchased a piece of land 10 years ago for $1 million, the fair value of that land is $1 million. Accountants call this “historical cost.”

But what if a developer really wants that land and is willing to pay three times the original purchase price? Is that a fair market value? The accountant’s answer would be no. Until someone actually pays that price, it’s just a guess. That’s why accountants are credible. They deal in real numbers.

Of course, sometimes the real and the hypothetical converge. For instance, the prices of stocks offered on the New York Stock Exchange are updated every second. Those prices are technically estimates, but they’re based on millions of real transactions. That’s why accountants are comfortable equating a stock’s offered price to its fair value. The same applies to other types of investments that can be “marked to market” because they’re bought and sold in an active market.

Banks and other financial institutions mark their investments to market constantly. That’s great when market prices are up. If markets run dry, however, as they did during the financial crisis, the damage is obvious and immediate. That can shake investor confidence. That’s also why in the throes of the crisis, the finance industry put enormous pressure on the Securities and Exchange Commission to suspend mark to market accounting. The better approach, they argued, was to report fair market values averaged over time to better reflect “normal” market conditions. Regulators almost capitulated then — but didn’t. Now they’re reconsidering.

GASB, by contrast, has upped its own fair value ante. In its new standards on pension liabilities, it restricted governments’ ability to “smooth” the fair value of their investments. That is, to report the average value of pension investments over time, rather than a specific point in time. With interest rates low and the stock market volatile, those investments have not performed well, and that could mean higher pension funding costs and less certainty when budgeting for those costs. GASB’s new standards on other post-employment benefits like retiree health care could have the same effect. The accounting group also broadened its own fair value framework for governments.

Many of GASB’s most important stakeholders have disagreed with its interpretation of fair value. That said, there’s no question that they’ve applied that definition clearly and consistently. Put differently, they have resisted the temptation to politicize this arcane but crucial corner of accounting. That’s bringing some badly needed fairness to fair value.

GOVERNING.COM

BY JUSTIN MARLOWE | DECEMBER 2015


Public Pensions Challenge Private Equity Fees.

Late last month, California disclosed for the first time how much its pension system paid private equity managers in performance fees: $3.4 billion over the past 25 years. The fees, which are in addition to typical managerial fees, have come under scrutiny in recent years — and not without reason.

The California Public Employees Retirement System (CalPERS) said the fees were based on $24.2 billion in profits earned from investments in private equity funds. Performance fees, which are unique to so-called alternative investments, have been poorly reported — if at all — by pension plans. But as calls for financial transparency in all areas of government intensifies, that’s starting to change.

Unlike stock market investments, pensions enter into a separate contract with each private equity fund manager. There is no standardization of those contracts or the fees charged. What’s more, it’s time consuming for a pension plan to flesh out how much they’re paying in so-called profit sharing payments, which are essentially a cut of the earnings private equity managers take off the return on investment.

Now, CalPERS and a handful of other plans are calling for private equity managers to conform to proposed industry-wide disclosure standards. It could give investors more of a bargaining chip with private equity managers. As it stands, pension plans are unable to easily compare how expensive their managers are. “Public plans need to be able to very plainly disclose this information at a plan level for their beneficiaries, stakeholders and policymakers,” said Lorelei Graye, founder of the consulting firm Leodoran Financial. “Eliminating the opaqueness eliminates the controversy and fear of unknown or hidden costs.”

CalPERS, the South Carolina Retirement System Investment Commission and the Washington State Investment Board, among other private equity investors, are backing a proposed fee-reporting template. Notably, the template would require managers to make clear the performance fees they are taking off the top of investment returns. Designed by the Institutional Limited Partners Association (ILPA), the final template will likely be released in January.

A big reason fees have remained largely undisclosed is that private equity funds as an asset class are secretive about how they generate their returns and charge for their work. Pension plans invest as one of many limited partners in a fund, and the fund manager buys, builds up and sells entities — like companies — at their own discretion. Typical managerial fees for private equity managers are 2 percent of the total investment; profit-sharing fees are typically 20 percent of the earnings. By comparison, most other asset classes have managerial fees under 2 percent and no additional profit-sharing agreements.

Pension systems like private equity funds because, unlike public funds that are tied to the stock market, the success of private equity funds are detached from economic booms and busts. Instead, success hinges on the manager. In other words, it’s up to pension plan investment officers to judge the manager’s performance and whether their strategy fits into their broader portfolio. In their view, the higher fees for managers are justified because private equity funds have generated higher returns.

Critics, however, point out that private equity performance is only a little better than stock market performance. That’s been the case in Kentucky where the system’s private equity investments have performed about a half-percent better than the S&P average over the past five years, according to David Peden, the system’s chief investment officer. Over the past decade, the plan’s private equity has performed slightly under the stock market. Peden, who said Kentucky is “very excited to adopt whatever standards are developed” by ILPA, said the past few years of an outperforming stock market has skewed the picture. “At whatever point that spread narrows and it doesn’t make sense anymore, then we won’t invest in it,” he said.

Another problem, according to critics, is that pension systems aren’t exactly sure how much they’ve paid in total private equity fees. CalPERS isn’t the first plan to start sniffing around: Kentucky and South Carolina’s plans have hired outside consultants in recent years to investigate the performance of the investments and the performance fees.

While the consultants’ reports have revealed more about the market for pensions, it’s also led to increased criticism. Pressure has also been building at the federal level ever since the Securities and Exchange Commission released a report last year finding that half of the 400 private equity funds they analyzed charged investors bogus fees.

More than supporting ILPA’s proposal, CalPERS has already adopted it, requiring its managers to conform to the template. That could ding CalPERS in the short term, said Graye, as private equity managers may simply choose not to work with the fund. That’s why, she added, it is important to watch who adopts the final ILPA standards next year. “It’s a bigger deal than some people realize,” she said of CalPERS’ early move. “But that’s leadership and if enough limited partners [investors] push for these disclosures, the managers will come back. Collectively, the limited partners are going to shape this industry.”

GOVERNING.COM

BY LIZ FARMER | DECEMBER 10, 2015


Muni Buyers Plow Into Long Bonds to Win Once Fed Increases Rates.

Municipal-bond investors are snapping up the longest-maturing tax-exempt debt as the Federal Reserve prepares to raise interest rates, even though yields signal it’s the worst time to do so in almost three years.

That’s because if history is any guide, the securities will be the best performers in the $3.7 trillion market when the Fed tightens monetary policy, a move it may take next week after seven years of holding borrowing costs near zero.

The buying spree pushed the extra yield buyers pick up for holding 10-year debt instead of two-year securities to as little as 1.34 percentage points on Monday, near the lowest since January 2013, according to data compiled by Bloomberg. The shift shows how investors are positioning to gain from higher interest rates, which are typically a drag on returns in the fixed-income market.


The suppressed interest rates on the longest-maturing bonds are also a boon to states and cities because they usually finance infrastructure projects with debt that doesn’t come due for decades. They sell short-term securities mostly for cash-flow needs, which have declined as their finances recovered from the recession.

When the Fed last boosted interest rates from 2004 through 2006, munis maturing in 22 years or more delivered annual returns of 6.5 percent, more than triple the gains on securities due in 3 years or less, according to Bank of America Merrill Lynch indexes.

The market is primed for a repeat, according to John Dillon, managing director at Morgan Stanley Wealth Management in Purchase, New York. Analysts at Janney Montgomery Scott and RBC Capital Markets are predicting the same.

“My expectation is that you do see out-performance on the mid-part of the curve to the back-end of the curve,” Dillon said in a telephone interview. “You could get a lot more flattening of the muni curve as we go forward.”

Investors agree. They’ve poured $3.1 billion into long-term muni mutual funds over the course of nine weeks, the longest stretch of inflows in at least a year, Lipper US Fund Flows data show.

Muni buyers have been projecting that longer-dated bonds would fare well once the Fed starts raising short-term rates, with the securities seen as the best positioned to remain stable or gain because of subdued inflation expectations over the next year. There’s a 78 percent chance the Fed will raise its benchmark at its Dec. 15-16 meeting, according to futures data compiled by Bloomberg.

Risk and Reward

Investors usually demand greater yields to own bonds that mature far in the future because of the risk that inflation will erode the value of fixed interest payments. When buyers are confident that inflation won’t pick up, they can capture more yield by extending the maturity of their holdings.

Prices are expected to hold relatively stable: the Fed expects inflation of 1.7 percent next year, according forecasts released in September, less than the 2 percent rate that it targets.

“The risk-reward calculation when you extend duration at this point indicates that people are getting paid for moving out on the curve,” said Chris Mauro, head of muni strategy at RBC in New York. “There doesn’t seem to be a lot of pressure on the longer end of the curve right now given the economic backdrop.”

Benchmark 30-year muni yields touched 3.02 percent last week, the lowest since April and down 0.23 percentage points over a two-week span, Bloomberg data show. By contrast, two-year yields have jumped to the highest since June 2013. That has narrowed the difference between the two to 2.3 percentage points, a 10-month low.

Over the past four weeks, investors have added $1.8 billion to muni mutual funds as the central bank assures markets that the pace of increases will be gradual, the Lipper data show. That suggests investors are less concerned about the impact of a rate increase then they were in September, when they yanked $1.4 billion from the funds in the four weeks leading up to the Fed’s decision.

“Investors should feel comfortable moving out on the yield curve: Long-term rates aren’t going to go shooting up just because the Fed is hiking short-term rates,” said Alan Schankel, a managing director at Janney Montgomery Scott in Philadelphia. “That’s based on a lethargic economic growth scenario and a lack of inflationary concerns.”

Bloomberg Business

by Brian Chappatta

December 7, 2015 — 9:01 PM PST Updated on December 8, 2015 — 7:51 AM PST


Hedge Funds Leave U.S. Pensions With Little to Show for the Fees.

Here’s what U.S. state and city pension funds are getting this year for the hundreds of millions of dollars in fees they’re forking over to hedge funds: almost nothing.

The investment pools gained 0.4 percent through November, putting them on pace for the worst year since 2011, according to data compiled by Bloomberg. The industry’s struggle was underscored over the past two months as BlackRock Inc., Fortress Investment Group and Bain Capital closed hedge funds after running up losses.

The low returns are dealing a setback to governments that boosted exposure to hedge funds, seeking windfalls to help close a $1.4 trillion shortfall that’s facing public-employee retirement systems nationwide. The investment funds have underperformed stocks since 2008 as share prices rallied and volatility whipsawed global financial markets.

“The bull market of the last six years allowed public pension plans to become poor consumers,” said South Carolina Treasurer Curtis Loftis, who has criticized the fees his state has paid firms including hedge funds. “The plans viewed hedge funds as an ‘elite investment’ and therefore neglected to perform strenuous and ongoing due diligence.”

Public pensions count on investment returns of more than 7 percent a year, so anything less puts pressure on governments to set aside more to ensure they can cover all the benefits promised to employees. The retirement systems boosted their stakes in hedge funds to $184 billion this year from $94 billion in 2011, according to Preqin, which tracks the industry.


With their investments faltering, funds with more than $16 billion of assets have announced plans to shut down this year, including those run by some of Wall Street’s most well-known firms, according to data compiled by Bloomberg. BlackRock decided to close its Global Ascent hedge fund following losses that triggered withdrawals by investors including the Arizona Public Safety Personnel Retirement System, Fort Worth Employees’ Retirement Fund and the Maryland State Retirement and Pension System.

The Arizona fund doesn’t discuss investment decisions, said Christian Palmer, its spokesman. Michael Golden, a spokesman for the Maryland system, and Mary Kay Glass, a spokeswoman for the Fort Worth system, declined to comment.

Averting Bigger Losses

The hedge fund investments have sheltered some retirement plans from steeper losses during the swings in stock and bond prices this year.

New York City’s civil employees pension, with $52 billion of assets, saw its hedge funds lose 0.7 percent through September, which was less than the 2.26 percent loss for its entire portfolio. For New Jersey, hedge funds posted a 1.7 percent gain during the first nine months of the year, limiting the pension’s losses, though they’ve posted about half the returns of its equity investments over the past five years.

“Over the long term, which is what we invest for, hedge funds have significantly outperformed stocks and bonds,” Christopher Santarelli, spokesman for the New Jersey Treasury Department, said in an e-mail.

Not all pensions think it’s worth it. The California Public Employees’ Retirement System, the U.S.’s largest public pension, said last year it would liquidate its $4 billion hedge-fund portfolio because of the cost and complexity. Sam Won, managing director of Global Risk Management Advisors, said some pensions have used the lackluster returns to push for lower fees and more information about investment strategies.

“It continues to give investors more leverage,” said Won.

The Cost

The firms typically charge investment fees of 2 percent and keep 20 percent of the gains. They’re free to pursue strategies aimed at profiting even when stock or bond prices drop, allowing them to deliver gains to investors or protect them from losses elsewhere. In 2008, during the worst of the credit-market crisis, when the Standard & Poor’s 500 Index tumbled 38 percent, hedge funds lost about half as much.

Since then, the investments have left some pension money lagging the broader markets as stock prices rallied, according to Jeff Hooke, a managing director with Focus Investment Banking in Washington. His study of five state pensions over five years found that the median return on hedge-fund investments was 7.3 percent, more than 6 percentage points less than the benchmark Vanguard Balanced Index Fund.

“Hedge funds have cost the states tens of billions in opportunity costs the last five years,” said Hooke.
U.S. public pensions, after years of chronic under funding, by 2014 had 74 percent of the assets needed to pay retirees, according to the Center for Retirement Research at Boston College. Illinois and the state’s largest city, Chicago, are both contending soaring bills to retirement systems after years of failing to make sufficient contributions. Such pressure helped push Detroit into the biggest municipal bankruptcy in U.S. history in 2013.

“Public pension funds are trying to achieve very high returns in an environment that makes this difficult,” said Donald Boyd, senior fellow at the Nelson A. Rockefeller Institute of Government, a public policy research arm of the State University of New York. “If they’re not successful, taxpayers and those who count on government services and investments will pay the price.”

Bloomberg Business

by Darrell Preston

December 8, 2015 — 9:01 PM PST Updated on December 9, 2015 — 6:03 AM PST


Return to Friendly Skies Keeping Buyers Bullish on Airport Bonds.

Bondholders such as Nuveen Asset Management are some of the biggest beneficiaries of the resurgence in air travel among U.S. consumers, and they don’t see an end in sight.

Debt issued to fund airport improvements are outperforming the broader $3.7 trillion municipal-bond market for an unprecedented fifth consecutive year. That’s likely to continue because the bonds have dedicated revenue streams and they still offer higher returns than top-ranked municipals, said John Miller, Nuveen’s co-head of fixed income in Chicago. He said he’s looking to buy more.

With the U.S. economy growing by about 2.5 percent in 2016, airlines will see enplanements, or the number of passengers arriving or departing at airports, rise by 4 percent, according to Moody’s Investors Service. The credit-rating company expects airports to exceed their budgeted growth and a few to win positive changes to their ratings or outlooks this year, said Earl Heffintrayer, a Moody’s analyst in New York.

“There is still a need in the marketplace to have that additional spread and that additional yield without an enormous amount of credit risk,” said Miller, whose company oversees about $100 billion in munis.

Securities in the Standard & Poor’s Municipal Bond Airport index are yielding 2.33 percent, compared with 1.98 percent for bonds in the national investment-grade index, according to J.R. Rieger, vice president of fixed-income indexes at S&P in New York. In October, the gap in the yield between the two indexes was 0.26 percentage point.

This year has been a good one for airports already: enplanements have increased by almost 5 percent, which was more than the 4 percent expected by Moody’s. Enplanements are key since they drive a range of cash-generating avenues from parking fees to beer sales at the terminal bars.

It’s been a good year for bondholders too. Airport debt has gained 3.5 percent through Dec. 8, beating the market’s 3 percent advance, Bank of America Merrill Lynch data show. A fifth straight year of outperformance would be the longest streak since the firm began tracking the data in 1993.

Issuance has been “subdued” and should remain so in 2016 apart from projects such as the replacement of the terminal at New York’s LaGuardia Airport, Miller said. Airports this year have issued $8.2 billion in securities, up from last year’s $7.2 billion, but are unlikely to reach the tally of $10.7 billion seen in 2012, data compiled by Bloomberg show.

Moody’s median rating for airport bonds is A2, four steps lower than the median Aa1 grade for U.S. states. Airports with higher grades serve a vital purpose in large markets, while lower-ranked ones face more competition, Heffintrayer said.

Jet Fuel

Fuel costs comprise “an important component” for airport bonds to outperform the overall market next year, said Alan Schankel, a Janney managing director in Philadelphia. The price of jet fuel declining by 44 percent since 2011 has helped support the airlines’ profitability, and consumers saving on gas for their cars have more money to spend on travel, he said.

Lower fuel costs prompted airlines to add more seats this year, and airports in Fort Lauderdale and San Diego were among the fastest growing as tourists passed through them, Heffintrayer said.

“We should continue to see strong performance across the board and especially in those regions that are more tourism dependent,” he said.

Although travelers from overseas may decline due to weakening economies in China, Latin America and Europe, U.S. passengers should compensate for that, Moody’s said.

Nashville Sale

An example of a medium-sized U.S. airport that has seen a “tremendous amount of growth” partly due to tourism is Tennessee’s Nashville International Airport, Heffintrayer said.

Investors have noticed. Tax-free 10-year revenue bonds sold Tuesday by the authority running the airport were priced to yield 2.31 percent, 0.29 percentage point over top-ranked munis. That’s lower than the 2.55 percent for similarly rated revenue debt. Moody’s and S&P gave the securities the fifth-highest rank, A1 and A+ respectively.

Metropolitan Nashville Airport Authority received $1.1 billion in orders for $200 million in bonds, said Lauren Lowe, director at the agency’s financial adviser PFM Group.

The airport expects enplanements in 2016 to rise by 5 percent from the previous year, following an annual growth of 4.4 percent over the past five years, according to bond documents.

The bond deal “showed a lot of investor confidence in this market and in what we’re doing here at the airport and in our future growth,” said Robert Wigington, president and chief executive officer of the authority.

Bloomberg Business

by Romy Varghese

December 9, 2015 — 9:02 PM PST Updated on December 10, 2015 — 4:54 AM PST


Muni Inflows Are Highest Since January as Buyers Ignore Fed.

Investors added the most money to municipal-bond mutual funds since January in the past week, a sign that they’re not fretting about the Federal Reserve raising interest rates for the first time in almost a decade.
Individuals poured $742 million into tax-exempt funds in the week through Wednesday, Lipper US Fund Flows data show, marking the 10th straight week of inflows. Those investing in long-term and intermediate-term securities received cash, as did high-yield funds.

Benchmark 30-year munis yield 3 percent, the lowest level since April, data compiled by Bloomberg show. Investors are betting that if the Fed tightens monetary policy at its Dec. 15-16 meeting, the longest-maturing tax-exempt debt will fare the best.

Munis have returned 3.2 percent this year, compared with 1 percent for Treasuries and no gain for investment-grade corporate securities, Bank of America Merrill Lynch data show.

Bloomberg Business

by Brian Chappatta

December 10, 2015 — 3:00 PM PST Updated on December 11, 2015 — 6:17 AM PST


Fitch: U.S. Airport Credits Remain Strong; Traffic to Expand.

Fitch Ratings-New York-09 December 2015: U.S. airports ratings remain largely in the ‘A’ category with passenger traffic volume growth supporting stable financial profiles for most U.S. airports despite the ongoing capital program needs in the sector, according to a new Fitch Ratings report.

‘Approximately 90% of airport sector ratings currently have Stable Outlooks, demonstrating the relatively low credit risk and the resilience of airport cash flows,’ said Seth Lehman, Senior Director in Fitch’s Global Infrastructure Group.

Fitch upgraded the rating on two airports during the past 12 months (San Jose to ‘A-‘ and Commonwealth of Northern Marianna Islands to ‘B+’) as well as revised the Rating Outlook on six airports to Positive (including large-hubs Chicago O’Hare Airport and Hillsborough County Airport Authority/Tampa Airport).

Highest rated airports are typically those with a strong underlying market or franchise driving demand, overall stability of cash flows through contractual agreements with airlines and other commercial users and healthy financial metrics. Conversely, weakest rated airports include those serving small markets or secondary airports subject to competition for passengers, or thinner financial metrics and elevated leverage.

The report ‘Peer Review of U.S. Airports’ is available at ‘www.fitchratings.com’.

Contact:

Seth Lehman
Senior Director
+1-212-908-0755
Fitch Ratings, Inc.
33 Whitehall Street
New York, NY 10004

Jeffrey Lack
Director
+1-312-368-3171

Emma Griffith
Director
+1-212-908-9124

Media Relations: Sandro Scenga, New York, Tel: +1 212-908-0278, Email: [email protected].

Additional information is available at ‘www.fitchratings.com’.


From the Makers of Catastrophe Bonds, a New ‘Resilience Bond’.

Some of the people who brought you “catastrophe bonds” now want to bring you “resilience bonds.”

“Cat bonds” are securities that help insurers or an entity such as a municipal transportation authority pay for claims after a hurricane or other catastrophe. Amid protracted low interest rates, many U.S. and Canadian pension funds have been scooping up these securities because they yield more than conventional bonds while also offering diversification—though a massive catastrophe could wipe out their principal.

Now, some of the brains behind cat bonds, which have been around since the late 1990s, are pioneering a variation of this security. Among developers of this new resilience bond are big European reinsurance powerhouse Swiss Re SSREY -1.10% and RMS, a leading catastrophe risk-management and modeling firm. They are well-known names in the cat-bond world.

The idea is that resilience bonds would appeal to, say, flood-prone cities, public utilities and other entities that need to build infrastructure like seawalls and flood barriers, RMS said in an announcement this morning. RMS is working with Swiss Re, the Rockefeller Foundation and design firm re:focus partners on the new framework.

Multiyear resilience bonds could provide money for property-damage claims should a big disaster strike while the infrastructure project is under construction. In that way, resilience bonds would serve as insurance as cat bonds do—and might reduce dependence on disaster aid.

But unlike ordinary cat bonds, they could provide “resilience” rebates. While many details remain to be determined, the rebates would reflect the reduction in risk that occurs as seawalls or flood barriers begin to provide protection.

About $22 billion of cat bonds were outstanding as of mid-year, according to Marsh & McLennan Cos.MMC -2.00%’ Guy Carpenter reinsurance unit.

Cat bonds, which typically are in place for three to five years, originally were developed to provide insurance companies with an alternative to traditional reinsurance, but have increasingly been used by public or quasi-public entities to augment traditional insurance or reinsurance, according to RMS and its partners in the resilience-bond effort.

Among those with cat-bond programs are railroad Amtrak, New York Metropolitan Transportation Authority, the California Earthquake Authority, and state-run insurance pools in Florida, Louisiana, Massachusetts and Texas.

Aon Securities said cat-bond issuance reached $7 billion in the 12 months to June 30, a decrease of the prior-year record of $9.4 billion, “yet still the third highest annual issuance in the sector’s history.” Mostly, the bonds relate to possible catastrophes in the U.S., though some expose buyers to risks in Japan and Europe.

THE WALL STREET JOURNAL

By LESLIE SCISM

Dec 9, 2015


South Carolina Port Authority Eyes Pension Funds to Finance Expansion.

South Carolina’s Port Authority is courting pension funds and other institutional investors to help pay for billions of dollars in infrastructure improvements as traditional sources of financing dry up.

The authority has announced plans to spend $1 billion over the next four years on expansions and improvements to ports throughout the state, and is embarking on a $5 billion joint venture with the Georgia Ports Authority to build a terminal along the Savannah River.

Past projects were financed by issuing municipal bonds, including a $290 million sale in November. But the port has effectively maxed out its ability to borrow, requiring new sources of funding, said Jim Newsome, the port authority’s chief executive. The port has hired BMO Capital Markets as advisors and has met with pension funds in several states as well as Canada.

“There’s just not enough public sector debt available to fund all the infrastructure and terminal improvements we need,” Mr. Newsome said in an interview.

South Carolina’s ports need to grow to handle growing volumes of containers and other cargo, and to accommodate larger ships from Asia expected to arrive after the Panama Canal completes an expansion next year. Ports along the East Coast are competing for the same business, stretching their finances to dredge deeper harbors, raise bridges and build new terminals.

“A lot of these issuers have good balance sheets, but not enough cash on hand” for large infrastructure projects, said Emma Griffith, who heads port infrastructure research for Fitch Ratings Inc. “People are looking for more flexible forms of capital.”

The South Carolina Port Authority’s charter prevents it from selling stakes in its terminals, a common way for private port operators to win outside investment. Instead, the authority is offering to pay an annual return at a fixed rate, plus a dividend tied to any increase in cargo volumes, Mr. Newsome said.

Such an arrangement has been used to fund infrastructure projects in Europe and Australia, as well as toll roads in the U.S. Ports can be an attractive investment because they produce stable revenues. The challenge will be to get the rate of return high enough for pension fund and investors specializing in infrastructure, who typically require an annual return of 10% or more, said David Ambler, an infrastructure analyst with AllianceBernstein LP.

For the current fiscal year, South Carolina’s ports project a return of 4.5% last year on its $1.1 billion in assets, meaning the port authority expects to earn a profit of about $45 million.

Mr. Newsome said the authority hopes to boost returns by attracting larger ships, increasing the revenue from fees that the port collects on each container and each car that passes through the port. The authority is also investing in technology to increase efficiency and keeping the port open longer hours.

“We are aware that we need to attain a certain return on capital to get investors interested,” Mr. Newsome said. “People look at ports as a utility that should just sort of be there, and that doesn’t work … Ports have got to be run more like a business.”

In recent years, pension funds and private investment firms have invested in or purchased terminals at several U.S. ports. In 2014, Alinda Capital Partners, a Connecticut private equity fund, and a British pension fund bought a marine terminal at the Port of Virginia. The largest terminal at the Port of Newark, on New York harbor, is owned by a fund controlled by German bank DeutscheBank AG.

But such investments are rare when the port authority operates its own terminals. South Carolina’s situation is different because its ports are owned and operated by the port authority, which is run by a state-appointed board.

THE WALL STREET JOURNAL

By ROBBIE WHELAN

Dec. 11, 2015 1:54 p.m. ET

Write to Robbie Whelan at [email protected]


GASB Issues New Pension Guidance Designed to Assist Certain Governments.

Norwalk, CT, December 11, 2015 — The Governmental Accounting Standards Board (GASB) today issued guidance designed to assist governments that participate in certain private or federally sponsored multiple-employer defined benefit pension plans (such as Taft-Hartley plans and plans with similar characteristics).

During the implementation of GASB Statement No. 68, Accounting and Financial Reporting for Pensions, stakeholders raised concerns regarding the inability of a small group of governments whose employees are provided pensions through such multiple-employer pension plans to obtain measurements and other relevant data points needed to comply with the requirements of that Statement.

GASB Chairman David A. Vaudt said, “This new guidance removes an impediment to complying with the GASB’s financial reporting requirements for governments participating in certain multiple-employer defined benefit pension plans. It also promotes enhanced consistency among those applying the standards.”

The new guidance in GASB Statement No. 78, Pensions Provided through Certain Multiple-Employer Defined Benefit Pension Plans, assists these governments by focusing employer accounting and financial reporting requirements for those pension plans on obtainable information. In lieu of the existing requirements under Statement 68, the new guidance establishes separate requirements for employers that participate in these pension plans. Statement 78 establishes the criteria for identifying the applicable pension plans and addresses measurement and recognition of pension liabilities, expense, and expenditures; note disclosures of descriptive information about the plan, benefit terms, and contribution terms; and required supplementary information presenting required contribution amounts for the past 10 fiscal years.


Fitch Takes Rating Actions on U.S. Availability Projects; Applies Revised Criteria.

Fitch Ratings-New York-07 December 2015: Fitch Ratings has taken rating actions on its U.S. portfolio of Availability Payment project financings following the recent publication of its revised ‘Rating Criteria for Availability-Based Projects’ on Oct. 14, 2015. Fitch’s actions on its European Availability Payment portfolio are covered in a separate release published on Dec. 3, 2015.

The rating actions taken include four upgrades (three public and one private) and two affirmations based on Fitch’s assessment of cost risk, realistic outside cost (ROC) stresses, indicative debt service coverage ratio (DSCR) thresholds, breakeven cost analysis as well as completion risk where applicable. In addition, Fitch upgraded one credit due to counterparty credit strength.

Full List of Rating Actions::

Treasurer of State (Ohio):
–Portsmouth Gateway Group, LLC (PGG) (Portsmouth Bypass project) upgraded to ‘A-‘ from ‘BBB’;

Indiana Finance Authority:
–WVB East End Partners LLC (Ohio River Bridges East End Crossing project) upgraded to ‘BBB+’ from ‘BBB’;

New Jersey Economic Development Authority:
–NYNJ Link Borrower LLC (Goethals Bridge Replacement project) upgraded to ‘BBB’ from ‘BBB-‘;

Regional Transportation District:
–Denver Transit Partners, LLC (Eagle project) upgraded to ‘A-‘ from ‘BBB-‘;

Indiana Finance Authority:
–I-69 Development Partners LLC (I-69 Section 5 project) affirmed at ‘BBB’;

Kentucky Economic Development Finance Authority:
–KentuckyWired Infrastructure Company, Inc. (Next Generation Kentucky Information Highway project) affirmed at ‘BBB+’.

The Rating Outlook on all credits is Stable.

A brief rationale for each of the rating actions is described below. In addition, Fitch has also assigned public sector counterparty ratings for each availability payment project using its ‘Rating Public Sector Obligations in PPP Transactions’ criteria published on July 23, 2015, with description of the rationale for these actions also below.

Portsmouth Gateway Group, LLC (PGG) (Portsmouth Bypass Project)

Project Rating

The upgrade to ‘A-‘ from ‘BBB’ reflects Fitch’s Stronger assessment of the project’s exposure to cost risk under Fitch’s revised availability criteria with an all cost breakeven of 81%, which translates into a ROC multiple of over 16x given the low operating responsibilities of this project. The overall Stronger cost risk assessment is derived from Stronger assessments for scope risk and cost predictability and a Midrange assessment of cost volatility & structural protections. The rating further reflects the experience of the managing partner of the design-build joint venture (DBJV), Dragados USA (parent company Dragados, S.A., the construction arm of ACS Group), and the project’s sizable security package that covers the worst-case replacement cost scenario. Once operational, the project will benefit from a strong revenue counterparty, the Ohio Department of Transportation (ODOT), and relatively low complexity operation, maintenance, and lifecycle requirements with the ability to withstand financial stresses.

The rating action applies to the following debt issuances:

— Treasurer of State’s (Ohio) approximately $227 million of senior private activity bonds (PABs), series 2015 on behalf of Portsmouth Gateway Group, LLC;
–Approximately $208 million subordinate Transportation Infrastructure Finance and Innovation Act (TIFIA) loan to Portsmouth Gateway Group, LLC.

Grantor Rating

Fitch has assigned a PPP Grantor Counterparty rating of ‘A+’ with a Stable Outlook to the ODOT’s Portsmouth Bypass project payment obligations. The credit quality of ODOT’s counterparty obligation, two notches below the grantor Issuer Default Rating (IDR), reflects Midrange financial and legal attributes of the financing. ODOT receives large statutorily-determined allocations of motor fuel tax revenues and is not overly leveraged. Its capacity to make payments for this financing from its annual resources is strong.

WVB East End Partners LLC (Ohio River Bridges East End Crossing Project)

Project Rating

The upgrade to ‘BBB+’ from ‘BBB’ reflects Fitch’s Midrange assessment of the project’s exposure to cost risk under Fitch’s revised availability criteria with an all cost breakeven of 64% which translates into a ROC multiple of over 8x. The overall Midrange cost risk assessment is derived from Midrange assessments to scope risk, cost predictability, and cost volatility & structural protections. In addition, the rating reflects the strength of the DBJV, which includes Walsh Construction and Vinci S.A. (rated by Fitch ‘BBB+’/Outlook Stable), the progress to-date in construction with expected completion remaining on schedule and on budget despite slight delays on the tunnel portion of the project. The project also benefits from availability and milestone payments during construction and operation from a highly rated counterparty, the Indiana Finance Authority (IFA).

The rating action applies to the following debt issuances by the IFA on behalf of WVB:

–$482.3 million series 2013A (long-term private activity bonds [PABs]);
–$194.5 million series 2013B (short-term PABs).

Grantor Rating

Fitch has assigned a PPP grantor counterparty rating of ‘AA’ with a Stable Rating Outlook to the IFA’s payment obligations for the Ohio River Bridges project. IFA’s counterparty obligations are intentionally structured nearly identically to the authority’s commitments for appropriation-backed debt issued on behalf of Indiana. There are parallel legal documents using similar language. Fitch views IFA and Indiana’s reporting of the obligations as mixed relative to the criteria assessment, and still evolving. Availability payment PPP structures are still relatively new in the state.

NYNJ Link Borrower LLC (Goethals Bridge Replacement Project)

Project Rating

The upgrade to ‘BBB’ from ‘BBB-‘ reflects Fitch’s Midrange assessment of the project’s exposure to cost risk under Fitch’s revised availability criteria. In addition, the rating also considers the current stage of construction as well as an all cost breakeven of 62% which translates into a ROC multiple of over 8x. The overall Midrange cost risk assessment is derived from Midrange assessments of scope risk and cost volatility and a Stronger assessment of cost predictability & structural protections. The rating further reflects the project’s construction progress remaining on schedule and with sufficient funding to achieve completion prior to the long-stop date. Once operational, the project will receive a stable revenue stream from a highly rated revenue off-taker in the Port Authority of New York and New Jersey.

The rating action applies to the following debt issuances:

–$460.9 million PABs issued by the New Jersey Economic Development Authority on behalf of NYNJ Link Borrower LLC;
–$473.6 million (excluding capitalized interest) TIFIA loan to NYNJ Link.

Grantor Rating

Fitch has assigned an ‘A’ rating with a Stable Outlook to the Port Authority of New York and New Jersey’s (Goethals Bridge Counterparty) rating. The rating considers the various operation and maintenance (O&M), developer finance arrangement (DFA) and capital maintenance (CM) payment obligations to NYNJ Link LLC (NY) as defined under the concession agreement relating to the Goethals Bridge renewal project. This rating considers the terms of the various payment streams in their totality vis-a-vis their priority within the Port Authority’s Consolidated Bond Resolution. The specification of CM and DFA payments as subordinated special obligations is a key rating factor.

Denver Transit Partners, LLC (Eagle Project)

Project Rating

The upgrade to ‘A-‘ from ‘BBB-‘ reflects a direct link to the rating of Fluor Corporation (rated by Fitch ‘A-‘/Outlook Stable), the project’s contractor and operator, which guarantees completion, as well as O&M and lifecycle endeavors. If Fluor was to be downgraded or the guarantee was to go away, the rating of the project would likely be downgraded. Fitch has assessed the project’s exposure to cost risk as Midrange under Fitch’s revised availability criteria, and this cost risk assessment was derived from Midrange assessments of scope risk, cost predictability, and cost volatility & structural protections. The project also benefits from availability payments from a highly rated counterparty, the Regional Transportation District (RTD).

The rating action applies to the following debt issuance by the Regional Transportation District (RTD) on behalf of DTP:

–$398 million in tax exempt PABs, series 2010.

Grantor Rating

Fitch has assigned a PPP Grantor Counterparty rating of ‘A-‘ with a Stable Outlook to RTD’s payment obligations for the Denver Eagle P3 Project. Voter approved sales tax revenues provide a stable revenue stream but the TABOR portion service payment is subordinate to RTD’s senior lien bonds and FasTracks bonds (rated ‘AA+’ and ‘AA’, respectively, both with Stable Outlooks) and the non-TABOR portion is on parity with RTD’s appropriations for O&M and Certificates of Participation (rated ‘A’/Outlook Stable) .

I-69 Development Partners LLC (I-69 Section 5 Project)

Project Rating

The rating affirmation at ‘BBB’ reflects Fitch’s Midrange assessment of the project’s exposure to cost risk under Fitch’s revised availability criteria with an all cost breakeven of 91%, which translates into a ROC multiple of over 12x. The overall Midrange cost risk assessment is derived from Midrange assessments of scope risk and cost volatility and a Stronger assessment of cost predictability & structural protections. The project benefits from a strong availability-based revenue profile and debt service coverage ratio (DSCR) profile that provides cushion against the risk of higher operating and lifecycle cost than forecast. Despite financial metrics that indicate the potential to be rated higher the project is currently capped at the ‘BBB’ level by completion risk given the credit strong of the contractor and security package. The project also benefits from availability and milestone payments during construction and operation from a highly rated counterparty, the Indiana Finance Authority (IFA).

The rating action applies to the following debt issuances by the IFA on behalf of I-69 Development Partners LLC:

–Approximately $3.53 million PABs serial bonds, due 2017;
–Approximately $240.32 million term PABs, due over various maturities no later than 2046.

Grantor Rating

Fitch has assigned a PPP grantor counterparty rating of ‘AA’ with a Stable Outlook to the Indiana Finance Authority’s (IFA’s) payment obligations. IFA’s counterparty obligations are intentionally structured nearly identically to the authority’s commitments for appropriation-backed debt issued on behalf Indiana. There are parallel legal documents using similar language. Fitch views IFA and Indiana’s reporting of the obligations as mixed relative to the criteria assessment, and still evolving. Availability payment PPP structures are still relatively new in the state.

KentuckyWired Infrastructure Company, Inc. (Next Generation Kentucky Information Highway Project)

Project Rating

The rating affirmation of ‘BBB+’ reflects Fitch’s Stronger assessment of the project’s exposure to cost risk under Fitch’s revised availability criteria with a breakeven of 42%, which translates to a breakeven of over 5x. The overall Stronger cost risk assessment is derived from Stronger assessments of scope risk, cost predictability, and cost volatility & structural protections. The rating further reflects the project’s adequate security package and experienced contractors completing a relatively low-risk project. A stable revenue profile is expected due to modest performance requirements and a fully indexed revenue component under the availability-based contract with a highly rated commitment from the Commonwealth of Kentucky (the Commonwealth). The project is able to withstand prolonged financial stresses during the operating phase due to the market-based repricing of the O&M contract every 10 years.

The rating action applies to the following debt issuances by the Kentucky Economic Development Finance Authority on behalf of the KentuckyWired Infrastructure Company, Inc.:
–Approximately $232 million senior tax-exempt revenue bonds series 2015A;
–$58 million senior taxable revenue bonds series 2015B-1 & 2015B-2.

Grantor Rating

Fitch previously assigned a PPP Grantor Counterparty rating of ‘A’ with a Stable Outlook to the Commonwealth of Kentucky’s payment obligations under the Kentucky Wired transaction. Project Agreement terms, including termination provisions and eventual Commonwealth ownership of the asset, clearly establish the significance of Kentucky’s commitment for availability and milestone payments. However, Fitch views the commitment as slightly weaker than that for general fund supported appropriation debt, supporting the one notch distinction with the rating on those bonds (‘A+’/Outlook Stable). The executive and legislative branches have both demonstrated support for the specific project and the Commonwealth’s use of PPP procurements through specific statutory, budgetary, and administrative actions.

RATING SENSITIVITIES

These rating actions purely reflect the update to Fitch’s rating criteria, with the exception of Denver Eagle P3. As such the rating sensitivities remain unchanged from Fitch’s previous publications. (For additional details, see:

–‘Fitch Rates Portsmouth Gateway Group’s Sr. PABS & Sub. TIFIA Loan ‘BBB’; Outlook Stable’, dated April 7 2015;
–‘Fitch Affirms Indiana Finance Authority’s Revs at ‘BBB’; Outlook Stable’, dated Feb. 27, 2015
–‘Fitch Affirms New Jersey Economic Development Authority PABs at ‘BBB-‘, Outlook Stable’, dated May 29, 2015;
–‘Fitch Affirms Regional Transportation Dist, CO’s PABs at ‘BBB-‘; Outlook Stable’, dated May 27, 2015;
–‘Fitch Assigns Indiana Finance Auth’s PABs ‘BBB’ Rating; Outlook Stable’, dated July 23, 2014;
–‘Fitch Rates KentuckyWired Infrastructure Company, Inc.’s Senior Debt’, dated Sept. 3, 2015.

The rating for the Denver Eagle P3 project is tied to the guarantee from Fluor and therefore additional sensitivities as described in the rationale above would apply.

Contact:

Project Ratings

Scott Zuchorski
Senior Director
+1-212-908-0659
Fitch Ratings, Inc.
33 Whitehall Street
New York, NY 10004

Stephanie Jenks
Analyst
+1-212-908-0751

State/Local PPP Counterparty Ratings
Eric Kim
Director
+1-212-908-0241

Committee Chairperson
Bernardo Costa
Senior Director
+55-11 4504 2607


Updated GASB Codification and GARS Online to be Released in March 2016.

Release of the latest edition of the Governmental Accounting Standards Board’s Codification and Original Pronouncements and the June 2015 update to the Governmental Accounting Research System and GARS Online has been delayed until March 2016.

This delay results from the need to extensively revise the Codification to conform to the simplified structure of the GAAP hierarchy as defined by GASB Statement 76. The new Codification will consist of two categories of authoritative GAAP, compared to four previous categories: Category A (Statements) and Category B (Technical Bulletins, Implementation Guides, and AICPA guidance cleared by the GASB). The objective of the new hierarchy is to enable state and local governments to more easily identify the appropriate standard for a given circumstance.

We appreciate your patience and hope that you will find the enhanced documents and GARS update to be valuable resources.


Muni Pros Scold P.R. For Lack of Financial Disclosure.

Municipal investors said Puerto Rico’s $355 million Government Development Bank note payment and claw-back debt management plan did little to resolve the island’s debt crisis.

Buyside experts on Wednesday said the commonwealth remains in a precarious situation, as a now-crucial $1 billion debt service payment looms on Jan. 1. Some said Tuesday’s plan merely postpones an inevitable default, while jeopardizing future payments to some bond holders by clawing back revenue from lower-tier debt to pay general obligations.

“It’s robbing Peter to pay Paul,” said Alexandra Lebenthal, co-chief executive officer at Lebenthal Holdings in New York City. “If I’m Peter I’m not very happy.”

James T. Colby III, senior municipal strategist and portfolio manager at Van Eck Global, which owns a variety of Puerto Rico credits in two municipal high-yield exchange traded funds, said the firm viewed Gov. Alejandro Garcia-Padilla’s testimony to Congress this week with “heightened sensitivity” to the potential repercussions for the debt.

“While we were encouraged by the near-term decision to make payment and meet their near-term obligations, by failing to give greater clarity on any plan for addressing their cash needs — save the comment about a possible ‘claw back’ to provide some working capital — holders such as ourselves were left no better off than 24 hours earlier,” Colby said on Wednesday afternoon. “We are left to wonder if this gesture was one of recognition of the GO full faith and credit pledge or just the play of a bargaining chip.”

Others reiterated the need for increased financial disclosure.

Even though the commonwealth has the ability to claw-back revenue to secure the repayment of general obligation debt service, Peter Delahunt, managing director at Raymond James & Associates, said there needs to be more clarity as Puerto Rico manages its future debt responsibilities and strives to recover from its overall fiscal malaise.

“What is unclear is an actual audited accounting of the commonwealth’s finances,” Delahunt told The Bond Buyer, noting that the commonwealth has not produced audited financial statements for the past two fiscal years. “The lack of audited financials discredits the accuracy of the commonwealth’s recent Financial Information and Operating Data Report, which was reinforced last week when the administration published an Errata Notice that disclosed this report had included erroneous data,” Delahunt said.

“Claims have been made that the report overstates the commonwealth’s general fund debt service burden by as much as 30% to 60%,” Delahunt continued.

“The lack of audited numbers enables a good deal of ambiguity. Until the ambiguity is cleared up, a proper debate for resolution is pointless,” he said.

Michael Comes, a portfolio manager and vice president of research at Cumberland Advisors, said the actions of the commonwealth reflect “one step in many of the process by which Puerto Rico will deleverage its balance sheet and shore up its liquidity in the absence of an orderly resolution process.”

The firm only owns P.R. debt insured by Assured Guaranty and MBIA, Comes said. He said there is concern in the market over the Jan. 1 payments as well as other future debts.

“I don’t think they’re going to be able to make the payment,” Comes said. “They simply do not have the money. The collective unwillingness of creditors and the issuer to achieve consensus has led to a worse outcome than if they had.”

While the commonwealth is faced with limited liquidity, it also must place a high priority on providing services to its citizens, said Peter Hayes, head of the Municipal Bonds Group at BlackRock Inc., which oversees $111 billion in municipal assets and does not own the direct debt of Puerto Rico in its municipal funds.

“This means that it will be more difficult to find sources of funds going forward, making each payment date more tenuous, particularly as markets are closed to them,” he said. “Puerto Rico is clearly trying to pay debt service and avoid litigation, while buying time for consensual negotiations.”

Overall, municipal experts agreed the negatives still outweigh positives for Puerto Rico investors.

“For those credits subject to the claw back, this is clearly a negative credit event – but one that is already being factored into current pricing levels,” Jeffrey Lipton, managing director and head of municipal research and strategy at Oppenheimer & Co. said.

He said while the executive order comes as no surprise and is consistent with the governor’s prior statements and actions, it also underscores the severity of the commonwealth’s liquidity crisis.

At the same time, he said, “it is very difficult to gauge just how serious the cash erosion is given the transparency issues and systemic shuffling of monies that have been characteristic of Puerto Rico for many years.”

Hayes said the commonwealth will need to suspend payments for other issuers in the future, unless there is “a quick settlement with bondholders on a restructuring that includes postponing debt service payments.” He said such a solution seems unlikely.

“Time is running out and the current debt levels are unsustainable,” Lipton said.

“Without broad restructuring capability or access to Chapter 9, the only course of action would be to pursue a PREPA-like restructuring, which as we know has consumed a great deal of time and expense,” Lipton said. He referred to the Puerto Rico Electric Power Authority’s efforts for more than a year to complete a business and debt agreement.

“Multiplying this by several more credits will likely create much greater uncertainty,” Lipton added.

THE BOND BUYER

BY CHRISTINE ALBANO

DEC 2, 2015


S&P’s Public Finance Podcast (Rating Activity for the Week Slows as 2015 Winds Down).

In this week’s segment of Extra Credit, Senior Director Dave Hitchcock explains our recent outlook revision on Massachusetts, and Directors Helen Samuelson and Nick Waugh discuss our rating changes affecting the City of Chicago Sales Tax Revenue Bonds and Boston University, respectively.

Listen to the Podcast.

Dec. 4, 2015


High Yield Municipal Bonds: Understanding Where Credit Risk Lives.

Even among nonrated bonds, defaults are generally rare and focused on narrow areas.

Moody’s regularly publishes a study that examines defaults in the rated universe of distressed municipal bonds, but it leaves out a sizable portion of the municipal market that is unrated. To provide clarity on the full municipal market, we conducted our own study using Bloomberg data. Here’s what we found.

With over $3.7 trillion municipal bonds currently outstanding, there are approximately $57 billion in municipal bonds (or 1.5% of the outstanding municipal market) in Bloomberg that are coded as distressed. Distressed in this instance can mean that the issuer fully defaulted on a bond payment, partially defaulted on a bond payment, or is in violation of a covenant (i.e., the debt service coverage ratio is below the set-forth amount).

As the table below indicates, the sector with the largest number of distressed bonds is Tobacco, with $14.2 billion or 23.5% of the total. Such bonds are funded with settlement money and categorized as distressed due to the overall decline in smoking and the fact that some large issuers have drawn on their liquidity reserve funds to pay interest. General Obligation (GO) bonds account for $13 billion or 21.6% of the total. This should not be taken as an indication of poor credit quality in GOs overall; it’s more that names that have received extensive headline coverage for fiscal concerns-Puerto Rico, Detroit and Jefferson County-all have bonds in the category. The Power sector, the third largest ($8.2 billion or 13.6%), is largely composed of Puerto Rico Electric Power Authority (PREPA) debt, which is subject to similar pressures as other municipal issuance from the commonwealth.

Sector Par Outstanding Number of Distressed Credits
Tobacco Settlement 14,240,689,199 40
General Obligation 13,061,406,880 375
Power 8,199,925,000 244
Other* 8,140,559,192 894
Development 4,509,884,983 543
Water 2,324,284,636 212
Pollution 1,427,215,000 46
Facilities 1,292,044,000 191
Nursing Homes 1,192,993,593 311
Medical 1,038,405,000 232
Multifamily Housing 1,000,142,118 195
Airport 830,615,000 19
Transportation 755,055,441 64
Build America Bonds 681,670,000 6
Education 445,625,000 79
Higher Education 350,010,000 53
Utilities 341,515,000 42
Mello-Roos 292,915,000 126
Housing 237,733,785 29
Single Family Housing 62,504,423 32
School District 7,880,000 10
Bond Bank 195,000 1
Total $60,433,268,251 3,744

*Other refers to Special Tax District, Bonds, Tax Increment Bonds and certain Community Development District bonds.
Source: Bloomberg, Neuberger Berman, data as of November 23, 2015.

By definition, high yield municipal bonds carry greater credit risk than their investment grade municipal counterparts. But it bears noting that distressed credits are less common among high yield municipals than their corporate high yield counterparts, where 2.3% of bonds are considered to be distressed. 1 As such, we believe that the municipal market continues to be a good place to add credit risk in exchange for additional yield, particularly among what we would characterize as quality non-investment grade issues. Of course, when investing in higher yield bonds, it is important that investors undertake careful analysis of issuer credit fundamentals as they pertain to long-term payment prospects.

1 As defined by the Merrill Lynch U.S. High Yield Index.

This material is provided for informational purposes only and nothing herein constitutes investment, legal, accounting or tax advice, or a recommendation to buy, sell or hold a security. This material is not intended as a formal research report and should not be relied upon as a basis for making an investment decision. The firm, its employees and advisory clients may hold positions of companies within sectors discussed. Specific securities identified and described do not represent all of the securities purchased, sold or recommended for advisory clients. It should not be assumed that any investments in securities identified and described were or will be profitable. Any views or opinions expressed may not reflect those of the firm as a whole. Information presented may include estimates, outlooks, projections and other “forward looking statements.” Due to a variety of factors, actual events may differ significantly from those presented. Neuberger Berman products and services may not be available in all jurisdictions or to all client types. Investing entails risks, including possible loss of principal. Investments in hedge funds and private equity are speculative and involve a higher degree of risk than more traditional investments. Investments in hedge funds and private equity are intended for sophisticated investors only. Unless otherwise indicated returns shown reflect reinvestment of dividends and distributions. Indexes are unmanaged and are not available for direct investment. Past performance is no guarantee of future results.

The views expressed herein may include those of those of Neuberger Berman’s Asset Allocation Committee which comprises professionals across multiple disciplines, including equity and fixed income strategists and portfolio managers. The Asset Allocation Committee reviews and sets long-term asset allocation models and establishes preferred near-term tactical asset class allocations. The views of the Asset Allocation Committee may not reflect the views of the firm as a whole and Neuberger Berman advisers and portfolio managers may recommend or take contrary positions to the views of the Asset Allocation Committee. The Asset Allocation Committee views do not constitute a prediction or projection of future events or future market behavior.

December 02, 2015, 12:00:00 AM EDT

By Sarah Gehring | Senior Research Analyst, Municipal Fixed Income, Neuberger Berman

This material is being issued on a limited basis through various global subsidiaries and affiliates of Neuberger Berman Group LLC. Please visit www.nb.com/disclosure-global-communications for the specific entities and jurisdictional limitations and restrictions.

The “Neuberger Berman” name and logo are registered service marks of Neuberger Berman Group LLC.

© 2009-2015 Neuberger Berman LLC. | All rights reserved

The views and opinions expressed herein are the views and opinions of the author and do not necessarily reflect those of Nasdaq, Inc.


Clinton Proposes $275 Billion Infrastructure Plan With Bank, BABs.

DALLAS — Democratic presidential contender Hillary Clinton outlined a plan for $275 billion of new federal infrastructure funding, including a revival of the stimulus-era Build America Bonds program, at a campaign stop on Sunday in Boston.

Clinton’s proposal includes $250 billion of direct federal funding for roads, transit systems, and ports — in addition to whatever transportation spending is contained in a compromise multiyear highway bill expected to be released on Monday night — and a $25 billion federally funded infrastructure bank that she said would generate an additional $225 billion of low-interest loans to spur private investments in public projects.

“This would be on top of what the Congress should finally get around to authorizing,” Clinton said of the $275 billion proposal at the Nov. 29 “Hardhats for Hillary” rally. “That is just the floor. We have to build on that. We are trillions of dollars behind. We have to add to what the Congress appropriates.”

Clinton did not provide details of her infrastructure plan at the Boston rally, but a campaign spokesman said the additional funding would come from corporate tax reform.

“Our roads and bridges are potholed and crumbling,” Clinton said. “Our airports are a mess, our ports need improvement, and our rail systems do as well.”

Sen. Bernie Sanders, I-Vt., who also is seeking the Democratic nomination for president in 2016, in January proposed a $25 billion national infrastructure bank as part of his $1 trillion, five-year infrastructure program.

Sanders’ Rebuild America Act proposal (S. 268) would boost expenditures from the Highway Trust Fund to $75 billion a year from fiscal 2015 through fiscal 2022 from the current $53 billion. His infrastructure plan would provide $735 billion of transportation funding, including $75 billion for passenger and freight rail infrastructure, and $145 billion for local and state water projects.

The latest short-term extension of federal transportation funding authority, a 14-day fix signed into law the week before Thanksgiving, will expire at midnight Friday unless Congress passes either a multiyear bill or, more likely, another quick fix to give lawmakers a few more days to agree on a compromise measure being developed by a House-Senate conference committee.

Rep. Bill Shuster, R-Pa., chairman of the conference committee resolving the differences between competing House and Senate highway bills, said he expects a bipartisan conference report on a five-year highway bill will be released Monday night.

The compromise proposal would shorten the six-year bills to five years to boost annual funding levels, bringing them closer to the per-year amounts in the Senate proposal.

Shuster, who is also chairman of the House Transportation and Infrastructure Committee and chief sponsor of the House highway bill, told the Pittsburgh Tribune Review in an interview published on Sunday that he would have preferred a full six-year funding measure rather than the five-year plan that will be recommended in the compromise bill.

“It’s always a battle, but you can’t expect to get everything you want. None of us get that in life,” Shuster said. “But you work together to get things passed because it’s what is right for the country.”

The Senate’s DRIVE Act (H.R. 22) would allocate $273.4 billion for highways and $59.3 billion for transit through fiscal 2021. The House adopted an amended version of the Senate measure that authorized $261 billion of federal highway funding and $55 billion for public transit.

The original bills included full funding for only the first three years, with billions of dollars in general revenue offsets to support the $40 billion per year of dedicated taxes deposited into the HTF. Expenditures from the HTF in fiscal 2015 totaled $53.7 billion.

THE BOND BUYER

BY JIM WATTS

NOV 30, 2015 1:54pm ET


Memo to Puerto Rico: Alabama County Shows Limits of Bankruptcy.

Four years after filing what was then the largest municipal bankruptcy in U.S. history, Jefferson County, Alabama, is learning that having debt wiped out in court doesn’t solve all one’s financial problems.

Alabama’s largest county emerged from bankruptcy in 2013 freed from $1.3 billion of bonds that hastened its collapse, only to still be unable to make up for deep spending cuts for police, road work and health care. It’s at risk of defaulting on some debt as soon as 2017. And it’s counting on returning to the bond market next year for the first time since leaving court protection, seeking to free up needed cash by refinancing debt left behind.

“They’re floundering, still bogged down with remnants of their past,” said Richard Ciccarone, president of Merritt Research Services in Chicago, which tracks municipal borrowers. “They still have remaining structural issues that weren’t resolved by their bankruptcy.”

The 661,000-person county, which is home to Birmingham, provides a lesson for Puerto Rico, the Caribbean island 1,650 miles (2,654 kilometers) away. There, with the government rapidly going broke after running up $70 billion of debt as the economy sputtered, Governor Alejandro Garcia Padilla is pleading with U.S. lawmakers to give it the power to file for bankruptcy, just as local governments can. They’ve so far declined.

While such a step allows governments to escape from debts if a judge approves, it can leave behind other liabilities, delaying a fresh start, and doesn’t always address the root cause.

Detroit, which was once felled by rising debt, pension bills and a shrinking population, in 2024 will have to start paying about $194 million a year in workers retirement bills that were delayed by the bankruptcy. Jefferson County is still contending with debt that was left intact and the blow of a court verdict that struck down a tax that provided 40 percent of its revenue.

“Bankruptcy was never a panacea, but necessary to deal with an unimaginable debt load,” said James Stephens, president of the Jefferson County Commission, in an e-mail.

Jefferson County’s bankruptcy was triggered by a sewer project that was dogged by mismanagement and corruption. When the price tag more than doubled to over $3 billion, officials refinanced debt with floating-rate bonds and derivatives, like homeowners who used exotic loans to buy houses they couldn’t afford. The tactic backfired during the 2008 credit-market crisis, leaving the county on the hook for hundreds of millions in fees and demands to pay off the debt early.

Then, in 2011, an Alabama judge ruled that a wage tax that raised $75 million a year was illegal. That finally pushed it to file for bankruptcy, which allowed it to cut its sewer debt to $1.8 billion from $3.1 billion.

Still, the county reduced its workforce by 1,200, or one-third, in response to the loss of the tax. One jail was closed, and the county has been hard-pressed to invest in new infrastructure. The budget has been cut by 46 percent since 2008, according to Fitch Ratings, which estimates that the county will need to drain $38 million from its reserves this year.

Jefferson County is now seeking to free up money for infrastructure projects by refinancing about $666 million of debt sold for its schools in 2004 and 2005 as soon as first quarter of 2016, said Stephens.

Default Risk Lingers

It plans to do the same with about $69 million of obligations backed by leases on county buildings. The county has struggled to meet those bills: It initially planned to have bond insurer Ambac Financial Group Inc. cover some of the debt payments due this fiscal year, which Standard & Poor’s said would be a default, until it was able to secure funds. That sparked a two-level upgrade by S&P on Dec. 1 to CCC, eight steps below investment grade.

“Because there’s not a plan to make those payments after 2016, we think they’re still vulnerable,” said Jim Tchou, analyst at S&P.

By refinancing the school debt and pushing payments into the future, the county will be able to access about $36 million a year of taxes that support the debt and provide $18 million for schools, said Stephens, the county commissioner.

Jefferson County convinced state lawmakers to allow it to use some of the 1 percent sales tax that now goes to the school debt for other expenses after the refinancing. The sale still has another hurdle: The county’s awaiting approval of the deal from an Alabama judge. A group of residents is also seeking to have the sales tax thrown out in court, which, if successful, would deal a fresh hit to the public purse.

“Bankruptcy provides more runway to deal with financial pressures but it doesn’t resolve the systematic problems that existed before,” said James Spiotto, managing director at Chapman Strategic Advisors LLC, which advises on financial restructuring.

In Puerto Rico, officials would like to give it a try. If only Congress would let them.

Bloomberg Business

by Darrell Preston

December 3, 2015 — 9:01 PM PST Updated on December 4, 2015 — 5:01 AM PST


Moody's: U.S. State and Local Government Outlooks are Stable for 2016.

New York, December 04, 2015 — The 2016 outlook for both US states and local governments remain stable as the continuing recovery of the US economy drives moderate tax revenue growth, Moody’s Investors Service says in two new annual outlook reports.

State tax revenue should rise 4%-5% in 2016. While this is slightly below last year’s forecast, it is consistent with the post-recession average.

However, regional challenges will cause economic and revenue performance to vary across the country. Oil and gas producing states, particularly those with budgets heavily reliant on the sector, could be forced to reduce their budgets and lower their forward revenue assumptions.

Other pressures to state budgets include K-12 education, Medicaid, and infrastructure maintenance.

“Even with slower revenue growth and headwinds from rising spending costs, we expect most states will successfully keep their financial positions in balance with prudent budgeting,” Kenneth Kurtz, a Moody’s Senior Vice President, says in “US States 2016 Outlook – Moderate Revenue Growth Supports Fiscal Stability for Most States.”

Property taxes, which are the primary source of most local government revenues, are expected to improve by 2%-3% amid local tax base growth. Though still below prerecession growth of 4%-5%, some local governments are limited by tax caps and slower-than-expected recoveries.

In addition, the stable outlook for local governments is supported by an increase in median fund balances. Fund balance levels indicate the financial resources a local government has available to meet future contingencies, Moody’s says, and currently median fund balances are higher now than in 2008.

Unfunded pension liabilities and other fixed costs remain a long-term challenge for some local governments, however.

“Net pension liabilities will continue to grow in 2016, particularly given weaker June 30, 2015 investment returns and because local governments’ annual pension contributions are often below actuarial requirements,” David Strungis, a Moody’s Analyst, says in “US Local Governments 2016 Outlook – Growing Property Tax Revenue and Improving Fund Balances Underpin Stable Outlook.”

Moody’s outlooks reflect its expectations for the fundamental financial and economic conditions in a sector over the next 12-18 months.

The reports are part of a series of outlooks on a wide variety of sectors globally published by Moody’s. For other reports in the series, go to www.moodys.com/2016outlooks.

The state outlook is available to Moody’s subscribers here and the local government outlook is located here.


Standard & Poor's U.S. Public Finance Transportation Rating Transitions and Defaults Study Spotlights Stability.

Although U.S. public finance transportation sector ratings tend to be lower than in other areas of municipal finance, the sector is among the most stable regarding the level and number of ratings. The sector includes airports, ports, mass transit, parking facilities, and toll roads and bridges. In this CreditMatters TV segment, Senior Director Larry Witte highlights the report’s key findings.

Watch the video.

Nov. 23, 2015


Why Are Closed End Bond Funds On Sale Like Its Black Friday?

Many closed end bond funds (“CEFS”) are trading at large discounts to net asset value (“NAV”).

I selected Western Asset Managed High Income Fund for this chart, but there are many closed end bond and loan funds (including funds invested in Municipal Bonds) that exhibit similar patterns.

We have seen the discount to NAV (the yellow line) increase. This has largely been due to the price performance of the CEF, as the underlying NAV has been reasonably stable as of late.

The most common reasons I hear for the discount to NAV on so many CEFS are:

I will attempt to address each of these reasons in turn and will add one additional reason to consider deeply discounted funds.

A December Rate Hike and Bond Prices

According to Bloomberg, the market is pricing in a 72% chance that the Federal Reserve Open Market Committee will raise the Federal Reserve Fund Target Rate range by 0.25% in December.

I wanted to be explicit about what rate is being hiked because it is crucial to understand that the Fed has limited ability to set longer term rates. The treasury market yield curve for bonds with maturities 2 years or less is heavily influenced by the Fed Funds Rate and by the messages the Fed sends. As you move further out the curve, to 10 years and beyond, rates are influenced by longer term policy indications and fears (or hopes) of growth and inflation.

With the rate hike so well telegraphed, there is little reason to believe that bond yields across the curve will move by much. Any change in longer term yields are more likely to more based on the tone of the Fed meeting – which will likely be very dovish and show that they will be extremely cautious in terms of future interest rate hikes.

So based solely on the hike, there should be little movement in bond prices.

There is concern that the rate hike will cause the dollar to strengthen, causing yet more pressure on commodity prices, in turn hurting bonds of those producers. That is a possibility, but as we have seen time and time again, when something is so logical and widely anticipated, it rarely occurs. The market has had almost a year to digest the impact of the first rate hike, and the dollar (as measured by the DXY Index) is already at highs of the past 12 years (first reached in February).

So being concerned about further dollar strength is rational, it may already be priced in.

The Impact of Leverage

A rate hike will likely increase the cost of the leverage used by most CEFs. Assuming the fund borrows using short term rates (3 month LIBOR for example), without an interest rate floor, then the cost of those borrowings is likely to increase. That will impact the Net Interest for the CEF (Total Interest minus Cost of Funds).

For most funds that will have a very small impact on what can be distributed, as it will likely only be 0.25% and only on the amount of money borrowed (typically 25% to 33% of the funds size). I anticipate that cost will be around 0.1% in the first quarter of next year for most funds, which is small relative to dividend yields and current discounts to NAV.

So while the direct cost of increased borrowing costs is real, it is small relative to current dividend yields and NAVs for many funds. MHY, which does not use leverage, has a 9.5% dividend yield and 15.6% discount.

Leverage does amplify price moves in the underlying asset classes, but that is ongoing and has nothing to do with a change in rates. It also works in both directions, so any price increases in the underlying assets will also be impacted. Whether or not bond prices will increase or decrease from here is unknown, the impact of leverage on the return of the underlying assets cannot be ignored and bond prices could drop further, but the current discount to NAV can be a large offset over time.

Asset Quality

Much has been made about the difficulty in valuing and trading bonds. While that is true it can be overstated. According to TRACE data, the market has been averaging over $15 billion of investment grade bond trading on a daily basis for the past month. High Yield volumes are much smaller but not insignificant.

I like to look at the ETF’s to judge how “well” a market is trading. If a market is out of favor or very difficult to value, I would expect the ETF for that market to be trading at a discount to NAV.

But that is not currently the case as the ETF’s for Municipal Bonds, Investment Grade Bonds, and High Yield Bonds are all trading at a premium to NAV.

Asset Class ETF Premium
Municipal Bonds MUB 0.2%
Investment Grade LQD 0.0%
High Yield HYG 0.5%
High Yield JNK 0.5%
Leveraged Loans BKLN -0.2%

That premium to NAV should ease concerns that the asset class is “for sale”. In fact the difference in the high yield market, where many of the CEFS trading at the largest discount to NAV invest versus the ETF’s trading at a premium is striking.

Leveraged loans, which also have many CEFS, are a bit more concerning as the main ETF for that market continues to trade at a discount to NAV and experience outflows.

Tax Loss Harvesting

This can be a valid strategy, particularly if coupled with buying a similarly discounted CEF – to capture the tax loss without creating a wash sale issue (please talk to your accountant for any tax related issues).

That could be causing some selling pressure but that tends to dissipate as we near year end. Furthermore, we often see new allocations to fixed income in the first part of the year where investors tend to “annualize” the yield they can receive – not a strategy I condone as I believe fixed income should be managed throughout the year, but it is a flow that tends to occur with regularity so I would not want to ignore that.

So this is a real issue, but a temporary one that should be nearing the end of this year’s flows.

Manager Buying

As we near year end, we could see some managers buy back shares of some of their most heavily discounted CEFS. I have spoken to several managers of CEFS and they all tend to start buying back shares to support prices in the 15% to 18% discount range (some types of funds start earlier). Managers do not like their funds to experience high discounts to NAV for prolonged periods as they feel it can reflect poorly on the manager.

So we are nearing levels on many funds, where another possible source of capital inflows could enter the market, supporting the trading price versus NAV.

Are CEFS the Doorbuster of the Market?

There remains a lot of risk in the bond market, but good managers can find value, and while we have all been trained to buy what retailers “discount” so far, we generally have the opposite tendency when it comes to markets. The discount to NAV for many represents fear, rather than the impulse to get a good deal.

For myself, I am not sure that the pain is over in the bond market, but well managed CEFS trading at a deep discount to NAV is interesting, especially when so many of the reasons we are seeing that phenomenon can be explained away.

Disclaimer: The content provided is property of Peter Tchir and any views or opinions expressed herein are those solely of Peter Tchir. This information is for educational and/or entertainment purposes only, so use this information at your own risk. Peter Tchir is not a broker-dealer, legal advisor, tax advisor, accounting advisor or investment advisor of any kind, and does not recommend or advise on the suitability of any trade or investment, nor provide legal, tax or any other investment advice.

NOV 29, 2015 @ 09:30 AM

Peter Tchir

Barron’s


Muni Volume Dips 21.6% in 3rd Month of Decline.

Municipal bond volume fell for a third straight month in November, as refundings declined by more than one-third from the same month last year.

Long-term muni bond issuance declined by 21.6% to $23.19 billion in 834 issues from $29.56 billion in 995 issues during the same period last year, according to Thomson Reuters data. The last November with lower volume was in 2000, when the monthly issuance totaled $19.80 billion.

“I am not totally surprised by the decline but a little surprised by the magnitude,” said Dan Heckman, senior fixed income strategist at U.S. Bank Wealth Management. “It is playing out how we thought, all in and all. This trend will continue and will make for continued outperformance for munis.”

The drop is “evidence of the volatility in the overall market,” said Natalie Cohen, managing director at Wells Fargo Securities, who noted that Federal Reserve policymakers have continued to put off raising interest rates from historic lows. “At the end of August, there was a major equity drop and a rally in municipals,” she said. “Since then we have been very bouncy. After the rates didn’t rise, it took some time until we starting seeing issuance again.”

Refundings have now declined in four of the past five months, plunging 39.5% to $7.42 billion in 319 deals in November from $12.26 billion in 444 deals a year earlier.

“Refundings have fallen off a cliff and it is getting more and more challenging with how much refunding has taken place, there is not much left to refund,” Heckman said. “We are not issuing enough to keep up with number of bonds that have been called.”

New money issuance slipped 1.7% to $11.93 billion in 449 transactions from $12.13 billion in 473 transactions a year earlier.

Issuance of revenue bonds fell 17.1% to $14.22 billion, while general obligation bond sales dropped 27.7% to $8.97 billion.

Negotiated deals were down 15.3% to $17.43 billion and competitive sales decreased by 26.8% to $5.62 billion.

Taxable bond volume was 22.7% lower to $1.69 billion from $2.19 billion, while tax-exempt issuance declined by 24% to $20.42 billion. Minimum tax bonds more than doubled to $1.08 billion from $508 million.

Bond insurance broke a three-month streak of decreases, as the par amount of deals with guarantees improved by 16.8% to $2.09 billion in 121 deals from $1.79 billion in 147 deals in November 2014.

Cities and towns saw an increase of 49.4% increase to $4.37 billion in 224 transactions from $2.92 billion in 254 transactions, while state governments, state agencies, counties and parishes, districts, local authorities, colleges and universities and direct issuers all saw decreases and hefty declines at that.

“When it comes to cities and towns, that’s a reflection of some of the large borrows doing refundings in the month and a reflection of infrastructure that state and local governments are doing what they need to do. The logic is there with the rates being low so they are saying ‘let’s get it done’,” Cohen said.

Cohen also said that while large deals by the likes of Industry City, Calif., Los Angeles municipal development corporation, Miami-beach and Anchorage had an effect, the system for bringing deals to market is more complex for cities and towns than it is for revenue bonds. The combination of delayed deals and new ones coming to market all at once could be another reason why issuance by cities and towns improved, she said.

The sectors were evenly split this month, with five seeing increases and five seeing decreases. The education, electric power, environmental facilities, housing and public facilities sectors gained.

“One of the bigger questions is why there isn’t more borrowing. The rates are low and we need infrastructure. but there has been this overhang of people saying ‘I can’t raise taxes’ but there was some change in that recently and you could see that in the local elections,” said Cohen.

Both the housing and public facilities sectors saw gains despite having a lower number of transactions, compared with November 2014. Housing transactions increased 23.7% to $1.19 billion in 35 deals from $967 million in 44 deals while public facilities issuance jumped up 46% to $1.65 billion in 49 deals from $1.13 billion in 57 deals.

With only one month now left in 2015, California, Texas, New York, Florida, and Pennsylvania remain the top issuers for the year to date.

The Golden State kept the top spot with $52.29 billion of issuance thus far in 2015, while the Lone Star State is second with $44.63 billion. The Empire State is third with $39.15 billion, the Sunshine State came in fourth with $19.93 billion and the Keystone State ranked fifth with $16.63 billion.

While it had looked like the market was almost certain reach the $400 billion plateau for yearly issuance, it now seems less likely, as a volume total of roughly $23 billion would be needed in December.

“I am not sure we will reach the $400 billion plateau,” Heckman said. “It will be very close – the drop off in new issuance is significant.”

Heckman said his firm expects the Fed to raise the benchmark rate by 25 basis points as it takes a “patient and methodical” approach to normalization.

Cohen expects issuance to reach the $400 billion mark and rates to rise in December, but says the bigger question is what will happen in the subsequent meetings in 2016.

“Will it be raise, raise raise? I think they will take it slow, raise it a little in December and wait and see from there on out,” she said. “Hopefully markets do not react dramatically. The global factor is a big one: it will be interesting to see how global events impact the market after December, once the rates are higher.”

THE BOND BUYER

BY AARON WEITZMAN

NOV 30, 2015 4:00pm ET


What’s a Fair Fare?

As transit agencies move toward income-based discounts, they still need to keep larger issues in mind.

Like so much of government, transit agencies walk a tightrope between providing a public service and not breaking the bank. Thanks to advances in smart-card technology, transit policymakers can now use income-based fare discounts to take a more nuanced approach to the public service-vs.-efficiency challenge. But the fundamental tension — and the need to focus on customer service — remains.

Nowhere is the balance between access and solvency harder to achieve than in Boston, a compact metropolitan area that relies heavily on transit. The region’s density and high cost of living must be weighed against the fragile physical condition and precarious finances of the Massachusetts Bay Transportation Authority (MBTA). The agency owes about $9 billion in debt and interest, it faces a maintenance backlog of more than $7 billion, and it famously collapsed under the weight of this year’s brutal winter.

The MBTA’s financial problems are worse than most, but other transit agencies have the same types of challenges. According to the American Public Transportation Association, more than 70 percent of American public transit systems cut service, raised fares or did both during the Great Recession and its aftermath.

In the wake of last winter’s meltdown, the MBTA was put under the control of a Fiscal and Management Control Board (FMCB), which is contemplating fare increases that would take effect next summer. One option board members are considering is introducing low-income fare discounts to counterbalance the fare hikes.

Boston’s wouldn’t be the first transit agency to try that approach. The San Francisco Municipal Transportation Agency implemented a plan called Muni Lifeline in 2005, but even though 20 percent of Bay Area residents live below the poverty line, only about 6 percent of system riders participate, One reason for the limited participation could be that the discount applies only to Muni’s bus and rail services, not Bay Area Rapid Transit trains.

Seattle presents a better comparison. Under a system implemented in March, together with the system’s sixth fare hike in eight years, those with annual incomes below 200 percent of the federal poverty line ($47,700 for a family of four and $23,340 for an individual) ride for $1.50, less than half of peak fares. Local transit officials estimate that 45,000 to 100,000 eligible residents will take advantage of the discount.

Low-income discounts are also an issue in Denver. In January, bus fares will rise from $2.25 to $2.60 and a monthly pass will cost $99. Advocates there are pushing for $1.30 fares and $49 monthly passes for recipients of public assistance.

In an era of scarcity, transit agencies can’t offer discounts to large swaths of riders without recouping the money elsewhere, and government isn’t a good candidate to kick in more. A 2014 U.S. Government Accountability Office report projected that state and local government tax revenues, as a percentage of gross domestic product, won’t reach pre-Great Recession levels until 2058.

But at the same time, transportation infrastructure has no more basic purpose than to facilitate economic growth. That includes providing low-income residents with a way to get to and from their jobs and an opportunity to climb the economic ladder.

Ultimately, the fate of transit agencies’ worthy experiment with low-income fare discounts will rest on the answer to one question: Are more affluent riders willing to make up the difference by paying more, or will higher fares push them to other transportation options?

Seattle’s transit agency awaits the answer to that question. Boston and Denver may soon join the list. Whether those riders choose to stay or go provides a reminder of why customer service needs to be job one throughout the transit industry.

GOVERNING.COM

BY CHARLES CHIEPPO | DECEMBER 1, 2015


The Accounting Rules That Bankrupt Cities.

The cash-basis accounting system allows governments to make financial commitments that they won’t be able to fulfill in the future.

In November 2014, a Michigan bankruptcy judge confirmed a plan that allowed Detroit’s government to shed $7 billion in liabilities, averting a total financial collapse. One year later, however, many in Detroit are still dealing with the fallout of the massive debt reorganization.

Among the many shortchanged by the city’s bankruptcy, Detroit’s retired municipal workers have gotten a particularly raw deal. The plan imposed deep cuts in future pension and health-care benefits. Perhaps more galling, it also required retirees to pay back a decade of interest they earned on city-sponsored retirement savings accounts. These so-called clawbacks averaged nearly $50,000 per retiree. In one circumstance, a retiree returned $96,000.

These losses for retirees seem unusual, but many more like them could follow. The same accounting strategy that led Detroit to make unfulfilled promises is widely used by state and city legislators throughout the country. By using an accounting method known as cash-basis accounting, legislators project future spending without having to consider billions of dollars of long-term financial commitments, leaving many budgets balanced in name only.

It may be easiest to think in terms of personal finance. Imagine you purchase a car for $20,000 in 2015, but under a special promotion no payments are due on your bill until 2018. In what year did you incur the $20,000 bill? Most people would say 2015, the year you acquired the car. That’s the answer mandated under accrual accounting, a method of financial reporting required of all public companies by the Financial Accounting Standards Board. But many state and city legislatures disagree. They operate with the conviction that a bill is not incurred until the money leaves your bank account to pay it. So if you choose not to pay the bill for your car until 2018, for accounting purposes the bill will only appear that year.

When converted to accrual accounting, Virginia’s $50 million surplus turned into a $674.3 million deficit.
Cash-basis accounting is a recipe for fiscal disaster. State and local governments make long-term commitments for programs like employment compensation plans and public works projects. But they write their budgets on a year-to-year basis, as if starting all over again each year with fresh revenue and expenses. They leave out any revenue not received or, more importantly, any expense not incurred that year. The implications of this financial-planning decision can be immense. In 2010, Virginia reported that it had a cash-basis surplus of nearly $50 million in a budget of $34 billion. When converted to accrual accounting, the surplus turned into a $674.3 million deficit.

Government pension funds are a prime example of the kinds of expenses that state and local governments hide. When legislators announce an increase in upcoming pensions for government employees, the government amasses large new financial liabilities and makes a legally binding obligation for expenses incurred. But under cash-basis accounting, the new pension liabilities won’t show up in the budget until the government starts to pay out decades later. This is what happened in Detroit, which declared bankruptcy two years ago in large part because enormous pension and health-care payments were due and the city couldn’t pay for them.

Fearing precisely this sort of fiscal calamity, the Financial Accounting Standards Board outlawed cash-basis accounting decades ago in much of the private sector. This policy ensured that companies would understand their fiscal health before making any significant decisions involving costly long-term commitments.

The International Federation of Accountants and the Big Four accounting firms have been calling on governments to change their practices for years. They say that accrual accounting gives the public better information about its governments’ finances and, as a result, helps avoid a fate like Detroit’s. New York City, for example, made the switch in 1975 as part of its effort to avoid bankruptcy. Around the world, many governments—including some in Africa, Asia, and Latin America— are planning to shift to accrual accounting in the near future.

The shift to accrual accounting isn’t painless for new adopters. Once forced to reckon with long-term liabilities, state and city governments will likely find they have amassed much bigger deficits than they realized. Legislators may then need to cut spending and entitlements in an effort to balance their budgets.

Accrual accounting is also a far more complex method. Small municipal governments might not have enough manpower to adopt an accounting method that—beyond recording revenues received and expenses incurred as those events happen—requires projections about the budget extending in the coming years.

But states and large cities like Detroit cannot afford to ignore accrual accounting.

With budgets worth billions of dollars, their legislatures should have the expertise to handle its rigors. And by making tough budget decisions now, these governments might avoid making tougher decisions down the road.

THE ATLANTIC

JEREMY LISS

NOV 23, 2015


Copyright © 2024 Bond Case Briefs | bondcasebriefs.com