A roundup of money (and other) news governments can use.
GOVERNING.COM
BY LIZ FARMER | MARCH 10, 2017
A roundup of money (and other) news governments can use.
GOVERNING.COM
BY LIZ FARMER | MARCH 10, 2017
North Carolina wants to use existing low rates to shore up retiree pensions and health-care debt.
In the low interest rate environment, states and localities have been saving billions by refinancing old debt. In most cases, the savings have benefited the general fund balance. But in North Carolina, State Treasurer Dale Folwell is making a push to instead use those savings to pay down pension and retiree health-care debt.
Starting this spring, Folwell plans to refinance “every dollar we possibly can.” He’ll ask the General Assembly to divert the savings to the treasurer’s office, where he’ll then divvy up the extra dollars: 15 percent goes into the pension fund and 85 percent goes toward retiree health-care debt, which has a larger unfunded liability.
The approach has garnered rave reviews, but some question just how big a dent any such savings can make in an unfunded liability that in North Carolina totals nearly $38 billion between retiree pensions and health care.
It’s true the money can add up. Since 2009, North Carolina has refinanced roughly $4 billion in debt, amounting to savings of nearly $289 million, according to the state’s most recent debt affordability study.
Nationwide, more than half of the total bonds issued in the municipal market since 2009 have been to refinance deals. Last year, roughly $275 billion of the nearly $450 billion in total bond issuance was to refinance existing debt. Refinancing deals are still expected to drive issuance this year, even with the Federal Reserve slated to raise short-term interest rates.
The savings per deal can vary. Connecticut saved nearly $76 million last year when it refinanced $501 million in general obligation bonds. In 2015, Washington state refinanced $421 million and saved $32 million in debt costs.
Municipal bond expert Matt Fabian also notes that savings from refinancing debt aren’t immediate. Similar to refinancing a home, the debtor makes lower payments on the debt going forward, meaning the total savings are realized over time. For instance, Connecticut in 2014 refinanced $822 million in general obligation bonds and saved $94.8 million over the next 11 years.“So the savings are real but it’s on paper,” says Fabian, a partner at Municipal Market Analytics. “In effect, it’s a promise to pay [over time] from the general fund the savings they just generated.”
Still, Fabian praises North Carolina because refinancing essentially produces “found” money. “Any time you can start paying down a debt without raising taxes or cutting spending, that’s a good thing,” agrees Donald Boyd, director of fiscal studies at the Nelson A. Rockefeller Institute of Government. He adds that it’s also better fiscal policy to put found money into a one-time use, rather than into recurring expenses like the current year’s budget.
Folwell thinks that credit ratings agencies will look favorably upon the tactic. North Carolina already has a top AAA rating, but he thinks that by urging local governments to follow the state’s lead, it will strengthen their credit ratings as well. “If you take a portion — if not all – of those interest savings and put it toward another liability,” says Folwell, “it is a win-win in the eyes of the community, the state and the rating agency.”
GOVERNING.COM
BY LIZ FARMER | MARCH 8, 2017
Changes are likely on the way, and they could damage budgets.
The direction set by Ben Carson, the new Department of Housing and Urban Development secretary, will have immense impacts on localities. For starters, federal housing programs make up 40 percent of federal transfers to local governments. That’s a big chunk of change even as federal transfers overall have been in a long-term decline.
Before we go on, here are some key numbers: Since 1977, the share of local government revenue from non-tax sources has remained fairly steady at 60 percent of general revenue. But the composition of non-tax revenue has changed. The portion from intergovernmental transfers declined from 43 percent of general revenue in 1977 to 36 percent in 2013, while revenue from charges and fees increased from 15 percent to 23 percent. Likewise, while the share of general revenue from local taxes has remained at about 40 percent, the composition of tax revenue has changed. The contribution of property taxes to general revenue declined from 34 percent in 1977 to 30 percent in 2013, while revenue from sales taxes increased from 5 percent to 7 percent.
Bottom line: Whether or not Carson makes any changes to federal transfer monies, the pressure on local taxes is real. On property taxes, the least popular of the three possible local taxes, the pressure is especially immense.
Consider Pennsylvania. In January, Gov. Tom Wolf recommended a three-pronged approach to helping distressed cities. Along with state economic aid and easing municipal pension debt, he suggested providing property tax relief. If his plan is successful — and legislators in Harrisburg seem open to it — it would help city residents by cutting the biggest single local tax bill they pay. “Places like Scranton would see a big drop in the tax bill and a big increase in property values,” the governor told The Scranton Times-Tribune. His January comments came in the wake of action taken by the Pennsylvania House, which passed a bill to replace nearly $5 billion worth of property taxes with higher state income and sales taxes. The state Senate narrowly rejected a bill to mostly eliminate property taxes with that same combination of higher state taxes.
Once localities are dependent on state taxes — rather than property tax revenue — they are at greater peril. The property tax may have its up and downs, but it is by and large a fairly steady income stream and one that’s under a locality’s control. State payouts are prey to budget cuts when there’s a downturn in the economy.
The affordability of housing, which also has a huge impact on localities, is spiraling in an unfortunate direction. Mortgage rates have been on the rise and are likely to continue to inch up. Federal policy could be a further threat. Both the mortgage-interest deduction from federal income taxes and tax-exempt housing bonds are at risk in the new Congress. Meanwhile, the nation’s housing inventory is nearly 10 percent below a year ago, and the homeownership rate has fallen close to a 51-year low.
Rental affordability is an even bigger problem. Between 2001 and 2013, we lost 2.4 million rental housing units (both market-rate and subsidized) that were affordable to people making less than 50 percent of area median income. In addition, 106,000 public housing units and 146,000 project-based rental assistance units were lost, according to an Urban Institute report, which also noted that some 450,000 more units are at risk of disappearing or deteriorating.
Building more units or preserving existing ones would help, but with a very large federal deficit, and proposed steep federal tax cuts, it appears unlikely that traditional HUD programs will be able to fill the gap. Chances are that HUD will experience significant budget cuts, which means both Community Development block grants and housing assistance to states and localities will be diminished.
That’s not a pretty housing picture for cities, their pocketbooks and their housing stock.
GOVERNING.COM
BY FRANK SHAFROTH | MARCH 2017
The credit quality of U.S. municipal water and sewer utilities is generally strong, with almost half of the sector considered highly rated with debt ratings of ‘AA-‘ or higher. In our analysis of the group according to our criteria, S&P Global Ratings found that highly rated utilities have in common certain credit characteristics.
Broadly, the sub-group stands out for having:
A replacement for the Affordable Care Act (ACA)—promised by Donald Trump and Republican leaders–has now been put forth for Congressional consideration. There had been much speculation about the details, but the main provisions of the proposed American Health Care Act (AHCA) are not a surprise.
Mar. 8, 2017
Bonds for health care systems have long been a staple of the high-yield municipal bond market. I believe that they are closer to low-risk tax-backed and utility revenue bonds, which have extremely low default rates which approximate .5% an issue over the entire life of those bonds.
Bonds for senior living communities, development district “dirt bonds”, tobacco bonds and corporate “industrial development bonds can have default rates over the life of those bonds that range from 8%-15%. It is estimated that hospital bond defaults in range between 3%-4% over their life.
There is a wide spectrum of health care bonds. Bonds issued by large multi-state issuers have the lowest risk, because no single hospital default would drag down the rest of the system. Lower risk however means lower yields. Then then there is an array of single site hospitals, with varying degrees of risk. I prefer hospitals that have national or international demand, perhaps because of the specialty they may offer such as state-of the art pediatric, heart and/or cancer services. I also look for balance sheets containing at least 150-200 days of cash on hand to meet recurring monthly expenses, and cash equaling or exceeding outstanding debt.
Finally, there are “Critical Access Hospitals”, small units in rural areas where patients cannot reach acute care facilities within driving distance. These hospitals obtain special subsidies to allow for their operation under sparse resources.
Risks in this sector are considerable because competition from new hospitals can drain resources from older hospitals. However, health care represents a vital public service, and will continue unless technology provides an alternative. At this point, it is fruitless to ascertain changes to ObamaCare until the President and Congress “show their cards.”
Dick Larkin, Credit Analyst for Stoever Glass
March 6, 2017
Dick Larkin is a former Chief Municipal Rating Officer for S&P. Stoever Glass is a 54 year-old Investment firm specializing in Municipal Bonds located in New York & Florida. A registered Broker/Dealer, Member FINRA, SIFMA, & SIPC. Advisory Services through Stoever Glass Wealth Management, Inc., a registered advisory firm.
Fitch Ratings-New York-07 March 2017: The congressional bill released yesterday by House Republicans to repeal and replace the Affordable Care Act (ACA) includes significant changes to Medicaid that expose states to new fiscal and policy risks, says Fitch Ratings. States generally maintain significant flexibility to deal with fiscal challenges, including shifts in federal funding, while maintaining fundamental credit quality. As Medicaid represents approximately one-third of state budgets, the fundamental changes proposed could challenge that flexibility. Implications for lower levels of government including school districts, cities, counties, and public higher education institutions that rely on state support could be more significant given their generally more constrained budgetary flexibility. Hospital and skilled nursing home providers would be at risk of reduced coverage eligibility, reduced reimbursement for services provided or both.
First, the House Republican American Health Care Act (AHA) proposes ending Medicaid’s entitlement structure and moving states to a per capita cap system on Jan. 1, 2020. The per capita cap structure proposed in AHA is intended to slow the growth in federal Medicaid spending by limiting increases in federal spending to a measure of medical inflation and shifting risk for higher costs to states, providers and enrollees. The Kaiser Commission on Medicaid and the Uninsured estimates that the March 2016 House Budget Resolution (which included the option of per capita caps or block grants for Medicaid) would reduce federal spending on traditional Medicaid by $1 trillion (or 26%) over 10 years. The Congressional Budget Office (CBO) has not yet released its official estimates of AHA’s effect on the federal budget.
Reducing federal Medicaid funding anywhere near 26% over 10 years would require states to make significant budgetary changes. Without CBO estimates of the full magnitude of the AHA’s proposed reductions in federal spending, it is difficult to assess how effectively states could prepare for these changes. Effects for each state will also vary, depending on their per capita spending levels for Medicaid in the fiscal 2016 base year under AHA. House Republicans and the President have previously indicated states could utilize unspecified new flexibility to offset the reduced funding. Fitch notes that current law already offers states discretion to implement Medicaid within federal statutes and rules, and also creates a waiver process for additional flexibility. Currently, every state has at least one waiver in place. And during the last two recessions, the states implemented a wide range of changes in Medicaid operations and financing (with and without waivers), including a pronounced shift to managed care. As such, it is unclear that any additional flexibility provided by the federal government would be sufficient to offset the funding cuts.
Second, the AHA ends new enrollment in the Medicaid expansion and the enhanced federal match that 31 states and the District of Columbia have opted into, on Dec. 31, 2019. Under AHA, states that expand before that date will continue to receive the enhanced federal funding envisioned under current law for the newly eligible population under the expansion. But the enhanced funding would only apply to those individuals who were enrolled prior to Dec. 31, 2019. Over time, the newly eligible population would roll off, as would the associated enhanced federal funding. The federal Department of Health and Human Services (HHS) estimated 9.1 million people received insurance coverage under state Medicaid expansions in federal fiscal year 2015. With the enhanced matching rate (100% in 2015 and phasing down to 90% by 2020 under current law), HHS estimates the states received $58.1 billion in federal funding to provide that coverage in 2015.
Under AHA, expansion states would not risk immediately losing the billions in federal funding for the newly eligible. But they will be faced with a unique policy predicament of denying Medicaid access to individuals who would otherwise qualify beginning in 2020, or taking on significant costs they had anticipated would be borne largely by the federal government.
The 19 non-expansion states, and health care providers operating within them, could see short-term benefits under AHA. The bill establishes a $2 billion annual pool of federal funding available from 2018 to 2021 to states that do not expand to offset their payments to Medicaid providers, presumably because of higher uncompensated care levels. Similarly, AHA limits planned reductions in Medicaid’s disproportionate share (DSH) funding provided to states for safety-net providers to $3 billion annually instead of $8 billion under current law. Under AHA, non-expansion states are exempt from even these more limited DSH cuts. All states, and the District of Columbia, would be subject to the more long-term and consequential implications of the AHA’s per capita cap system for Medicaid financing described above.
The AHA released yesterday is the first public draft of major legislation that will likely be the subject of intensive lobbying efforts and potentially significant revisions. Beyond the Medicaid provisions noted above, the legislation also includes wide-ranging changes to other aspects of the healthcare industry that could directly or indirectly affect state and local governments including public health funding, the individual marketplace, and related tax provisions. But the House Republican leadership has laid out an aggressive timeline with the first committee hearings scheduled for Wednesday. The bill appears broadly in line with the President’s healthcare goals outlined in his recent address to Congress and he released a brief statement indicating his support for the AHA.
Fitch will continue to closely monitor legislative developments around the AHA, which could have implications for states’ credit quality as well as for related public finance entities and healthcare providers. Medicaid changes that significantly reduce federal funding will cause states to consider a broad mix of revenue increases or spending cuts to maintain long-term fiscal balance. Local governments, school districts and higher education institutions could face fiscal stress in adjusting to reduced state support. In a time of already muted revenue growth, spending cuts could affect K-12 and higher education the most, as those are the other largest areas of state spending outside of Medicaid. Similarly, changes that result in rising uninsured and uncompensated care levels and reduced reimbursement to hospitals, health systems and long term care providers would be a negative credit development and likely pressure healthcare provider performance over the longer term.
Contact:
Eric Kim
Director
+1-212-908-0241
Fitch Ratings, Inc.
33 Whitehall Street
New York, NY 10004
James LeBuhn
Managing Director
+1-312-368-2059
Amy Laskey
Managing Director
+1-212-908-0568
Media Relations: Elizabeth Fogerty, New York, Tel: +1 (212) 908 0526, Email: elizabeth.fogerty@fitchratings.com.
Additional information is available on www.fitchratings.com
Gil Crain Memorial Research Grant
Since its formation in 1984, the Governmental Accounting Standards Board (GASB) has encouraged academics and other researchers to conduct studies that would be relevant to the GASB’s standards-setting activities. For more than 30 years, such research efforts have resulted in publishing their research in peer-reviewed journal articles, GASB research briefs, and occasionally in GASB research reports.
The GASB hopes to encourage more collaborative research efforts with academics by offering one or two $5,000 research grants, to be awarded by the end of June 2017.
Topics include:
DALLAS – Congress needs to craft sector-specific legislation to fund the renewal of U.S. highways, airports, and other infrastructure rather than a single, all-encompassing measure for all, Sen. Deb Fischer, R-Neb., suggested to state highway officials meeting in Washington.
Finding the federal funding needed for President Donald Trump’s $1 trillion infrastructure renewal program would be easier if the problem were to be broken down into its various components, Fischer said Thursday in her keynote address to the annual winter gathering of the American Association of State Highway and Transportation Officials.
“I think it would be very difficult to have one big, huge, comprehensive infrastructure bill dealing with roads and bridges, ports, airports, broadband, pipelines, all of these items,” Fischer said. “We would end up with better policy if we would take each section of our infrastructure needs and address them with specific pay-fors but also to meet the different needs of all the separate sectors.”
Funding the five-year, $305 billion Fixing America’s Surface Transportation Act passed in late 2015 required almost $70 billion of general fund transfers to support the declining federal gasoline tax and other revenues dedicated to the Highway Trust Fund, Fisher noted.
“Finding pay-fors for a trillion dollars is difficult,” she said.
Fischer’s proposal for a number of sector-specific funding measures would conflict with the aspirations for a single infrastructure funding bill outlined to the same group on Wednesday by Rep. Bill Shuster, R-Pa., chairman of the House Transportation and Infrastructure Committee.
“The main thing is going to be an infrastructure package, and it will cover everything—rail, transit, highways, aviation, and pipelines,” Shuster said during his remarks. “We’re going to have a big, broad bill.”
Fischer said she is optimistic that infrastructure renewal will be the prime focus of the Trump administration.
“President Trump has spoken frequently about the need to invest in our transportation infrastructure,” she said. “It is not stimulus, it is an investment in our economy and in our national security.”
The measure she introduced last month to divert $21.4 billion per year of fees, duties, and taxes collected at U.S. borders and entry points by Customs and Border Patrol to transportation projects would solve the most immediate problems facing the HTF, Fischer said.
The border fee revenues totaled $46 billion in fiscal 2015 but the agency uses only $2 billion of the collections for operational needs, she said.
The diversion that would be authorized by her Build the USA Infrastructure Act (S. 271) would begin when the FAST Act expires at the end of fiscal 2020 and continue for five years, Fischer said.
The bill would extend the solvency of the HTF and restore the purchasing power of the 18.4 cent per gallon federal gasoline tax that has been lost to inflation since the tax’s last increase in 1993, she said.
“America needs a new plan,” Fischer said. “By using this existing revenue stream we will provide stability to the Highway Trust Fund. We can do that without increasing taxes or fees.”
Rep. Peter DeFazio, D-Ore., the top Democrat on the House transportation panel, told the state officials earlier that his three-part infrastructure proposal would provide up to $60 billion per year of additional funding for roads, airports, and seaports. The first of the three bills, the one on airports (H.R. 1265), was introduced Wednesday.
The plan includes indexing federal fuel taxes to the wholesale price of gasoline and diesel, dedicating an existing federal harbor tax strictly to port maintenance, and allowing airports to raise their passenger facility charge to support additional bonds for terminal projects and other related infrastructure, he said.
The indexing proposal would raise the gasoline tax by about 1.2 cents per year to support up to $33 billion of road bonds per year for 15 years, DeFazio said.
“We need more substantial federal funding,” he said.
The Bond Buyer
By Jim Watts
March 3, 2017
WASHINGTON – The dollar volume of municipal bond trading soared higher last year than in any year since 2012, the Municipal Securities Rulemaking Board found in its 2016 Fact Book released Monday.
The total par amount traded reached $3.14 trillion, almost 30% higher than in 2015. The last time that amount was surpassed was 2012, when it reached almost $3.23 trillion, according to the statistics book.
Of that amount, customers bought a total par amount of $1.58 trillion, sold $947.08 billion, with interdealer trades totaling $609.52 billion.
By tax status, almost $2.71 trillion of the par amount traded was tax-exempt, $256.21 billion was taxable, $136.64 billion of securities traded were subject to alternative minimum tax and $32.67 billion was other.
By coupon type, the largest par amount traded was fixed rate, at $1.78 trillion, followed by variable rate, at $1.01 trillion, zero coupon securities, at $107.34 billion, and other, at $230.52 billion.
The total number of trades last year was almost 9.36 million, only about 1.1% above the 9.26 million trades in 2015. The highest total number of trades over the past five years was 10.63 million in 2013. The vast amount of the number of trades last year was tax-exempt, at almost 8.60 million, and fixed rate, at 8.81 million.
The top most actively traded securities by par amount of trades last year were $7.31 billion of the Industrial Development Board of the Parish of East Baton Rouge, La, Inc. revenue bonds for an ExxonMobil project. The bonds were issued in 2010 and are slated to mature in 2035. That was followed by $5.64 billion of Puerto Rico Sales Tax Financing Corp. sales tax revenue bonds sold in July 2007 with a maturity of 2054.
The top most actively traded securities by number of trades was St. John Baptist Parish La.’s fixed revenue bonds for a Marathon Oil Corp. project issued in 2007 with a 2037 maturity. There were 8,092 trades of these bonds last year. The second highest was 4,205 trades of Illinois State taxable general obligation pension bonds issued in 2003 with a 2033 maturity. Following that was 4,093 of trades of Commonwealth of Puerto Rico public improvement refunding bonds issued in 2012 with a 2041 maturity.
The Fact Book shows a steady drop in registered dealers in recent years. Last year there were 1,448 registered dealers, down 6% from 1,541 in 2015. The 2015 figure is down 5.2% from 1,625 in 2014. The most dealers – 1,787– were registered in 2012 during the past five years.
Last year the top five dealers accounted for 48% of the par amount of trades, and the top 10 dealers accounted for 69% of them. The top five dealers accounted for 35% of the number of trades last year and the top 10 were responsible for 52% of them.
The MSRB looked at continuing disclosures submitted and found that the number of financial submissions rose to 98,084 in 2016, up slightly from 97,379 in 2015, but below the peak of 101,289 in 2014. Material event submissions dropped to 63,586 last year from 68,309 in 2015 and a peak of 74,340 in 2014.
The Bond Buyer
By Lynn Hume
March 6, 2017
Calculating an appropriate discount rate to measure the net liability for postemployment benefits is a critical financial accounting and reporting issue for state and local governments. The long-term expected rate of return is a fundamental component used in developing the discount rate. As can be seen by the sensitivity disclosures required by the postemployment benefits standards, a change of just 1 percentage point in the discount rate can have for many plans a significant impact on the net liability.
In justifying the long-term expected rate of return, one often hears “historical investment performance supports that rate.” The standards, however, address the long-term expected rate of return. Historical data can be inconsistent with the forward-looking nature of this expectation and is not a complete source for the development of long-term anticipations about future economic phenomena.
The long-term expected rate of return should be based upon the nature and mix of current and expected postemployment benefit investments. That means the postemployment benefit investments must be expected to be invested using a strategy to achieve that return.
During the development of the postemployment benefits standards the Board concluded that it was not within the scope of the Board’s activities to set standards that establish a specific funding method for postemployment benefits–that is a policy decision for government officials or other responsible authorities to make. Accordingly, the postemployment benefits standards set requirements in the context of accounting, not funding. This is a very important distinction, as one also often hears “we will reduce the discount rate gradually over time, that’s all we can afford now.” Affordability is a funding issue, not an accounting issue.
The accounting standards require the use of the long-term expected rate of return to develop the discount rate–funding affordability is not a component to be considered in determining the long-term expected rate of return when developing the discount rate for financial accounting and reporting purposes. To appropriately comply with the postemployment benefits standards for financial reporting purposes, it is critical that governments measure the net liability for postemployment benefits using a discount rate based on an accounting perspective–one that appropriately incorporates the long-term expected rate of return–not a rate based on a funding affordability perspective.
FROM THE CHAIRMAN
BY DAVID A. VAUDT, GASB CHAIRMAN
The Trump administration promises to pump $1 trillion into improving the country’s crumbling infrastructure, but a benchmark report says it will take almost $4.6 trillion over the next eight years to bring all those systems up to an acceptable standard.
The price tag for redemption has grown steadily for 15 years while an expanding country has focused on building new infrastructure rather than maintaining existing systems that were nearing the end of their natural life.
Since 2001, the cost of repairing those systems has mushroomed from $1.3 trillion to the current figure, more than three times as high, according to an assessment released Thursday by the American Society of Civil Engineers (ASCE). The report comes out every four years.
It gave the U.S. infrastructure an overall grade of D-plus, the same grade it received in 2013, “suggesting only incremental progress was made over the last four years.”
“President Trump is on to something when he calls for a national rebuilding,” ASCE President Norma Jean Mattei said in presenting the study. “But Congress and the American people have to pay for it.”
She said lawmakers should raise the federal gas tax by 25 cents and index it to inflation.
Trump reiterated campaign promises on infrastructure in his inaugural address and in his recent address to Congress, but the only supporting detail for that pledge thus far has been an 11-page white paper issued in October. In that document, Trump said the money would be raised by granting private investors an 82 percent tax credit that would encourage them to pump money into infrastructure projects.
“We can use private financing for the major things, but it’s a slice of investment,” said former Pennsylvania governor Ed Rendell (D), who now co-chairs the advocacy group Building America’s Future. “You can’t do it on the cheap. It’s time for Congress to suck it up and vote for real [federal] investment.”
Rendell said the “fix it first” approach that Trump espouses — repairing needy infrastructure before launching new projects — is not likely to draw private investors.
Congressional leaders and state and local officials have made clear that while private investors might put money into select projects in urban areas from which they can expect a return, they would shy away from investment in rural areas and would rather build new infrastructure than repair systems that have deteriorated.
“I think the federal government has to play a larger role,” said Connecticut Gov. Dan Malloy (D).
Infrastructure underpins everyday life in the United States, covering far more than the roads and bridges commonly thought of when the word comes to mind. It includes a vast network of other systems that most people take for granted, including drinking water and sewer service, the delivery of electricity, as well as railroads, transit systems and ports.
The ASCE has been chronicling the decline of infrastructure category by category since 1998, when it took over the task that had been handled for a decade by the National Council on Public Works Improvement.
In recent years, most of the 14 categories the ASCE has assessed have received a D, and hardly any has moved by more than a fraction of a grade. For example, inland waterways were judged to improve from a D-minus to a D, while transit systems declined from a grade of D to a D-minus.
The commentary provided with each grade was revealing:
Airports (D): Congestion at airports is growing, with 24 of the big airports expected to achieve “Thanksgiving-peak traffic volume” at least one day each week.
Bridges (C-plus): Four in 10 of the country’s 614,387 bridges are more than 50 years old and near the end of their designed life span. Nearly 59,000 are structurally deficient.
[Nearly 59,000 bridges in U.S. are structurally deficient]
Dams (D): An estimated 2,170 of the country’s 90,580 dams are considered as “high-hazard potential” because of failed upkeep.
Drinking water (D): There are 240,000 water-main breaks each year, wasting 2 trillion gallons of water.
Electricity (D-plus): Most electrical transmission lines were built in the 1950s and 1960s with a 50-year life expectancy, and they are running at maximum capacity everywhere but Alaska and Hawaii.
Ports (C-plus): Mega-ships now arriving from the Far East and able to transit the newly expanded Panama Canal can call on very few of the 926 U.S. ports unless channels are dredged to accommodate their deeper drafts.
Railroads (B): The private freight railroads that own most U.S. rail track invested $27.1 billion to upgrade systems in 2015 and continue that investment.
Roads (D): Traffic backups cost $160 billion in wasted time and fuel in 2014, and about 20 percent of highway pavement is in poor condition.
Transit systems (D-minus): Though they carried 10.5 billion trips in 2015, chronic underfunding and aging infrastructure have led to a $90 billion repair bill.
ASCE Executive Director Thomas W. Smith III cited an urgent need for the White House to deliver a comprehensive plan for infrastructure restoration.
“Our nation’s infrastructure is making headlines for all the wrong reasons,” Smith said. “While we haven’t seen action [from the White House], we have to hold feet to the fire.”
The Washington Post
By Ashley Halsey III
March 9, 2017
Washington, DC, March 9, 2017 – SIFMA today issued the following statement from Michael Decker, managing director and co-head of SIFMA’s Municipal Division, on the American Society of Civil Engineers 2017 Infrastructure Report Card:
“While showing some incremental progress towards improving our nation’s infrastructure since the 2013 ASCE Report Card, the 2017 ASCE Report Card clearly shows the desperate need for a strong commitment to infrastructure investment, which will help spur job creation and economic growth. SIFMA strongly advocates that the tax exemption for municipal bond interest remain intact, so that it may continue to help America’s cities and states boost their local economies through the construction of new projects such as roads, hospitals and schools. Meaningful public-private partnerships should also be a key component of any plan, as they will ease the burden on the cash-strapped federal government by leveraging our capital markets to create expanded financing options.”
Taylor Riggs, a contributor to Bloomberg Briefs, talks with Editor Joe Mysak about this week’s municipal market news.
Bloomberg
March 2, 2017
Robert Amodeo, Western Asset Management head of municipal securities, discusses President Donald Trump’s infrastructure plan with Bloomberg’s Joe Weisenthal and Scarlet Fu on “What’d You Miss?”
Bloomberg
February 28, 2017
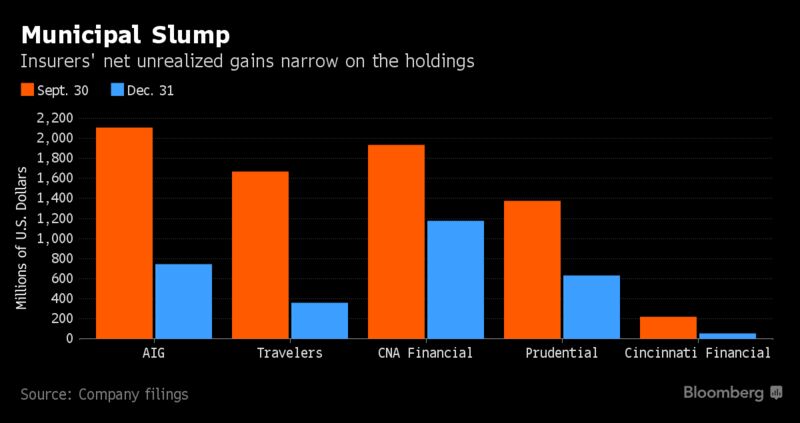
New York — The disruption in the municipal bond market is punishing some of the most loyal buyers of the debt.
The insurance industry has seen more than $5bn of gains erased on state and local bonds after Donald Trump’s victory in the presidential race, with American International Group and Travelers among the hardest-hit companies.
While the yield on state and local debt is typically exempt from federal taxes, that advantage would be diminished if Trump follows through on plans to lower the levy on all corporate profits. Beyond that, investors are concerned that an overhaul of federal laws could end the favourable treatment on so-called munis.
There were “just crazy amounts of ‘What ifs?’ at this time”, said Peter Block, managing director for credit strategy at Ramirez & Co, a New York-based underwriter. Beyond that, he said, the stock rally led to a shift in allocation as some traditional muni investors “saw that equities were just on a tear, and they wanted a part of that”.
Travelers, the only property-casualty insurer in the Dow Jones Industrial Average, had unrealised gains on its $32bn municipal portfolio narrow to $360m on December 31 from $1.7bn just three month earlier, according to regulatory filings.
The gain at AIG was just $747m at the end of 2017, about a third of the figure from September 30. CNA Financial, Prudential Financial, Cincinnati Financial and Alleghany also endured declines in their portfolios.
Many types of bonds lost value after the election, as investors bet on economic growth under Trump. In most cases, insurers welcomed the shift because yields climb when the securities lose value. That could help boost investment income on the trillions of dollars in corporate debt, Treasuries and mortgage-backed securities that the industry holds to back obligations to policyholders.
‘Less Attractive’
On munis, however, where insurers accepted lower yields in exchange for tax benefits, the changing economics could leave more of a sting. If the corporate tax rate is lowered to 25% from 35%, the benefit of holding municipal debt versus AA-rated corporate debt would diminish substantially, said Matt Caggiano, who helps oversee more than $9bn in insurer municipal holdings at Deutsche Bank.
“Now you have a Republican president and a Republican House and Senate,” he said. “They all would like to decrease the corporate tax rate. That could really make munis less attractive to insurance companies.”
Municipal debt has trailed a risk-matched basket of US Treasuries by about 16 basis points since Election Day in November, according to the Bank of America Merrill Lynch index data. Still, big insurers pride themselves on being able to hold securities through market fluctuations.
“We do not expect property-and-casualty insurers sell large portions of their municipal portfolio outright, but rather partially redirect proceeds away from tax-exempts as their municipal holdings mature,” Barclays analyst Mikhail Foux said in a January note to investors.
The declines in unrealised gains do not count against earnings, but do reduce book value, a measure of financial strength monitored by investors and analysts. P&C insurers account for about 10% of the $3.8-trillion municipal market.
‘Non-Trivial’
Investors are still waiting for clarity from Washington, as the Trump administration and Congressional Republicans have sent mixed signals. If legislators reduce rates on corporations and individuals, they could seek to limit tax breaks to help replace the lost revenue.
Trump is unlikely to support the complete elimination of the muni exemption, given that the debt supports infrastructure projects, according to Municipal Markets Analytics. Still, the chance has increased for a “negative adjustment”, according to the research firm.
“Obviously, a lot is going to be determined by the shape of any tax legislation,” Travelers chief investment officer William Heyman said in the New York-based company’s fourth-quarter earnings call when discussing the outlook for as far off as 2019. “At the very extreme, if you needed a revenue-neutral bill, and the municipal exemption itself were affected, that would be non-trivial.”
Shares of Travelers and AIG both declined this year through Monday, even as the S& P 500 Financials Index is up about 5.3% since December 31. To be sure, the insurers have been hit by other surprises as well, including higher-than-expected claims costs.
Relative Value
At Chubb, another insurer with significant muni holdings, said this month that it was too early to say whether the company would reduce its exposure. The company hadn’t released its 10-K filing for 2016 as of Monday night.
“We’re running scenarios at different tax rates to determine the impact of the portfolio,” chief financial officer Phil Bancroft said on a February 1 conference call. “So we’re evaluating it. And we’ll look at it in light of the tax developments that emerge over the next months.”
BUSINESS DAY
LISA DU, ROMY VARGHESE AND SONALI BASAK
28 FEBRUARY 2017 – 19:18 PM
© 2017 Bloomberg LP
Sales of U.S. municipal bonds and notes will jump to $10.39 billion next week, bolstered by large deals from California, Maryland, and New York City, according to preliminary Thomson Reuters data.
Leading the deals next week is $2.4 billion from California of general obligation various purpose and refunding bonds. The deal is managed by Citigroup Global Markets.
Last year California surpassed France to become the world’s sixth-largest economy, after years of robust state revenues and economic growth. In the fiscal year beginning last July, revenues have wavered somewhat, coming in just slightly below projected estimates.
The state of Maryland plans to issue next week almost $1.2 billion of general obligation bonds, state and local facilities loans.
The New York City Transitional Finance Authority plans to issue $800 million of future tax secured tax-exempt subordinate bonds, led by JPMorgan.
U.S. municipal bond funds reported $346.2 million of outflows this week, breaking a seven-week streak of net inflows. Municipals finished weaker on Thursday, following the direction of Treasuries. Uncertainty surrounding the Fed’s next action created some volatility in rates this week, reported Janney Fixed Income Strategies.
Next week’s calendar will be made up of approximately $2.7 billion from the competitive calendar and of roughly $7.7 billion from the negotiated calendar, according to preliminary data.
(Reporting by Robin Respaut; Editing by Phil Berlowitz)
DALLAS — Figuring out how to pay for a massive program to rebuild the national transportation infrastructure is one of the biggest, most complex questions facing the Trump administration and Congress, Transportation Secretary Elaine Chao said Sunday in her first public appearance since taking office on Jan. 31.
There is currently no consensus on Capitol Hill or across the country on the best ways to finance infrastructure renewal, Chao told the state executives at the National Governors Association’s winter meeting in Washington.
“Everybody wants a better transportation system but very few people want to pay for it, so that’s a big conundrum,” she said.
The $305 billion Fixing America’s Surface Transportation Act that passed in late 2015 provided five years of federal transportation funding to the states but that required the infusion of some $70 billion of general fund transfers to the Highway Trust Fund, Chao pointed out.
“There are a number of ways for improving critical infrastructure, but the pay-fors are going to be hard,” she said. “There will be a lot of discussion about pay-fors and that will be a tremendous challenge. I think that if we all decide that there are things that we think are very important, we all need to come to a national consensus about how to do that.”
Chao pushed back on reports last week that Republican leaders in Congress hope to defer the infrastructure funding debate into 2018 as lawmakers deal this year with reforming health care, immigration, and the tax code.
“There seems to be bipartisan support for addressing the infrastructure needs of our country. So if not now, when? I believe the time is now,” she said. “There’s no better time in my recent memory than now for the recognition that the infrastructure of our country is critical.”
Chao provided no additional details on the $1 trillion, 10-year infrastructure program that the Trump campaign unveiled in late October, but said President Trump will discuss the issue when he addresses the NGA on Monday and then again during his speech to a joint session of Congress on Tuesday night.
“The president is very futuristic-looking,” Chao said. “He’s thinking about a transportation system and an infrastructure system that includes not only transportation but other aspects of critical infrastructure that will make us more competitive internationally.”
The president’s futuristic outlook includes high-speed rail as a component in a 21st century transportation network, she said.
Chao said she met recently with sponsors of the proposed privately funded HSR system between Dallas and Houston.
“High-speed rail is part of the thinking of the future of transportation systems in our country,” she said. “This is not to say they are without problems. Eminent domain is a huge issue with any of high-speed rail projects.”
The Trump plan relies on attracting private investments to revenue-generating infrastructure, but public-private partnerships are not the only tool in the president’s toolbox, Chao said.
“We do look forward to public-private partnerships but that is not the answer to everything,” she said. “There is a lack of consumer acceptance for toll roads in certain areas.”
This would be the best time in years for Congress to fix infrastructure funding, said Bud Wright, executive director of the American Association of State Highway and Transportation Officials.
“This is one of those rare times when infrastructure is a principal topic in Washington, D.C.,” Wright said. “From the presidential campaign to now, infrastructure seems as though it is going to be at the forefront of [Trump’s} policy agenda.”
Hundreds of state highway executives will be in Washington this week to lobby their congressional delegations on the need for a long-term, sustainable source of transportation funding, he said.
“We know we have a Highway Trust Fund that’s broken,” Wright said.
The Bond Buyer
By Jim Watts
February 27, 2017
DALLAS – Administration officials began deliberating with federal agencies over President Trump’s $1 trillion infrastructure initiative on Thursday after a key lawmaker said funding is still a question and a Congressional Budget Office report criticized the use of tax exempt bonds.
Congress is not going to write a $1 trillion check to pay for the infrastructure renewal program promoted by President Donald Trump in his address to the joint session of Congress, Rep. Bill Shuster, R-Pa., told a group of state highway officials on Wednesday.
“It’s not going to be a trillion dollars coming out of Washington, D.C.,” Shuster told officials at an American Association of State Highway and Transportation Officials conference.
The bulk of the money is expected to come from private investors but some additional federal funding will be required, said Shuster, chairman of the House Transportation and Infrastructure Committee.
“There obviously has to be more money coming out of Washington, D.C.,” he said. “But there are billions and billions of dollars out there today, private sector dollars that are going to be spent.”
Representatives from at least 15 federal agencies were to meet at the White House on Thursday to begin formulating the administration’s infrastructure proposal. So far the only information comes from a proposal by the Trump campaign in late October that called for $1 trillion of private investments in infrastructure over 10 years.
Thursday’s meeting chaired by Gary Cohn, director of the National Economic Council, was expected to focus on financing and funding options, identifying new projects and those that could be expedited, as well as rules and regulations that hinder infrastructure projects.
Whether Trump’s program calls for more federal funding or providing $137 billion of federal tax credits to leverage more public-private partnerships or both, Congress must find the revenue to support the program, Shuster said.
“How do we get that money?” Shuster said. “That’s the trillion-dollar question.”
The additional funding will likely come from a variety of revenue sources, including repatriation of overseas earnings of U.S. corporations and higher user fees, he said.
“How we are going to get the dollars, I can’t stand up here and tell you,” Shuster said. “But I can say it is an ‘all of the above’ solution.”
Shuster however has ruled out funding infrastructure through an increase in the federal gasoline tax or relaxing the prohibition on the tolling of existing interstate highways.
“It’s going to take an array of things here in Washington,” he said. “There’s not one single silver bullet. Everything has to be on the table.”
Shuster scoffed at reports that lawmakers will defer action on an infrastructure plan until 2018 to work this year on higher-priority issues such as healthcare, tax reform, and immigration.
“We’re going to do a lot of things in committee but the main thing is going to be an infrastructure package, and it will cover everything—rail, transit, highways, aviation, and pipelines,” he said. “We’re going to have a big, broad bill.”
The nonpartisan Congressional Budget Office said in a report released Wednesday that the transportation P3s promoted by the Trump proposal would do little to increase the money available for highway construction.
“Revenues from the users of roads and from taxpayers are the ultimate source of money for highways, regardless of the financing mechanism chosen,” said Chad Shirley, CBO’s deputy assistant director for microeconomic studies. “Most [projects] do not involve tolls or other mechanisms to collect funds directly from their users or beneficiaries.”
Eliminating the tax-exemption from municipal bonds would result in more rational infrastructure spending, Shirley said.
“Tax-exempt bonds are a relatively inefficient way to subsidize state and local governments’ investment in infrastructure, because the revenue cost to the federal government may substantially exceed the interest-cost subsidy provided to the state and local governments,” he said.
The Bond Buyer
By Jim Watts
March 2, 2017
Editor’s note: This is the second in the Mission, Money & Markets article series by the Kresge Social Investment Practice team. See all articles at http://www.kresge.org/mission-money-markets.
Back in 1812, the municipal bond market was born when the City of New York issued the first recorded municipal bond for a public purpose canal. Since this first issuance, community impact has been central to this market.
This is the Kresge Foundation’s Mission, Money & Markets Social Investment logo
Municipal bonds are debt securities issued by a state, county, city or municipal district to finance capital expenditures – from the canals of the past to the schools, public facilities, mass transit systems and affordable housing developments of today. This market issues more than 13,000 bonds annually to undergird the operations and infrastructure of nearly 44,000 municipalities and other districts. Together, it accounts for $3.7 trillion in total debt and more than $400 billion flowing into American communities each year, according to Bond Buyer.
The scale, scope, and public focus of this market has led us to ask: How does the municipal bond market intersect with The Kresge Foundation’s mission to create opportunities for low-income people in American’s cities? And how might we influence the market to put greater consideration on the long-term impact of socioeconomic characteristics, such as income inequality, on the fiscal outcomes of cities?
February 27, 2017 3:00 PM EST
By Kimberlee Cornett and Napoleon Wallace
The Kresge Foundation
In the days of civil unrest following the fatal shooting of unarmed black teenager Michael Brown by a police officer in Ferguson, Missouri, a few foundations asked Ryan Bowers and his co-founders of Frontline Solutions consultancy for advice on how to do some rapid response grantmaking in and around the city. As natural conveners, Bowers and his colleagues’ first instincts were to arrange a series of site visits with activists and national funders. The experience brought attention to an existing connection between the foundations and the structural violence that served to fuel that same unrest.
“In looking at how to get philanthropic capital on the ground, we started to look up and see how foundations’ invested endowment capital was also playing a role in all that,” Bowers says.
The U.S. Department of Justice’s report on Ferguson connected the dots, Bowers remembers. It documents how Ferguson’s police enforcement focused on revenue generation instead of public safety. It details tactics used to boost fines and fees to become the city’s second-largest source of revenue. The report cited a 2014 Bloomberg story that put the connection in plain sight: Without those revenues, the article outlined, Ferguson’s municipal bond ratings would have dipped, severely limiting the city’s ability to finance infrastructure, public building construction and other long-term needs.
Investors, including most typical foundation endowments, hold $3.8 trillion in municipal bonds issued across the United States, and there are more than $400 billion in new municipal bonds issued annually. They’re an attractive investment, given that the interest earned from them is federal tax exempt. For foundations that generally have to disburse 5 percent of the value of their endowments annually, municipal bonds, or muni bonds as they’re known, are a no-brainer asset to hold.
After credit rating company Moody’s eventually downgraded Ferguson’s municipal bond rating, things clicked for Bowers and company. Even while the community knew what was happening, with regard to fees and fines, “ratings agencies hadn’t yet incorporated that into their methodology,” Bowers says.
“We knew there were tons of other Fergusons out there that just hadn’t blown up yet to become a national story, just below the surface,” he adds. “This was an opportunity to get this on the radar of the ratings agencies, investors and municipalities themselves.”
That spark led to the creation of Activest, a platform to drive “financial, structural and community change” through the municipal bond market. Bowers and Activest co-founders want to mobilize people around the idea that racially and socially unjust policies aren’t just immoral, they’re also terrible fiscal policy, as they sow the seeds of civil unrest and stalled economies.
In the era of President Donald Trump, that notion may be more important than ever. So-called “sanctuary” cities face possible federal penalties if local police don’t enforce federal immigration policy. Put that in the context of large-scale funding sources that have been drying up for years: Funding for HUD’s community development block grants peaked in 1995, and has fallen nearly every year since.
“Our thinking is that cities are more desperate for money, you’re going to see more desperate policies at the local level to raise revenues and that’s going to hurt poor families,” Bowers says.
Bowers thinks there will be opportunities for municipal bond holders to be more like activist shareholders, reinforcing positive behaviors like sanctuary cities and pushing back against bad behaviors like over-reliance on fees and fines, or maybe even racial segregation in housing and schools. It’s a carrot-and-stick approach, with the added benefit of putting at least some large-dollar investors on the same side as movements like Black Lives Matter and the fight against the Dakota Access Pipeline.
“We think we can start to create a municipal justice index, and give cities a score on how their social impact practices compare to each other,” Bowers says. “We want cities to take credit for the things they’re doing really well but also put pressure on the things they’re really bad at.”
“Among investors committed to social justice, such as our members, Activest provides a unique opportunity to be more thoughtful about the structural and systemic impacts of municipal finance allocations,” says Andrea Armeni, executive director of Transform Finance Network of investors, which includes foundations as well as high net-worth families, investment asset managers and other like-minded investment groups oriented around social justice.
“Not all municipal finance is created equal,” Armeni adds, pointing to the example of Chicago’s municipal bonds issued to raise funds for payment of legal settlements in police brutality cases.
In its ultimate incarnation, Activest will help ratings agencies and investors incorporate racial and social justice metrics into the predictive models they use to judge financial health of investments, starting with municipal bonds — and they hope that communities can help shape such predictive models at the grassroots level.
The first step in that direction is figuring out what data is already out there or what data communities could produce that would display a correlation, positive or negative, between racial or social justice and long-term fiscal health. Bowers and his colleagues have been looking at dependency on fees and fines for municipal revenue, data on civil forfeiture (the confiscation of cash or sellable assets even without a trial), average bail or bond amounts, or legal financial obligations — fines and fees in the justice system that gather and sometimes accumulate interest while one is incarcerated.
“And we’re also working with some data scientists to do some predictable statistical modeling to get ahead of the Fergusons before they bubble over,” Bowers says. “We’re also looking for some more nuanced social indicators that are correlated to financial outcomes, including indicators sourced through local partners in place to gather data and funnel it up to us.”
Unfortunately, it’s not entirely certain any of the above will matter at all. Trump has not quite publicly ruled out removing the tax exempt status of municipal bonds as part of anticipated comprehensive tax reform. The municipal bond market has already seen prices dip as a result of the uncertainty.
“If you remove that status, it will dry up this market,” says Bowers.
EQUITY FACTOR
BY OSCAR PERRY ABELLO | MARCH 2, 2017
The Equity Factor is made possible with the support of the Surdna Foundation.
President Donald Trump’s administration will convene a meeting of at least 15 federal agencies Thursday as a first government-wide step toward crafting the president’s $1 trillion infrastructure initiative, a senior White House official said.
Gary Cohn, director of the National Economic Council, will lead the meeting, which will focus on identifying new projects that would boost the economy; finding existing projects, such as the Keystone XL pipeline, that could be expedited; targeting policies, outdated rules and laws that could delay projects; and developing funding and financing options, the official said.
The meeting follows Trump’s speech to a joint session of Congress on Tuesday, when he said he wants to leverage public-private partnerships and public capital to upgrade crumbling roads, bridges, ports and other infrastructure. The official, who spoke on condition of anonymity, said that all funding options are currently on the table. Lawmakers and policy experts have floated ideas that include taxing corporate profits that are parked overseas and creating an infrastructure bank.
The official said that a proposal will be developed and presented to Trump, but the timing is uncertain.
Most U.S. infrastructure is owned and controlled by states and municipalities, so the federal government’s role is more regulatory. Trump has already issued an executive order to expedite environmental reviews and permitting for high-priority projects.
‘Percolate Up’
The National Governors Association provided to the White House a list of 428 priority projects from 49 states and territories on Feb. 8 that it had solicited from the states. How projects will be selected for funding has yet to be determined, the White House official said.
Governors from both political parties, interviewed at their annual winter meeting in Washington last weekend, said they expect to play a key role in those decisions.
“At the end of the day, I think it’s going to percolate up from the governors,’’ said Virginia Governor Terry McAuliffe, a Democrat and president of the National Governors Association. “They can’t get this done in Congress without us.’’
Republican Governor Mary Fallin of Oklahoma, a former member of the House Transportation and Infrastructure Committee, echoed McAuliffe’s concern. “It’s important to have that state input into what is a national priority,’’ she said.
Trump, meanwhile, has been building his team to work on the plan. The White House announced on Tuesday that DJ Gribbin will serve as a special assistant to the president for infrastructure policy, under Cohn. Gribbin, a former chief counsel for the Federal Highway Administration and general counsel for the U.S. Department of Transportation, has worked on public-private partnership deals for Macquarie Capital USA Inc.
‘Every State’
During his speech to Congress, Trump called for “a new program of national rebuilding,” likening the initiative to President Dwight D. Eisenhower’s construction of the interstate highway system across the U.S.
Lawmakers are anxious for details. Representative Peter DeFazio of Oregon, the top Democrat on the House Transportation and Infrastructure Committee, said it’s “time to put some flesh” on Trump’s proposal. “What’s missing is a real plan and the money,” DeFazio said after Trump’s speech on Tuesday.
Representative Bill Shuster of Pennsylvania, the Republican chairman of the House Transportation and Infrastructure Committee, said he’s met with Trump and his policy staff and told them there have to be projects in all states.
“We should look at every state and say what are the projects that are going to bring the states along,” Shuster said Wednesday at a meeting of the American Association of State Highway and Transportation Officials in Washington.
Democrats including DeFazio and even some Republicans have argued that trying to rely on the private sector alone won’t generate $1 trillion of investment or allow projects in all parts of the U.S. Deals involving private investment require a revenue stream such as tolls, which aren’t popular or even practical in rural or thinly populated areas.
Spurring Investment
Democratic congressional leaders support more spending on infrastructure but say that the proposed mechanisms to spur private investment — such as a tax credit — would only benefit the wealthy. Republican congressional leaders have made it clear they won’t support a significant increase in spending that isn’t offset by cuts so that it doesn’t add to the debt or deficit.
The White House official said it’s premature to speculate what the mix of private and public funding and financing might be.
U.S. Transportation Secretary Elaine Chao said her office was exploring new ways to finance infrastructure, including through public-private partnerships, to attract private investment and remove barriers.
“Business as usual is just not an option anymore,” Chao said Wednesday at the transportation officials’ gathering in Washington. “Everyone can agree that our country can no longer take decades to build a new bridge or a new road, a new highway or airport.”
Bloomberg Politics
by Mark Niquette
March 1, 2017, 2:00 PM PST
A roundup of money (and other) news governments can use.
GOVERNING.COM
BY LIZ FARMER | MARCH 3, 2017
A federal fund that supports evidence-based social programs in state and local government may end under President Donald Trump.
The Social Innovation Fund, an Obama-era initiative, has issued nearly $300 million in government grants since its inception in 2009. The money has gone to projects aimed at housing the chronically homeless, employing jobless adults and providing health care to the uninsured, among other things. Because the program requires grantees to seek additional matching dollars, it has generated more than $1 billion in combined public and private investment.
But late last month, The New York Times reported that a memo from the White House Office of Management and Budget recommended the elimination of nine federal agencies. Among them was the Corporation for National and Community Service, which is best known for running AmeriCorps but also operates the Social Innovation Fund.
The Trump administration has not commented on the report, but the president’s budget blueprint calls for roughly $54 billion in cuts to nondefense programs.
Under the Social Innovation Fund, proposals can’t receive funding unless research suggests they would work, and every project must undergo evaluation to see if it gets the intended result. It’s a radical change in how federal dollars are spent.
“Success has often been determined by how much money did we spend or how many people did we serve instead of the outcomes that we got,” says Jeremy Ayers, vice president of policy for Results for America, a nonprofit that promotes the use of evidence in government.
If Trump’s budget does call for the elimination of the Social Innovation Fund, Congress could ignore his recommendation, and there are reasons to think that might happen. Past efforts to discontinue the fund failed, and Republicans, including House Speaker Paul Ryan, have championed the broad idea of evidence-based policy.
Still, the fund’s advocates are working to protect it.
“We’re rallying the troops to show Congress that there is support for this work and also there is a real impact and consequences if this work does not continue to be funded,” says Ayers.
Results for America has sent a letter in support of the fund — as well as several other evidence-based programs — to the ranking members of the House and Senate appropriations committees. Most of the 187 signatories are nonprofits and academic groups, but the list includes the mayors of Philadelphia and Salt Lake County, several public school districts, the chief of performance improvement for Louisville, Ky.; the cities of Boise, Idaho, and Menlo Park, Calif.; and Cook County, Ill. A number of former federal officials also signed the letter, including former directors of the White House Domestic Policy Council under presidents George W. Bush and Barack Obama.
A long list of state and local governments have benefited from the fund, particularly in getting “pay-for-success” programs up and running. Pay-for-success programs minimize the government’s risk by leveraging private funding for evidence-based experiments aimed at solving public problems. If the project works — for example, if prisoner recidivism is reduced — then outside funders get reimbursed for their investment. The arrangements are still new and complex, requiring nonprofits and academic centers with experience in the field to assist government partners.
Not all of the recipients have been for pay-for-success projects though.
The Mayor’s Fund to Advance New York City, a nonprofit started by then-New York City Mayor Rudy Giuliani, has been awarded $34.5 million from the federal fund for a range of antipoverty initiatives. One such program, Family Rewards, provided cash assistance to low-income families in exchange for fulfilling certain tasks, such as having the children score proficient on standardized tests, attend school regularly and stay up-to-date on health and dental checkups.
GOVERNING.COM
BY J.B. WOGAN | MARCH 1, 2017
The disruption in the municipal bond market is punishing some of the most loyal buyers of the debt.
The insurance industry has seen more than $5 billion of gains erased on state and local bonds after Donald Trump’s victory in the presidential race, with American International Group Inc. and Travelers Cos. among the hardest-hit companies. While the yield on state and local debt is typically exempt from federal taxes, that advantage would be diminished if Trump follows through on plans to lower the levy on all corporate profits. Beyond that, investors are concerned that an overhaul of federal laws could end the favorable treatment on munis.
There are “just crazy amounts of ‘What ifs?’ at this time,” said Peter Block, managing director for credit strategy at Ramirez & Co., a New York-based underwriter. Beyond that, he said, the stock rally led to a shift in allocation as some traditional muni investors “saw that equities were just on a tear, and they wanted a part of that.”
Travelers, the only property-casualty insurer in the Dow Jones Industrial Average, had unrealized gains on its $32 billion municipal portfolio narrow to $360 million on Dec. 31 from $1.7 billion just three month earlier, according to regulatory filings. The gain at AIG was just $747 million at the end of 2017, about a third of the figure from Sept. 30. CNA Financial Corp., Prudential Financial Inc., Cincinnati Financial Corp. and Alleghany Corp. also endured declines in their portfolios.
Many types of bonds lost value after the election, as investors bet on economic growth under Trump. In most cases, insurers welcomed the shift because yields climb when the securities lose value. That could help boost investment income on the trillions of dollars in corporate debt, Treasuries and mortgage-backed securities that the industry holds to back obligations to policyholders.
‘Less Attractive’
On munis, however, where insurers accepted lower yields in exchange for tax benefits, the changing economics could leave more of a sting. If the corporate tax rate is lowered to 25 percent from 35 percent, the benefit of holding municipal debt versus AA-rated corporate debt would diminish substantially, said Matt Caggiano, who helps oversee more than $9 billion in insurer municipal holdings at Deutsche Bank AG.
“Now you have a Republican president and a Republican House and Senate,” he said. “They all would like to decrease the corporate tax rate. That could really make munis less attractive to insurance companies.”
Municipal debt has trailed a risk-matched basket of U.S. Treasuries by about 16 basis points since Election Day in November, according to the Bank of America Merrill Lynch index data. Still, big insurers pride themselves on being able to hold securities through market fluctuations.
“We do not expect property-and-casualty insurers sell large portions of their municipal portfolio outright, but rather partially redirect proceeds away from tax-exempts as their municipal holdings mature,” Barclays Plc analyst Mikhail Foux said in a January note to investors.
The declines in unrealized gains don’t count against earnings, but do reduce book value, a measure of financial strength monitored by investors and analysts. P&C insurers account for about 10 percent of the $3.8 trillion municipal market.
‘Non-Trivial’
Investors are still waiting for clarity from Washington, as the Trump administration and Congressional Republicans have sent mixed signals. If lawmakers reduce rates on corporations and individuals, they could seek to limit tax breaks to help replace the lost revenue.
Trump is unlikely to support the complete elimination of the muni exemption, given that the debt supports infrastructure projects, according to Municipal Markets Analytics. Still, the chance has increased for a “negative adjustment,” according to the research firm.
“Obviously, a lot is going to be determined by the shape of any tax legislation,” Travelers Chief Investment Officer William Heyman said in the New York-based company’s fourth-quarter earnings call when discussing the outlook for as far off as 2019. “At the very extreme, if you needed a revenue-neutral bill, and the municipal exemption itself were affected, that would be non-trivial.”
Shares of Travelers and AIG both declined this year through Monday, even as the S&P 500 Financials Index is up about 5.3 percent since Dec. 31. To be sure, the insurers have been hit by other surprises as well, including higher-than-expected claims costs.
Relative Value
At Chubb Ltd., another insurer with significant muni holdings, said this month that it was too early to say whether the company would reduce its exposure. The company hadn’t released its 10-K filing for 2016 as of Monday night.
“We’re running scenarios at different tax rates to determine the impact of the portfolio,” Chief Financial Officer Phil Bancroft said on a Feb. 1 conference call. “So we’re evaluating it. And we’ll look at it in light of the tax developments that emerge over the next months.”
Bloomberg Politics
by Lisa Du, Romy Varghese, and Sonali Basak
February 28, 2017, 5:01 AM PST
Fitch Ratings-New York-01 March 2017: In the president’s speech to Congress last night and in details of a budget plan disclosed on Monday, the administration proposed and affirmed broad policy goals that could significantly affect state and local governments, but essential details remain unknown. The future of the Affordable Care Act, Medicaid financing, an infrastructure plan, and even federal education funding were all topics in the speech or budget proposal – but state and local governments remain without clear guidance on how possible changes will affect them.
On the Affordable Care Act (ACA) and Medicaid, President Trump’s speech listed five principles to guide legislative deliberations. These principles were broad in scope, but generally consistent with the recently released House Republican Obamacare Repeal and Replace Plan from House Speaker Paul Ryan. Other than an explicit statement supporting the use of tax credits, the president’s speech added no new clarity on the administration’s view for the role of the federal government in healthcare.
The federal Department of Health and Human Services (HHS) estimated that in federal fiscal year 2015, 9.1 million people received insurance coverage under state Medicaid expansions authorized under the ACA. With the ACA’s enhanced matching rate (100% in 2015 and phasing down to 90% by 2020), HHS estimates the states received $58.1 billion in federal funding to provide that coverage in 2015. The Ryan plan phases down that ACA funding significantly over an unspecified transition period. The president’s speech was not clear on the administration’s view of that decrease.
Medicaid represents approximately one-third of state budgets so changes to the program, such as ending the open-ended federal commitment, could have material effects on state fiscal conditions. The president’s healthcare principles included a statement to provide governors “the resources and flexibility they need with Medicaid to make sure no one is left out.” Regarding the ACA Medicaid expansion, the speech hinted at some support for continued federal funding for the newly eligible. But the reference to flexibility implies support for a block grant or per capita cap program as envisioned under the Ryan plan, to trade limits on federal spending for unspecified new flexibility for states on implementation. Fitch anticipates states would likely respond with health care spending cuts, cuts to other programs such as education, and revenue measures.
In his speech, President Trump reiterated his support for legislation to support new infrastructure investment of up to $1 trillion. The president’s statement on infrastructure did not include a specific commitment of federal direct funding and instead referenced creating a legislative structure to support a mix of public and private investment. This aligns with President Trump’s campaign proposal (co-authored by the incoming Secretary of Commerce and head of the White House’s new National Trade Council) to use tax credits, rather than direct federal funding, to encourage private investment. More clarity is still needed on how non-revenue-generating projects will be financed as the opportunities for investment in user-fee-supported infrastructure will be only a limited subset of the overall need.
The president’s speech also included an educational legislative priority that could affect state and local governments, urging congress to enact legislation that provides federal funding to support school choice, including for charter and private schools. Fitch notes that expansion of charter schools has generally been neutral to negative for competing public school districts’ fiscal conditions. Any proposals to provide new federal aid to charter schools, or redirect existing traditional public school aid, could exacerbate challenges for school districts, such as Philadelphia and Los Angeles Unified, already struggling to adjust to ongoing enrollment shifts. School districts would need to address any reduced federal aid through spending cuts or additional revenue sources. As the current situation in Chicago demonstrates, urban school districts can be challenged to find additional room for cuts and have limited independent revenue raising capacity in many states.
Monday’s disclosure of details on the president’s upcoming budget proposal also leaves open questions for state and local government. The proposal reportedly includes an additional $54 billion in defense spending, offset with a commensurate reduction in federal discretionary funding. For state and local governments, 70% (approximately $400 to $500 billion) of federal aid comes for mandatory programs (primarily Medicaid), which are reportedly not subject to cuts in this proposal. The largest single discretionary program potentially subject to the $54 billion reduction is federal highway aid ($40 billion). Given the president’s repeated statements on infrastructure investment, Fitch views cuts in federal highway aid as unlikely. Absent highway aid cuts, it remains unclear how the president’s budget plan would affect state and local governments. The administration has indicated changes to mandatory programs (which include Medicaid) will follow after the administration formally releases the budget plan in mid-March.
Contact:
Eric Kim
Director
+1-212-908-0241
Fitch Ratings, Inc.
33 Whitehall Street
New York, NY 10004
Laura Porter
Managing Director
+1-212-908-0575
Amy Laskey
Managing Director
+1-212-908-0568
Media Relations: Elizabeth Fogerty, New York, Tel: +1 (212) 908 0526, Email: elizabeth.fogerty@fitchratings.com.
Additional information is available on www.fitchratings.com
In a major water rights case that pits the practical needs of drinking water system operators against environmentalists, conservationists, and some state and tribal governments, the Court of Appeals for the Second Circuit decided recently that water transfers for drinking water systems are exempt from the Clean Water Act pollution permitting program.
In upholding the 2008 Water Transfers Rule, the Second Circuit Court of Appeals held that the U.S. Environmental Protection Agency was entitled to exclude water system transfers from the National Pollutant Discharge Elimination System (NPDES) permitting requirements. The plaintiffs argued that such water transfers could move harmful pollutants from one body of water to another. Catskill Mountains Chapter of Trout Unlimited, Inc. v. EPA (Catskill III), 14-1823, (2d Cir., 2017).
The dispute bears the hallmark of a case bound for the U.S. Supreme Court, as national environmental organizations, led by Trout Unlimited, Inc., fishermen, sportsmen, Riverkeeper, Inc. and northeastern states, including New York, Connecticut, Delaware, Illinois and Maine, line up against the EPA, western states, and water districts and utilities from San Francisco to New York City and South Florida.
“Because New York City cannot tap the rivers, bays, and ocean that inhabit, surround, or, on occasion, inundate it to slake the thirst of its millions of residents, it must instead draw water primarily from remote areas north of the City, mainly the Catskill Mountain/Delaware River watershed west of the Hudson River, and the Croton Watershed east of the Hudson River and closer to New York City,” Judge Sack waxed poetically in a lengthy opinion that even starts out quoting poetry.1
Water transfers, which drinking water systems have been conducting for decades, connect and convey water supplies between two water bodies before any end user, such as an industrial, commercial or municipal consumer, uses the water. While EPA had never required such water transfers to become subject to the NPDES permitting requirements of the Clean Water Act, it ultimately enacted the Water Transfer Rule to respond to a growing chorus from environmental and conservation groups that claimed water transfers can move harmful pollutants from one water body to another.
The court analyzed the case using the classic two-step analysis set forth by the U.S. Supreme Court in Chevron v. Natural Resources Defense Council (referred to as “Chevron deference”), pursuant to which the Court first determines if the language of the statute at issue clearly proscribes the matter and, if not, whether the agency’s interpretation of the statute is reasonable. After concluding that the Clean Water Act does not expressly address water transfers and, therefore, inferring that Congress must have decided to defer to the EPA the interpretation of the statute to water transfers, the Court examined the reasonableness of EPA’s judgment. “The agency provided a sufficiently reasoned explanation for its interpretation of the Clean Water Act in the Water Transfers Rule,” the Court explained.
Among the justifications for EPA’s reasoning, the Court relied on the longstanding practice of and Congress’s acquiescence to water transfers, practical concerns regarding compliance costs (the defendants’ arguments in the case indicated compliance costs could exceed $4.2 billion), and the existence of alternative means for regulating pollution resulting from water transfers. New York City argued that it would be required to construct an expensive water treatment plant if an NPDES permit were required for its transfers. Other federal statutes, including the Safe Drinking Water Act, provided an acceptable alternative to regulation, the Court concluded.
Footnote
1.”Water, water, everywhere/Nor any drop to drink,” by Samuel Taylor Coleridge’s The Rime of the Ancient Mariner (1798).
Last Updated: February 16 2017
Article by Stephen J. Humes
Holland & Knight
Stephen J. Humes is a Partner in our New York office.
The content of this article is intended to provide a general guide to the subject matter. Specialist advice should be sought about your specific circumstances.
A wave of water debt will hit the U.S. municipal bond market next week as part of $4.48 billion in bond and note sales by states, cities, schools and other issuers, according to Thomson Reuters estimates on Friday.
The California Infrastructure and Economic Development Bank will issue $450 million of top-rated clean water state revolving fund revenue bonds.
The debt is structured with serial maturities from 2018 through 2036, according to the preliminary official statement.
Underwriter Morgan Stanley has scheduled a Tuesday retail order period for the so-called green bonds ahead of formal pricing on Wednesday.
New York City’s Municipal Water Finance Authority will sell $375 million of water and sewer second general resolution revenue bonds. Senior underwriter Siebert Cisneros Shank & Co will hold a retail presale period for the bonds on Monday with formal pricing on Tuesday.
Among competitive offerings, Maryland’s Baltimore County will sell $199.1 million of bonds and $121 million of bond anticipation notes on Wednesday. Clark County, Nevada, has set a $317.78 million general obligation bond bank refunding bond sale for Wednesday.
Meanwhile, U.S. municipal bond funds reported a seventh-straight week of net inflows. The week ended Feb. 22 had $149.3 million of net inflows, down from $480 million in the previous week, according to Lipper, a unit of Thomson Reuters.
(Reporting by Karen Pierog; Editing by James Dalgleish)
GFOA’s Executive Board recently approved five best practices in the areas of treasury and investment management, retirement and benefits, and municipal debt. GFOA best practices identify specific policies and procedures that contribute to improved government management. They aim to promote and facilitate positive change rather than merely to codify current accepted practice. GFOA has emphasized that these practices be proactive steps that a government should be taking. Best practices are applicable to all governments (both large and small), are approved by the GFOA executive board, and represent the official position of the organization.
New best practices include:
To help governments understand and implement the best practices, GFOA will be holding an internet training seminar on April 20, 2017 title New GFOA Best Practices.
Wednesday, February 15, 2017
Kroll Bond Rating Agency (KBRA) has released a new research report entitled “Mixing Oil and Water – A Credit Short Story.” This report makes the following key points:
WASHINGTON – The Government Finance Officers Association’s executive board has approved a series of new and revised best practices that make recommendations to issuers about refundings, investing their public funds, and procuring financial services.
The best practices also touched on issuers’ use of electronic payments and designs for defined contribution retirement plans.
Kenton Tsoodle, vice chair of GFOA’s debt committee, said the recommendations are the result of the committee’s annual reviews to update or add best practices. The one on refundings of munis is a revision that recommends issuers establish guidelines to preserve future flexibility and set formal objectives as well as monitor refunding opportunities. It also urges issuers that do not have a dedicated debt management staff or expertise in analyzing refunding opportunities to engage a municipal advisor.
Tsoodle said the revisions center on urging issuers to consider more than the net present value savings they want to see from refundings. It suggests issuers also consider negative arbitrage efficiency, which takes into account an issuer having to pay back bonds up to the call date after a refunding.
The recommended practice also tells issuers to consider how much interest rates would have to rise by the call date to produce savings matching those that could be realized with an advance refunding as well as how much value there is in a call feature.
Tsoodle said the debt committee felt they should expand on this guidance even though it was previously discussed.
“One of the biggest things was trying to emphasize that net present value savings is not the only metric that issuers should be looking at,” Tsoodle said. “The typical 35% savings that a lot of people look at is absolutely something issuers should consider but the best practice is also pointing out that there are some other metrics to look at as well.”
He added that the committee recognizes these are “very complex topics.”
“We were trying to just mention them in a brief way so that issuers, especially new [issuers] or issuers that are unfamiliar with these topics, could at least get mildly educated enough … to ask a municipal advisor about them,” Tsoodle said.
The best practice also encourages issuers to identify and monitor potential refunding opportunities through a combination of spreadsheet-based debt tracking and analysis of current interest rates. Issuers should additionally analyze their decisions about investing proceeds of advanced refundings and be sure to explain the purpose of a refunding if it is not to produce debt service savings, GFOA said.
When it comes time to move forward with a refunding, GFOA recommends an issuer meet with its bond counsel and MA and, when hiring an outside bond financing team, use a competitive process.
The committee’s new best practice on creating an investment program for public funds notes that governments have a fiduciary responsibility in managing their funds. An investment program for public funds will help issuers meet that duty, GFOA said. Issuers should establish such a program by: developing an investment leadership team; identifying the funds being invested and their cash flow characteristics; reviewing all applicable laws and regulations; establishing a risk profile; determining the portfolio management team; and creating an investment policy. The best practice on financial services contracts urges issuers to review them every five years and use a competitive hiring process that includes criteria like quality of servicing staff and regulatory standing.
Governments should also use electronic payments for all payments, in part to prevent fraud.
Issuers should consider a list of design elements GFOA included in a separate best practice if they choose to provide a defined benefit contribution plan, GFOA said.
The Bond Buyer
By Jack Casey
February 16, 2017
Taylor Riggs, a contributor to Bloomberg Briefs, talks with Editor Joe Mysak about this week’s municipal market news.
Bloomberg
February 23, 2017
“At least for the immediate future, all signs appear to be pointing to a slowdown in corporate and municipal debt issuance,” said Richard Peterson, Senior Director, S&P Global Market Intelligence. “While that sentiment is reflected in current investor behaviour, it will be instructive to watch the CUSIP issuance dataset for any signs of a potential change in the coming weeks and months.”
While President Trump talks repeatedly about fixing America’s inner cities, it’s a good bet that in the coming years, New York and other large metropolitan areas will need to be more self-reliant in solving pressing problems, especially low-income housing.
After all, many big cities face a triple threat: Mr. Trump wants to cut funding to sanctuary cities; his nominee to run the Department of Housing and Urban Development, Ben Carson, is unlikely to be a strong and creative leader; and the Republican Congress is eager to chip away at federal housing programs. In response, cities need local financing initiatives that make up for the coming reduction in federal assistance.
Fortunately, there’s an already tested alternative: an annual luxury housing tax, levied on new high-end condos and rentals, which would feed a self-sustaining fund dedicated to develop truly affordable units.
While no city has such a plan in place, this strategy has been tried right here in New York. The city has already channeled approximately $1 billion from luxury development for affordable housing into communities like Harlem and the South Bronx.
The history of this financing dates back three decades, when the Battery Park City development in Lower Manhattan was in its nascent stages. Planners intended to include low-income housing with the offices and luxury apartments and condos.
But when Sandy Frucher, the head of the Battery Park City Authority, asked leaders of poor and minority communities if they would prefer a few apartments in this new neighborhood or money to fix up far more housing in their own, he says they chose the latter.
As part of this strategy, the authority dropped most of its affordable housing plans, which helped jump-start high-end development in this once isolated part of the city. It then took a slice of the “excess profits” the authority generated from expanding ground rents and real estate taxes it collected from new buildings and directed them to finance low-income projects in distressed areas.
These recurrent flows backed a $150 million bond, issued in 1987. Use of debt expedited renovation. Improved units, which were designated rent stabilized, remain affordable to this day.
This highly rated, triple-tax-free issuance enabled reasonable interest costs. The same thing could happen today with similarly structured bonds, likely paying less than 1 percent.
Gov. Mario M. Cuomo, who approved the deal, felt it gave Battery Park City a soul. Today, a similar plan would also give the city a hand up in dealing with Washington.
Levying a luxury-housing tax citywide is straightforward; the trick is justly defining what price makes a rental or condo “luxury,” then determining an appropriate annual tax rate.
Targeting properties for improvement is another challenge. Back when the Battery Park City program started, the city regularly took ownership of rundown buildings for failure to pay property taxes, then used the program’s money to fix them up.
Abandoned buildings have largely disappeared in a booming real estate market, but there’s still tax-delinquent and bank-foreclosed inventory available on the cheap. Slum landlords in litigation could be forced to turn over their properties. These properties could be handed to nonprofit groups that would undertake renovations, ensuring adequate maintenance and responsible tenancy.
According to Carol Lamberg, who was executive director of one such organization, the Settlement Housing Fund, from 1983 to 2014, there are dozens of well-run nonprofit housing and community development operations in the city that could manage the entire process, from site identification and redevelopment to tenant selection and property management.
The money could finance new construction over municipal parking lots and abandoned industrial areas and along coastlines in the Bronx, in Brooklyn and on Staten Island.
But this luxury housing tax diverges from Mayor Bill de Blasio’s “inclusive” strategy of mixing struggling tenants in with affluent occupants, for which developers get a tax credit. But that approach has problems: Low-income residents often can’t afford daily living expenses in affluent neighborhoods; it drains municipal finances; and a substantial number of affordable units revert to market price within 30 years.
An affordable-housing tax, in contrast, would exploit development forces without dampening them or draining public budgets and borrowing capacity. It would fund improvement where it’s not happening and aid households the market has left behind.
Providing safe, clean homes for those who can’t afford them is key to helping needy citizens become more productive and independent citizens — a concept lost on President Trump.
This approach is applicable countrywide, where there are strong luxury housing markets and low-income working residents who can’t afford permanent shelter.
We need to start responding to President Trump’s new reality. One way to do this is to restart this proven form of local revenue sharing.
THE NEW YORK TIMES
By ERIC UHLFELDER
FEB. 21, 2017
WASHINGTON — President Donald Trump’s campaign promise for a $1 trillion infrastructure program will be in focus when U.S. governors gather on Friday in Washington, D.C., with some states making wish lists of projects ranging from a bullet train to statewide broadband internet service.
The winter meeting of the National Governors Association running through Monday is expected to showcase rare bipartisan agreement on the need for more federal help in upgrading roads, bridges and airports, said Scott Pattison, the group’s executive director.
“There’s just this pent-up demand to deal with, whether it’s a crack in a dam, a bridge, whatever it is,” Pattison said in a telephone interview.
Although there is little movement on Capitol Hill to make Trump’s infrastructure vow a reality, governors have sent the White House a list of 428 projects they say are ready to go with some extra federal spending.
The National Governors Association has not released the list but checks with some states hinted at the projects.
Democratic California Governor Jerry Brown has asked for $120 billion, saying that since the state made up 12 percent of the U.S. economy it deserves 12 percent of Trump’s $1 trillion package.
“We’re not talking about a few million, we’re talking about tens of billions,” Brown said of the infrastructure proposal this month as he sought federal aid to deal with a leaking dam and flooding.
Among California’s big-ticket items is construction of a high-speed rail system linking San Francisco and Los Angeles.
Colorado and Minnesota want help building statewide broadband systems, with Minnesota Governor Mark Dayton, a Democrat, saying his state needs $150 million for its broadband grid.
Republican Kansas Governor Sam Brownback’s top priority is $122 million for interstate highway repairs. South Carolina and Virginia want federal aid to deepen ports, among other projects.
In a letter to Trump, Republican Governor Henry McMaster said South Carolina also needed help replacing roads and bridges. “An appropriation of $5 billion from your infrastructure plan will help us bridge this economic gap,” he wrote.
Pattison said governors wanted a “toolbox” of financing options, including municipal bonds, cash, public-private partnerships and federal matching funds.
The governors are scheduled to meet with Trump on Sunday evening and again on Monday morning.
One of the speakers at the governors’ conference, Leo Hindery, a managing partner at New York’s InterMedia Partners, will tell state executives that creating a federal infrastructure bank is the only way to fund the hundreds of billions of dollars needed for public works.
The United States has long been criticized for its lagging public works spending. The American Society of Civil Engineers has graded U.S. infrastructure at D+ and estimated the country needs to invest $3.6 trillion by 2020.
During his campaign, Trump said he wanted action on infrastructure in his first 100 days as president. That now seems unlikely. He also talked about creating a tax credit to encourage private sector investment.
Trump’s plans to create an infrastructure council have yet to get started. Republican lawmakers have said they expect to get White House infrastructure proposals but have given no details or timing.
By REUTERS
FEB. 24, 2017, 6:12 A.M. E.S.T.
(Editing by Kevin Drawbaugh and James Dalgleish)
Fitch Ratings-New York-17 February 2017: Fitch Ratings’ recent ratings on the Port of Seattle and Santa Clara Valley Water District (SCVWD) demonstrate the uniquely rigorous approach towards assessing the legal basis for rating securities distinct from the Issuer Default Rating (IDR) under the new Tax-Supported Rating Criteria, according to a new Fitch report.
“Using the same methodology that resulted in several California school district security ratings distinct from the IDR, the Port of Seattle and SCVWD’s ratings underscore Fitch’s holistic, consistent approach to rating across the portfolio,” said Amy Laskey, Managing Director.
Fitch assigned an IDR of ‘AA-‘ to the Port of Seattle using our Global Infrastructure Airport and Seaport Rating Criteria with a variation to consider the strength and value of the tax revenues that could be made available to support operations. Similarly, Fitch assigned an IDR of ‘AA+’ to SCVWD using our Water and Sewer Revenue Bond Rating Criteria with a variation to consider tax revenue support.
Fitch upgraded the Port of Seattle’s intermediate and subordinate lien revenue bond ratings from ‘A+’ to be on par with the new IDR of ‘AA-‘, while the rating on outstanding LTGO bonds was downgraded to the level of the IDR from ‘AAA’. Similarly, for SCVWD, the district’s water revenue bonds and revenue certificates of participation were upgraded to the new ‘AA+’ IDR from ‘AA’, while the district’s flood control system COPs were downgraded one notch to the level of the IDR.
Security ratings are capped at the IDR unless Fitch believes there is a strong legal basis for concluding that bondholders are protected from operating risk. Fitch’s high bar for rating tax-supported bonds distinct from the IDR applies to enterprises, general governments, school districts, and other special districts.
For more information, a special report titled ‘Special Revenues, Bankruptcy and Default Risk’ is available on the Fitch Ratings web site at www.fitchratings.com.
Contact:
Amy Laskey
Managing Director
+1-212-908-0568
Fitch Ratings, Inc.
33 Whitehall Street
New York, NY 10004
Laura Porter
Managing Director
+1-212-908-0575
Thomas McCormick
Managing Director
+1-212-908-0235
Media Relations: Elizabeth Fogerty, New York, Tel: +1 (212) 908 0526, Email: elizabeth.fogerty@fitchratings.com.
Additional information is available at ‘www.fitchratings.com’.
The laws about public records differ from one government to the next and are further complicated by some technologies, like police body cameras.
In 2015, the editor of a newspaper in Florida filed a public records request with the Broward County Sheriff’s Office asking for the email of every employee during a five-month period to be searched for specific gay slurs.
In response, the South Florida Gay News received a $339,000 bill.
The office said fulfilling the request would take four years and require hiring a dedicated staffer. The exorbitant charge set off a year-long legal battle that attracted the Associated Press and its lofty resources. To show how arbitrary the number was, the AP and South Florida Gay News filed a similar request to the sheriff’s office in other Florida counties. They were quoted fees ranging from as little as $37 to more than $44,000.
Why then is there such a big range of costs for similar information?
Local and state laws regarding what constitutes the public’s domain are about as uniform as a patchwork quilt. And technology — or a lack thereof — further contributes to the increasing cost variance between jurisdictions.
New IT software, for the governments that can afford it, has certainly sped up the time it takes to fulfill requests and thus lowered the price of information. But in some cases, technology can complicate matters. This issue is particularly heightened when privacy concerns require time-consuming redaction work.
Take the emerging issue of police body cameras. People caught on video in homes or hospitals have a reasonable expectation of privacy, so faces need to be blurred or redacted — a process that some say requires a painstaking number of manhours. The New York City Police Department made news last year for charging a local TV station $36,000 for access to 190 hours of body camera footage.
Partially in an attempt to avoid the labor, some governments have limited the public’s access to police videos. So far, jurisdictions in 21 states have passed laws regarding body camera footage — most of them restricting it. The state of South Carolina has exempted the footage from public records requests altogether.
After receiving an imposing public records request for footage, the Seattle Police Department decided to hold a hackathon. The winner created software that automated some of the redaction process and now the police department uploads redacted body camera clips to YouTube for anyone to see.
Meanwhile, watchdog groups and media organizations that push for more transparency argue that redaction technology has evolved in recent years. Companies like MotionDSP are retooling their software to work faster, while companies like PRI Management will redact videos for agencies either for a per-video or annual fee.
Body cameras are a new technology, so inconsistency is understandable. Emails, on the other hand, aren’t so new and yet the cost of fulfilling a records request for them still varies greatly.
According to Frederic Smalkin Jr., a Baltimore City Law Department attorney, new software has easily cut down on the e-discovery process in his agency by half. Meanwhile, Andy Wilson, CEO of the data management company Logikcull, said he regularly speaks with governments that are still printing out emails and redacting by hand.
As new types of electronic records pop up — like text messages and Snapchats — governments will have to consider whether they apply to the public domain. The landscape will likely continue to be inconsistent from one jurisdiction to the next. But in the meantime, Adam Marshall of the Reporters Committee for Freedom of the Press, thinks governments could be doing better.
“The tools already exist for these types of records requests to be complied with,” he said. “The agencies need to be thinking about ensuring compliance with existing law when they adopt new technology.”
GOVERNING.COM
BY LIZ FARMER | FEBRUARY 14, 2017
The nation’s economic recovery accelerated in 2016, with more than 1 in 4 counties reporting a full recovery to pre-recession levels on four key economic indicators. That portion is a huge jump from last year when 1 in 10 reported fully recovering counties, according to the National Association of Counties (NACo).
The four indicators are: job totals, unemployment rates, economic output (GDP) and median home prices. Two-thirds of the nation’s more than 3,000 counties have recovered on at least three of the economic indicators.
Most of the counties that have fully recovered are in Kentucky, Iowa, Minnesota, Missouri, Nebraska, South Dakota, Texas and Wisconsin. In addition, the mid-Atlantic, the Northeast and the West Coast have many nearly-to-fully recovered counties. Large counties (more than 500,000 residents) had the highest rate of full recovery at 41 percent. In contrast, more than three-quarters of small counties (fewer than 50,000 residents) still had not reached their pre-recession peaks in any of the indicators by the close of 2016.
The Takeaway: Both the acceleration of the economic recovery and the fact that it’s mostly happening in very populated areas is widening the gap between the municipal haves and have nots. It also partly explains shifting political allegiances in some mid-sized counties in 2016.
Many of the approximately 200 mostly Midwestern mid-sized counties that voted for President Obama in 2008 and 2012, voted for President Trump in 2016. According to NACo’s analysis, these swing counties have experienced weaker job recoveries compared to the national average with more than half of them still below their pre-recession job peaks.
“While there’s a national storyline on the economy, it often plays out differently at the local level,” says lead report author Emilia Istrate, managing director of NACo Counties Futures Lab. “The wide variation in local conditions underlines the need for a strong federal-state-local partnership on providing economic opportunity for residents of communities of all stripes.”
GOVERNING.COM
BY LIZ FARMER | FEBRUARY 17, 2017
A debate in Texas could prove a greater threat to sanctuary city funding than Trump’s executive order denying federal funding to such cities. The Texas House of Representatives is taking up a bill already passed by the state Senate that aims to ban sanctuary cities. In Austin, for example, newly elected Travis County Sheriff Sally Hernandez has been in a standoff with Gov. Greg Abbott over her decision not to detain any unauthorized immigrants.
The bill, which is largely expected to pass, would fine jurisdictions and college campuses that don’t comply with federal immigration law, allow for criminal charges on elected or appointed officials who knowingly violate these rules, and deny state grant funds (except for grants involving money for body armor) to the jurisdiction.
The Takeaway: While state aid to cities is declining, many jurisdictions are vulnerable to significant changes. And, whereas there are many questions over the legality of a federal intervention into sanctuary cities, there are none in states. They can preempt local actions. So a defunding threat on the state level could make cities more inclined to buckle.
A lot depends on how reliant cities are financially on their states. Municipal analyst Matt Fabian notes that local aid levels are generally low in Texas, so the impact may be minimal. Austin, for instance, reported to the Senate that it has received $9.8 million in state grants in 2017 — a small portion of the city’s $1 billion general fund budget. Still, Fabian writes, “the net effect of state bans like these are likely to worsen state-local relations. In the context of near-certain federal aid cutbacks to the states over the next 10 years, a higher level of antipathy now only implies deeper pain to locals when cuts arrive.”
GOVERNING.COM
BY LIZ FARMER | FEBRUARY 17, 2017
Infrastructure may be the only area where bipartisan action by this Congress predictably can create large numbers of solid jobs, enhance growth and income opportunities for American investors, and help invigorate our economy. Our country needs it.
Yet with proposals starting at $150 billion and climbing quickly above $1 trillion (and then some), the government is burdened at all levels across the country with massive debt and unfunded liabilities may be unable to finance large projects without private money. Moreover, projects must be productive, locally-needed winners. No one wants more bridges to nowhere.
Fortunately, infrastructure is also popular outside Washington, both with voters and investors. Many investors are looking for long term, low risk, high quality investments. As a result, demand for infrastructure is pent up. A national initiative to repair and replace our crumbling highways, bridges, tunnels, ports, and railways (possibly adding schools, utilities, water and Internet, among others) will create top-shelf investment opportunities. This will benefit financial companies, but promises to help Main Street a great deal more.
Much is made of attracting new private funding, and with Congress sure to enforce geographic and other balancing factors to spread the wealth around, the primary financing option is likely to be tried and true municipal bonds. Many are low risk, offer attractive returns, and carry tax advantages. Municipal bonds paid for most of the iconic infrastructure that made America great.
The first option floated, the private-financing “Ross-Navarro plan” laid out by the Trump administration is unlikely to succeed. With Wilbur Ross and Peter Navarro joining President Trump’s economic and trade teams, the plan will get air time, but the idea of offering tax credits to attract private investors is unnecessary. Depending on how the plan is executed, it could prove inefficient or even unproductive.
The money is already there. Private equity firms have raised large amounts of capital for infrastructure, with some funds raising as much as $16 billion. Much of it sits idle, waiting for attractive projects. When good investment opportunities are presented, that money will move fast, with more behind. Investors will gladly accept tax credits but they do not need these subsidies. What they want are projects that make sense.
Congress and the executive branch can do something that would cost the U.S. Treasury nothing but would dramatically increase the odds of success: formulate a predictable, streamlined, regulatory permitting process. President Trump has vowed to kill “burdensome regulations,” and there are few areas where they have run more amok than infrastructure.
Take the New NY Bridge Project to replace the Tappan Zee Bridge across the Hudson River. It was proposed in 1999, but thanks to multiple agencies and jurisdictions throwing up a byzantine gauntlet of conflicting rules and regulation, it only became shovel-ready more than a decade later in 2013. Thus, the new bridge will cost many billions of dollars more than it would have in 1999.
Protecting the public good requires that federal, state, and local governments all be involved. That’s the American way. But it would be beneficial for projects to have coordinators, someone with the power to enforce an agreed-upon framework across the parties in the public and private sectors. The challenge will be to imbue the role with authority enough to keep projects on budget and on track.
Of course, with private money comes a desire for private proprietorship, which is accepted in Australia and Europe but relatively new to the United States. There is resistance here to selling ownership of what the American people believe should be assets in trust for the public benefit.
Chicago learned that the hard way when it privatized its parking meters. Meter prices doubled overnight. Thanks to a transaction poorly negotiated by the city fathers, private owners were rewarded handsomely while returning dubious long-term value to the city. Earning an attractive return is critical to attracting private money, but local authorities must ensure that each deal also serves the public good.
True top-dollar return projects will never lack for money—and that’s a good thing. We want to encourage as much private investment in public works as possible, but the solution will not be “new.”
Municipal bonds will continue to lead the financing effort. With them, we can build exciting projects, but equally important, the mundane, necessary projects that raise the quality of life for so many Americans. Tried and trusted remains the best choice.
THE HILL
BY ROBERT AMODEO, OPINION CONTRIBUTOR – 02/14/17 04:00 PM EST
Robert Amodeo, CFA, is head of municipal investments and portfolio manager at Western Asset Management, a California-based subsidiary of Legg Mason that manages more than $400 billion in assets.
Resolutions to block Department of Labor rules allowing states and large political subdivisions to set up private-sector retirement savings programs were passed by the U.S. House of Representatives Wednesday.
The resolution on state programs was approved by a vote of 231-193 and the political subdivision vote was 234-191. The Senate has not scheduled action.
The rules finalized in August for states and December for cities and other large political subdivisions, provide a safe harbor to allay concern that state and local programs would be pre-empted by federal regulators.
So far, 30 states and municipalities are implementing or considering state-facilitated, private-sector retirement programs, and eight of those states have passed legislation to set up programs. On Tuesday, 15 Treasury officials from Democratic and Republican states wrote to leaders of the House and Senate urging them to oppose the legislation. The rules, they said, provide “important flexibility to states and large municipalities as they seek to address the growing retirement crisis facing this country. We insist that states be allowed to maintain their constitutional rights to implement such legislation.” Their counterparts in New York City, Philadelphia and Seattle wrote a similar letter to House Speaker Paul Ryan, R-Wis.
Employer groups are worried about how each program will regulate employers that already offer retirement plans. “While well intentioned, the rules could hurt retirement savings and participants by discouraging plan sponsorship and limiting protections for workers,” Lynn Dudley, American Benefits Council senior vice president for global retirement and compensation policy, said in a letter to House leaders.
“If Republicans succeed in rolling back DOL regulations, they will destroy the best chance 63 million American workers have of getting access to a retirement plan,” said Teresa Ghilarducci, director of the Retirement Equity Lab at The New School in New York.
PENSIONS & INVESTMENTS
BY HAZEL BRADFORD | FEBRUARY 15, 2017 5:37 PM
— Contact Hazel Bradford at hbradford@pionline.com | @Bradford_PI
DALLAS – A bipartisan group of lawmakers is asking President Trump for a meeting to discuss how they can work together to build consensus on infrastructure investment and tax reform legislation.
“With a new president and Congress, Washington has the opportunity to show the American people that we understand their frustration and are committed to addressing their concerns,” the 35-member Problem Solvers Coalition said. “We are Democrats and Republicans who are eager to accomplish this task.”
The letter was sent just before an analysis of federal highway data by the American Road & Transportation Builders Association found that cars, trucks, and school buses cross almost 56,000 structurally compromised bridges some 185 million times each day.
The ARTBA review of data provided to the Federal Highway Administration by state transportation departments show that 28% of U.S. highway bridges are at least 50 years old and have never had any major reconstruction work.
The report showed Iowa has the largest number or structurally deficient bridges, at 4,968 –20.5% of its total inventory of bridges. Rhode Island’s 192 structurally deficient bridges had the highest percentage, 24.9%, of a state’s total bridges. California’s problem bridges were the most traveled, with Interstate 110 in Los Angeles logging 273,760 daily crossings.
“America’s highway network is woefully underperforming,” said Alison Premo Black, ARTBA’s chief economist who conducted the analysis. “It is outdated, overused, underfunded and in desperate need of modernization.”
ARTBA’s analysis came as President Trump discussed tax reform and infrastructure on Wednesday with executives from eight major retailers, including Target, Walgreens, J.C. Penney, and Best Buy.
The Problem Solvers Caucus, led by Rep. Tom Reed, R-NY, and Josh Gottheimer, D-N.J., wrote in their letter, “We are willing to work with you to find the issues ripe for bipartisan agreement and to turn them into law …. History shows that the most consequential and long-lasting reforms are usually bipartisan.” The group was founded just before the midterm elections in November 2014.
Addressing infrastructure investments and tax reform on a broad bipartisan basis “could give a significant boost to our economy and provide Americans with confidence that government can work for them,” they wrote.
The $1 trillion, 10-year infrastructure plan proposed by Trump before the election would provide no new federal funding. Instead, it calls for $137 billion of federal tax credits designed to spur private investments in roads, bridges, and other infrastructure with a revenue stream.
The linking of tax reform with infrastructure investments could be an “immediate win for our country,” the caucus said earlier in a Jan. 8 letter to Trump before the inauguration.
“America’s aging surface, water, and energy infrastructure combining with our complex and non-competitive tax code are huge barriers to investment and to hiring,” the pre-inauguration letter said.
“The logic of combining tax and infrastructure reform in one package is compelling,” the caucus said. “Common sense and comprehensive tax reform could free up significant capital for infrastructure.”
The recent collapse of the spillway at California’s Oroville Dam that forced the evacuation of almost 200,000 residents was cited on Tuesday by Trump press secretary Sean Spicer as an example of the nation’s infrastructure problem.
“The situation is a textbook example of why we need to pursue a major infrastructure package in Congress,” Spicer said at the daily press briefing.
“Dams, bridges, roads and all ports around the country have fallen into disrepair,” he said. “In order to prevent the next disaster, we will pursue the president’s vision for overhaul of our nation’s crumbling infrastructure.”
An “infrastructure czar” is needed to coordinate Trump’s proposed public works program, according to attorney Barry LePatner.
“We lack the political will and the political leadership to address this problem in a comprehensive way,” LePatner said during an interview Tuesday on the CNBC cable channel. “Somebody has to take responsibility at the political level and provide the leadership and the willpower.”
The Bond Buyer
By Jim Watts
February 15, 2017
Some observers believe halting the rules wouldn’t stop states from moving forward with auto-IRAs on the books, but would likely halt progress on proposed bills.
The House on Wednesday voted in favor of two resolutions to overturn Labor Department rules issued last year that promote creation of auto-IRA programs by cities and states.
The resolutions to kill the Obama-era rules were introduced last week, on Feb. 8.
One, sponsored by Rep. Tim Walberg, R-Mich., pertains to rules governing state retirement programs; the other, sponsored by Rep. Francis Rooney, R-Fla., pertains to municipalities such as cities and counties.
The House voted 231-193 in favor of the state resolution, and 234-191 in favor of the one governing cities, with both contests largely along party lines.
The DOL regulations encourage states and municipalities to create automatic-enrollment, payroll-deduction IRA programs for private-sector workers by exempting such programs from federal retirement law, the Employee Retirement Income Security Act of 1974, thereby limiting their liability.
Killing the rules would be an attempt to stymie creation of auto-IRA programs, which five states have been developing.
The programs seek to close the retirement-plan coverage gap and boost savings by mandating employers offer a plan to their workers. The auto-IRA would serve as an alternative retirement plan for employers that didn’t want to offer a private-sector option such as a 401(k).
The programs have drawn criticism from some groups such as the Financial Services Institute Inc., the Investment Company Institute and the Chamber of Commerce, which say they will create a patchwork of different retirement plans across the country and expose investors to fewer protections.
The resolutions wouldn’t be subject to a filibuster in the Senate. Observers say, though, that Senate action on the resolutions is unlikely to be as swift as in the House due to more pressing proceedings in the Senate such as nomination hearings.
Congress has a limited time frame, up until roughly mid-May or mid-June, within which it can pass a resolution overturning the DOL rules governing the state and city rules. The Department of Labor put the rules on the books in August and December last year, respectively.
Observers believe there’d still be a legal basis for states to move forward with their programs even if the rules were killed, but states that haven’t yet passed bills to create such programs may adopt a wait-and-see attitude.
Investment News
Feb 15, 2017 @ 5:00 pm
By Greg Iacurci
On January 24, 2017, President Donald Trump issued an Executive Order and two Presidential Memoranda directing relevant federal agencies to take expedited review and approval action on various infrastructure projects, including the Keystone XL and Dakota Access pipeline projects. Additionally, President Trump issued a Presidential Memorandum directing relevant federal agencies to develop a plan under which all new U.S. pipeline projects will use domestically sourced materials and equipment.
In the Executive Order, President Trump stated that “infrastructure projects in the United States have been routinely and excessively delayed by agency processes and procedures.” To expedite agency review, President Trump directed the Chairman of the White House Council on Environmental Quality (“CEQ”), upon request or on his or her own initiative, to identify “high priority” infrastructure projects that require federal review and approval. For those infrastructure projects identified as high priority, President Trump directed the Chairman of the CEQ to coordinate with the relevant government agencies to establish expedited review procedures and approval deadlines.
In two related Presidential Memoranda, President Trump directed the relevant government agencies to expedite review of the Keystone XL and Dakota Access pipelines. As to Keystone XL, President Trump invited the pipeline to resubmit its application for a Presidential Permit to the United States Department of State. President Trump also directed the Secretary of State to reach a permitting decision within 60 days of the application being resubmitted. Additionally, President Trump directed the Secretary of the Army to expedite review of requests for approvals related to Keystone XL, including requests under Nationwide Permit 12 to cross bodies of water owned by the U.S. As to Dakota Access, President Trump directed the Secretary of the Army and other relevant department heads to expedite the review of all requests for permits and easements necessary to construct the project.
In a third Presidential Memorandum, President Trump required the Secretary of Commerce to coordinate with other relevant federal agencies to submit a plan within 180 days that ensures that all new pipelines, as well as pipelines that will be expanded, repaired, or retrofitted in the U.S., use domestically sourced materials. More specifically, the Presidential Memorandum states that the plan should require that the manufacturing process for iron and steel products used to construct the pipelines occur in the U.S.
The Executive Order is available here. The Presidential Memoranda are available here.
Last Updated: February 9 2017
Article by Christopher M. Nalls and Daniel Archuleta
Troutman Sanders LLP
The content of this article is intended to provide a general guide to the subject matter. Specialist advice should be sought about your specific circumstances.
In its blockbuster 2012 opinion Texas Rice Land Partners, Ltd. v. Denbury Green Pipeline-Texas, LLC (Texas Rice I), the Texas Supreme Court upended the way pipeline operators establish common-carrier status to exercise the power of eminent domain. On January 6, 2017, the Court issued a second major decision in the same case, dubbed Texas Rice II, finding certain evidence of public use sufficient to establish common-carrier status. While Texas Rice II provides some guidance to pipeline operators planning projects post-Texas Rice I, it is unlikely to prevent future litigation regarding the level of public use required to support pipeline companies’ claims of eminent domain authority.
Texas Rice I: Holding Oneself Out As a Common Carrier Is Not Sufficient for Exercise of Eminent Domain
Under Section 111.019 of the Texas Natural Resources Code, “Common carriers have the right and power of eminent domain.” As noted in Texas Rice II, before 2012 “a pipeline owner needed to do little more than ‘check[] a certain box on a one-page government form’ to obtain common-carrier status.” In Texas Rice I, however, the Court made clear that the Takings Clause of the Texas Constitution requires that to be a common carrier, a pipeline must “serve the public” and not “be built only for the builder’s exclusive use.” The record before the Court in Texas Rice I only included evidence that pipeline-builder Denbury was negotiating with third parties to transport CO2. Absent was evidence that the transported CO2 would remain the property of a third party or would be transported to a third party. The Court thus decided that Denbury did not establish common-carrier status because it only showed the possibility of public use rather than a reasonable probability that public use would result. The Court made clear that post-Texas Rice I, “[m]erely holding oneself out [as a common-carrier would be] insufficient under Texas law to thwart judicial review.”
In remanding the case for further proceedings, the Court concluded that pipeline companies seeking to condemn property interests for their projects must “present reasonable proof of a future customer, thus demonstrating that the pipeline will indeed transport ‘to or for the public for hire’ and is not ‘limited in [its] use to the wells, stations, plants, and refineries of the owner.'” While the Court made clear that mere “holding out” would not establish common-carrier status, the Court left open the question of what evidence would suffice.
Texas Rice II: Public Use May Be Established By Transport Contracts with Non-Affiliates
In Texas Rice II, the Court emphasized that because an essential condition of a lawful exercise of the power of eminent domain “is that the professed use be a public one in truth, . . . mere assertions of the possibility of public use” are not enough to establish common-carrier status. The Court added that, at a minimum, there must be a reasonable probability, meaning “more likely than not,” that the pipeline will at some point after construction “serve the public by transporting gas for one or more customers who will either retain ownership of their gas or sell it to parties other than the carrier.”
On the evidence adduced on remand, the Texas Rice II Court decided that the test set forth in Texas Rice I had been met. That evidence included a showing of proximity of the pipeline to potential customers, a transportation contract with a non-affiliate that provides for its retention of title to its CO2, and a contract with a non-affiliate for the purchase and transport of CO2. In conclusion, the Court held that the test was met because the evidence established that the pipeline would serve the public “by transporting CO2 for one or more customers who will either retain ownership of their gas or sell it to parties other than the carrier.”
In Conclusion: Questions Remain
Before Texas Rice I, a company wanting to condemn easements for a common-carrier pipeline needed only to fill out a form to obtain a permit from the Texas Railroad Commission reflecting its status as a common carrier. Texas Rice I changed that standard but gave rise to uncertainty regarding how pipeline transactions, planning, and construction must be carried out for pipelines to attain common-carrier status. Texas Rice II provides some answers but also suggests that pipeline projects will be scrutinized by courts seeking to strike a balance between “the property rights of Texas landowners [and] our state’s robust public policy interest in pipeline developments.”
Additional questions remain to be answered. In particular, it remains unclear whether transport or eventual sale of carried materials to indirect affiliates, affiliated joint ventures, or certain categories of customers will constitute “public use.” Further litigation regarding these and other issues is likely.
Last Updated: February 9 2017
Article by Andrews Kurth LLP
Andrews Kurth LLP
The content of this article is intended to provide a general guide to the subject matter. Specialist advice should be sought about your specific circumstances.
The state of Delaware will sell $225 million of general obligation bonds on Feb. 23, the largest offer in a trading week shortened by the Presidents Day holiday on Monday.
Issuers are expected to sell just $3.8 billion of bonds and notes in the U.S. municipal market next week, according to Thomson Reuters estimates.
The subdued level of supply is in line with the low-volume trend that began at the outset of the month, according to Alan Schankel, managing director and municipal strategist at Janney Montgomery Scott.
“February is on track to be among the lightest volume months,” he said in a note on Friday. “Our estimate for a sub-$20 billion total places this month as the slowest February since 2014.”
Total issuance for January was $33.6 billion, 37.6 percent higher than the same month last year by par amount, with increases in both refundings and new money, according to Thomson Reuters data.
Other notable offers next week include $177 million of transit system sales surtax revenue refunding bonds from Miami-Dade County and $129 million of limited tax general obligation bonds for the Port of Seattle.
Anticipation of tax reform measures, which are expected to come from congressional Republicans in the coming weeks, has fueled speculation in the market about whether the proposals will seek to do away with the tax-exempt status of muni bonds.
“While a reduction in the tax rates threatens to reduce the value of the municipal tax-exemption, its elimination remains highly unlikely, in our view,” Peter Hayes, head of the municipal bond group at BlackRock, said in a monthly research note on Friday.
Public power utilities, which rely on the muni market to finance projects and which have warned lawmakers against eliminating the tax exemption on muni bonds, are not overly concerned about a major overhaul either.
“We’ve not found anyone rushing to market,” John Godfrey, senior government relations director with the American Public Power Association, said on Friday.
“There is some sense that the markets are already pricing tax reform risk into rates,” he said.
Reuters
Fri Feb 17, 2017 | 5:14pm EST
By Rory Carroll
(Reporting by Rory Carroll; Editing by James Dalgleish)
The Trump administration’s plans to radically overhaul the tax code could weigh on munis—but it could create buying opportunities.
Municipal-bond investors have a lot of reasons to wring their hands in 2017. The Federal Reserve seems intent on hiking rates as many as three times this year, and President Donald Trump is threatening to radically rewrite tax policy, potentially even limiting the tax-exempt status of munis.
Even so, munis have a lot going for them. They provide a low-risk way to diversify when the biggest risk to your portfolio might be from overpriced stocks. Most munis are high-quality, and the asset class has historically had a negative correlation to equities, according to Standard & Poor’s.
Even better, munis are a lot cheaper than they were a year ago, which means they yield more. (Bond yields move inversely to prices.) After a fourth quarter of rising interest rates, the average yield on a 10-year triple-A-rated muni bond rose to 2.4%, equivalent to a 4% taxable yield for individuals in a high tax bracket. That compares to 1.9% a year ago, says James Grabovac, investment strategist at McDonnell Investment Management.
Another sign of value, he notes: The 10-year muni-bond yield is nearly the same as the 10-year Treasury yield, up from just 85% a year ago.
“The psychology of the market is much improved” since late last year, says John Miller, co-head of fixed income at Nuveen Asset Management. “Prices haven’t moved that much, but they are stable with a slight upward bias.” Plus, inflows have been positive for the past five weeks after 10 weeks of sharp postelection outflows.
Though changes to the individual tax code appear to be on the back burner, as the Trump administration attempts to deal with corporate tax reform first, there are two main concerns.
The first—reducing or eliminating munis’ tax-exempt status—will likely be floated, but is unlikely to succeed. “It has come up before, and it always dies,” says James Kochan, chief fixed-income strategist at Wells Fargo Funds. “Sometimes a fairly quick death.” Infrastructure spending, a goal of this administration, is usually funded by states and cities issuing munis, so it seems unlikely Trump would want to disrupt the market, notes Grabovac.
Cutting marginal tax rates could also make munis less attractive, though it has happened before and the asset class held up just fine. BlackRock looked at what would happen if there was a cut in the highest tax rate to 33%, and found it would lead to just a 0.15 to 0.5 percentage-point rise in yields, depending on maturity. That’s not such a big penalty.
SUCH TAX PROPOSALS could stoke volatility, which would create buying opportunities for nimble investors prepared to take advantage of a selloff. Sean Carney, who heads municipal strategy at BlackRock, says more investors are already using muni exchange-traded funds, such as his firm’s iShares National Muni Bond (ticker: MUB), to buy on weakness and sell on strength. He thinks the approach makes sense now.
Closed-end funds, many of which have been volatile as they have reduced their payouts, are another option. Eaton Vance Municipal Income (EVN), for one, is already selling at a discount, when it usually commands a premium. It yields 5.53%.
Volatility may also come from a surge in new muni-bond supply in March, a typical seasonal pattern, or more credit downgrades in states grappling with budget shortfalls and pension-related costs.
An actively managed fund makes sense for investors who prefer not to trade. The top-performing fund in the past year, up 3.3%, is Nuveen Inflation Protected Municipal Bond (NITAX), which hedges against interest-rate risk. Nuveen All-American Municipal Bond (FLAAX)—the firm’s traditional muni offering—has a 4.9% average annual return for the past 10 years, putting it in the top 2% of all national long-term muni funds.
BARRON’S
By AMEY STONE
Updated Feb. 18, 2017 1:26 a.m. ET
Speculation continued this week in Washington, D.C. on infrastructure funding plans, with municipal bonds being discussed during a panel at the National Association of State Treasurers 2017 Legislative Conference, according to The Bond Buyer. While, it will likely take tax reform for bonds to remain a viable resource, the expectation is that there will not be any changes to municipal bond rules until next year.
In the meantime, a local agency’s ability to borrow funds for public capital improvements is the most cost-efficient way to finance public infrastructure. Tax-exempt rates remain at historic lows and will always beat the rates provided by public-private partnerships and private equity investment.
However, there is uncertainty whether the current administration and Congress will keep tax-exemption of municipal debt at its current level. Previous administrations have proposed placing limits on the benefits of tax-exemption for those individuals who pay taxes at the highest rates. Additionally, Congress provided rebates to issuers under the Build America Bonds program in 2010, under which rebates were reduced significantly as a result of the federal government’s budget crisis in 2011.
Among the many questions being asked in regard to what a federal infrastructure funding plan will look like is whether public-private partnerships or private equity investments will benefit rural areas. The current administration has many members that are pro-public-private partnerships. Last week, at the Senate Environment and Public Works Committee, discussion focused on the need for federal funding when there is no enticement for private involvement. “Funding solutions that involve public-private partnerships, as have been discussed by administration officials, may be innovative solutions for crumbling inner cities, but do not work for rural areas,” said Sen. John Barrasso, (R-Wyoming), who chairs the Committee, according to the Albuquerque Journal. Private partners are interested in potential for generating returns, and rural areas often lack the revenue-generating project capacity to be truly enticing to a private partner.
We have no indication at this time whether there will be renewed attempts to reduce the benefits of tax-exemption. Nevertheless, tax-exempt bonds, if left unchanged, will allow local agencies to control their costs of borrowing and they will not have the interference of private parties on the use and operations of the financed facilities.
by Kimberly Byrens | Best Best & Krieger LLP
2/16/2017
A widening chasm for the US economy – highway, road and bridge funding deficits – can be curbed by establishing interstate US tolling, It’s a rather lofty task, however, that would need to be approached fairly and pragmatically.
Last week we announced the Outcomes Rate Card Development Competition, which will position governments and nonprofit organizations at the forefront of innovation in outcomes-based policymaking. Outcomes rate cards scale solutions to society’s most pressing challenges by standardizing the Pay for Success contracting approach. With one outcomes rate card, governments can launch multiple Pay for Success projects, directing resources towards effective social programs at greater scale.
The Competition is supported by the Social Innovation Fund, a program of the Corporation for National and Community Service. “The Social Innovation Fund is committed to bringing innovative solutions to communities across the country through Pay for Success,” said Lois Nembhard, Acting Director of the Social Innovation Fund. “This competition is a great opportunity for more governments and nonprofits to engage in Pay for Success through outcomes rate cards.”
To learn more join our webinars on Tuesday, February 21st at 3:00 pm EST and on Wednesday, March 15, 2017 at 3:00 pm EST. Webinar log-in is available on the competition webpage.
Social Finance
It’s not just U.S. President Donald Trump who’s bullish on infrastructure investing.
Mutual and exchange-traded funds dedicated to building and upgrading roads, bridges, airports and other projects attracted more than $450 million from November through January, the biggest three-month period in almost two years, according to Morningstar Inc. The inflows reversed redemptions during 15 of the 16 months prior to last year’s fourth quarter.
Interest in the funds has increased with Trump proposing $1 trillion in spending during the next decade on crumbling and outdated infrastructure. While investments have historically been concentrated privately, some mutual fund providers are offering access to the industry through bundles of shares concentrated on businesses that run everything from airports to cell phone towers. And the number of offerings is likely to rise, according to Morningstar’s Tayfun Icten.
“The new product introduction will be pretty healthy in this particular area going forward,” Icten, an analyst who focuses on infrastructure mutual funds, said in a telephone interview.
The Lazard Global Listed Infrastructure Portfolio is the largest mutual fund in Morningstar’s infrastructure category and the top performer for the last three- and five-year periods. Inflows from November through January to the $3.6 billion fund exceeded $230 million.
Tollways, Airports
The Lazard fund focuses on stocks in regulated sectors with monopoly-like franchises, such as ports and airports, while avoiding interest rate and commodity-sensitive firms, Icten said. Its biggest holdings include freight-transportation operator CSX Corp., Atlantia SpA, a Rome-based international manager of toll networks and airports; and Vinci SA, a France-based construction and infrastructure concession operator. Lazard portfolio manager John Mulquiney declined to comment.
Investors poured a net $320 million in November and December into BlackRock Inc.’s iShares Global Infrastructure ETF, the largest exchange-traded fund in the category. It tracks the S&P Global Infrastructure Index and has climbed about 19 percent in the past 12 months yet investors pulled almost $100 million in January, according to Morningstar estimates.
Net inflows into the fund category overall slowed in January, after some of the funds trailed the broader market’s fourth-quarter gains and hopes dimmed for a quick U.S. stimulus boost under the new administration, Icten said.
Until about a decade ago, U.S. infrastructure investing opportunities were largely limited to private equity funds that were neither liquid nor available to small players. The other alternative was municipal bond funds, which usually offered low returns in exchange for tax benefits.
Rent-Like Revenue
Then money managers took a cue from the real estate industry, assembling retail funds of companies with rent-like revenue streams such as rails, pipelines, utilities or cellphone towers, according to Manoj Patel, co-manager of the $3.5 billion Deutsche Global Infrastructure Fund. The focus on long-term cash flow distinguishes infrastructure from the construction sector, which may benefit more directly from government stimulus spending, but for shorter periods, he said.
Investors who buy mutual funds and ETFs to bet on a surge in U.S. infrastructure spending will probably have to wait to see the benefits of a boom. Any Trump-era projects could take years to construct before revenue flows to popular fund holdings such as CSX or power company NextEra Energy Inc.
“This is a long-term, focused strategy on companies with structurally more stable and predictable cash flows,” Patel said in a telephone interview. The largest holdings in his fund, which averaged annual returns of almost 7 percent as of Feb. 10 since its June 2008 inception, include Kinder Morgan Inc., American Tower Corp. and Sempra Energy.
Though growing, the infrastructure category is small at $14.6 billion compared to the broad array of U.S. mutual funds and ETFs with almost $15 trillion in assets combined, according to Morningstar, which tracks 31 open-end infrastructure mutual funds and ETFs.
The market capitalization of the Guggenheim S&P High Income Infrastructure ETF has jumped more than 350 percent since Trump’s election to almost $29 million as of Feb. 13 as more investors noticed its performance, according to William Belden, head of Guggenheim’s ETFs development. Stocks in the ETF, which are heavily energy and pipeline weighted, did well in 2016 and its returns topped 50 percent over the last year.
The $289 million DoubleLine Infrastructure Income Fund, launched in April, is one of the few in the category that holds fixed-income debt such as asset-backed securities for aircraft and rail cars. It’s returned about 2.2 percent since inception as of Feb. 10. Since the election on Nov. 8 it’s lost about 1.3 percent, as with other intermediate-term bond funds that suffered as interest rates rose. DoubleLine analyst Loren Fleckenstein declined to comment.
Investors betting on the funds should be wary of exposure to interest rate, energy or currency risks that can add volatility, according to Icten. Most publicly-traded infrastructure funds also invest globally, which could limit the potential impact of U.S. stimulus policies to gains.
“It’s a tricky place,” he said.
Bloomberg
by John Gittelsohn
February 14, 2017, 2:00 AM PST
For municipal-bond investors looking for yearly financial updates from the cities and states in their portfolios, the wait times aren’t getting any shorter.
It took the debt issuers an average of 199 days last year to file their annual reports with the Municipal Securities Rulemaking Board, according to a report released by the regulator. That’s three days longer than it was in 2015 and little changed from the 200-day average during the last seven years. The figures exclude those that were filed after more than a year.
The lag has been a perennial source of complaint to investors in the $3.8 trillion municipal market, where regulations are more relaxed than those imposed on private corporations.
When raising money in the bond market, state and local issuers agree to make annual disclosures, though the timing of those commitments can vary. While about one-third agree to post audited financial statements within 180 days, about one-quarter have nine months to do so, according to the rulemaking board. By comparison, the U.S. Securities and Exchange Commission gives big companies a deadline of two months.
The SEC, which regulates municipal disclosure only indirectly through its power over underwriters, has stepped up enforcement in an effort to improve it. In 2014, it extended an offer of leniency to banks and governments that voluntarily reported misleading investors about their compliance with the disclosure obligations, resulting in settlements with dozens of issuers and underwriters.
That seems to have had an impact on some scofflaws: The MSRB said the SEC initiative led to a spike of disclosures for previous fiscal years. If such catch up submissions are included, the figures look even worse, with financial reports coming an average of 311 days after the close the year in 2016.
Bloomberg
by Jordyn Holman
February 15, 2017, 9:29 AM PST
Taylor Riggs, a contributor to Bloomberg Briefs, talks with Joe Mysak about this week’s municipal market news.
Bloomberg
February 17, 2017
The municipal-bond market has an early read on President Donald Trump’s executive order threatening sanctuary cities: more bark than bite.
The Jan. 25 order’s threat to cut federal funds to cities and counties that decline to cooperate with federal authorities enforcing policies on illegal immigrants is unlikely to hurt the municipalities’ credit, at least in the short term, according to credit-ratings firms, analysts and investors.
Two such cities—New York and Philadelphia—are out selling more than $1 billion of bonds but only made brief references to the order in marketing documents.
Officials from cities like Philadelphia and Los Angeles are still trying to figure out how much of their budgets could be on the line. The order directs the Office of Management and Budget to provide details on the federal grant money cities receive, but the White House hasn’t yet identified the funds it can shut off.
Matt Szabo, deputy mayor of budget and innovation in Los Angeles, called the presidential order “sufficiently vague,” but said he is operating under the assumption the city’s roughly $500 million in federal grant money could be at risk. Excluding the city’s utility department, airport and seaport, which control their own operating budgets, the city’s current budget is about $8.7 billion.
“Any reduction in funding would result in a real cut in service,” he said, noting that federal grants help pay for things like housing and economic-development programs administered by hundreds of city workers.
Most federal dollars that go to cities are based on statutory grants that follow a formula and can only be stopped if the funds aren’t being spent on the intended purpose, said Linda Bilmes, a senior lecturer in public policy at Harvard University’s Kennedy School of government. For example, ignoring federal immigration policy wouldn’t justify halting a Head Start grant for early childhood education, said Ms. Bilmes, who has held senior roles in the U.S. Department of Commerce under President Bill Clinton.
Ratings firms said they don’t see a major threat in the near future to municipal borrowers’ ability to repay their debts.
According to Standard & Poor’s, the executive order most likely will jeopardize grants from the Department of Homeland Security and Justice Department that account for less than 1% of municipal budgets that S&P had analyzed.
Grants from all federal agencies and departments comprise 10% of the average municipal budgets in sanctuary jurisdictions, but reach as high as 41%, said the ratings firm, which didn’t name the specific cities. S&P said the executive branch has limited power to withhold or defer funds appropriated by Congress.
“The muni market’s view on this is it’s not good, but it’s not necessarily a credit risk,” said Guy Davidson, director of municipal investments at AllianceBernstein Holding LP. Lower credit ratings could lead to higher borrowing costs.
Some credit analysts raised concerns the White House order will open gaps in city and county budgets.
Howard Cure, director of municipal-bond research at Evercore Wealth Management, said cutting off federal money flowing to New York City programs such as housing or health care, for example, could pressure finances. “The city would either have to back down on this or find other money, and if they don’t, it would put a real strain on their budget,” he said.
On Jan. 26, Miami-Dade County Mayor Carlos Gimenez directed jails to comply with federal requests to detain immigrants. The county estimated it will receive $355 million in federal funding in the current fiscal year, including support for affordable housing, transit and battling beach erosion. Some immigration advocacy groups, including the American Civil Liberties Union of Florida, disagreed with the county’s analysis of the order and don’t believe its prior jail policy put the county at risk.
A Miami-Dade spokesman said, “Faced with the possibility of losing hundreds of millions of dollars in federal funding, much of which is discretionary, the mayor made the responsible decision to protect county government.”
Philadelphia City Council President Darrell Clarke said the city should take Mr. Trump’s threat seriously, even though he said he believes the order is unconstitutional.
“If there is still room for reasonable compromise with the federal government that preserves our ability to protect residents, including undocumented immigrants, and preserves critical funding for local policing and programs that help low-income people, then that to me is worth exploring,” Mr. Clarke said this month.
In its recent bond offering, New York City indicated it sees modest risks saying it believes reductions to federal funding are legally limited and that such grants “comprise a small percentage of the city’s total budget.”
The city also said it believes most or all of those federal grants would qualify for the exemption in the executive order that said funds “deemed necessary for law enforcement purposes” wouldn’t be cut. The city added that there is no guarantee the order won’t cause a “significant reduction or delay” in receiving the grant funds, but said it would mount “a vigorous legal challenge” if that happened.
Los Angeles also will head to court if necessary, and the city is “confident that the Constitution and courts will be on our side,” a spokesman said.
At least four jurisdictions, including San Francisco, have filed lawsuits alleging the order is unconstitutional. Legal experts say prior Supreme Court rulings could limit the executive order’s reach.
THE WALL STREET JOURNAL
By JON KAMP, SCOTT CALVERT and AARON KURILOFF
Feb. 15, 2017 8:00 a.m. ET
Write to Jon Kamp at jon.kamp@wsj.com, Scott Calvert at scott.calvert@wsj.com and Aaron Kuriloff at aaron.kuriloff@wsj.com
Top earners have traditionally been attracted to municipal bonds for their tax-exempt status at the federal and often state and local levels. In the wake of President Donald Trump’s stunning upset victory, however, muni investors were forced to readjust their expectations of fiscal policy going forward. Because Trump had campaigned on deep cuts to corporate and personal income taxes, equities soared while munis sold off, ending a near-record 54 weeks of net inflows. This appears to have been premature, for a couple of reasons.
Tax Reform Unlikely To Happen Anytime Soon
Trump and congressional Republicans are currently butting heads on how best to handle tax reform, with many lawmakers saying it’s unlikely they’ll get around to it during the new president’s first 100 days, and possibly his first 200 days.
According to House Speaker Paul Ryan, Congress will focus instead on replacing the Affordable Care Act (ACA) and funding Trump’s $1 trillion infrastructure spending package before it worries about taxes. With an estimated 30 million Americans enrolled on Obamacare exchanges, finding a suitable replacement is of high importance and might take some time. The same goes with negotiating a costly infrastructure deal, which several fiscally conservative lawmakers are hesitant to support.
Besides, we all know how fast Congress operates, even on a good day. Former President Barack Obama took office in January 2009, and even with a Democratic majority in the House and Senate, his signature health care law didn’t reach his desk until March the following year.
All of this is to say that it might be premature to start dumping your munis, or withhold an investment in munis, purely on the notion that income taxes are about to get a haircut. We’re probably looking at many more months of Obama-era tax rates, including the 3.8 percent Obamacare surcharge on investment income. Other investors have realized this as well, which is why we’re seeing positive net inflows back into muni bond funds.
If enacted as conceived, Trump’s tax reform plan would indeed be the most significant in decades, simplifying the number of tax brackets from seven to three, lowering the top rate from 39.6 percent to 33 percent and eliminating personal exemptions and filing status options.
One of the unintended consequences of this is that income taxes could actually go up for certain middle-income filers. According to an analysis of Trump’s proposal by the independent Tax Policy Center, as many as 8 million American families, including a majority of single-parent households and large families, could end up paying more than they do now (emphasis mine):
Increasing the standard deduction would significantly reduce the number of filers who itemize. We estimate that 27 million (60 percent) of the 45 million filers who would otherwise itemize in 2017 would opt for the standard deduction. Repealing personal exemptions and the head of household filing status, however, would cause many large families and single parents to face tax increases.
But What About Rising Interest Rates?
In December, the Federal Reserve lifted interest rates for only the second time in nearly a decade, and many expect to see up to three additional increases this year. It’s important to be aware that when rates rise, bond prices fall because if newly issued bonds carry a higher yield, the value of existing bonds with lower rates declines. This is why I believe investors should take advantage of short- and intermediate-term munis, which are less sensitive to rate increases than longer-term bonds, whose maturities are further out.
Forbes
Frank Holmes, Contributor
FEB 8, 2017 @ 01:26 PM
A pair of toll bridge deals will lead a U.S. municipal bond calendar next week that features around $5.85 billion in total sales.
California’s Bay Area Toll Authority will issue the week’s biggest deal, pricing on Tuesday $552 million in negotiated refinancing bonds to reduce borrowing costs.
The Delaware River Joint Toll Bridge Commission, a bi-state agency that operates seven toll bridges in Pennsylvania and New Jersey, will price a $438 million negotiated bond, to fund the bulk of a $512 million reconstruction of the Scudder Falls Bridge.
Both deals are scheduled to price on Tuesday and will be underwritten by Bank of America Merrill Lynch.
The Scudder Falls Bridge, which crosses the Delaware River along Interstate-95 and supports some 60,000 cars a day, will be demolished to address safety concerns, and rebuilt by the Trumbull Corporation, which was awarded the construction contract, according to a road show presentation from the toll bridge commission.
Tree cutting and installation of noise walls are underway, with full construction slated to begin in April and run through August 2021, according to the presentation.
Next week’s total muni supply will include $5.575 billion of negotiated and competitive bonds, and another $271 million of notes.
The Long Beach, California, Unified School District will provide the biggest competitive bond deals, issuing $450 million in general obligation bonds, while Rochester, New York, will lead the way in notes, with $72 million in a pair of bond anticipation offerings.
Ongoing political and economic uncertainty could make it difficult for the U.S. Federal Reserve to raise interest rates in the near term, and “lower Treasury rates will certainly help munis,” Barclays analysts said in a weekly note on Friday.
Barclays, which projects net negative issuance for February, said “healthy dealer inventories and positive fund flows should also support the market in the coming weeks.”
Barclays noted that tax policies of President Donald Trump could also move markets.
Trump on Thursday hinted at an upcoming announcement he said would be “phenomenal in terms of tax,” but offered no detail.
Reuters
By Nick Brown
Fri Feb 10, 2017 | 2:31pm EST
(Reporting by Nick Brown; Editing by Bernard Orr)
After a rough post-election period, municipal bonds are holding up just fine this year. But while index returns are up slightly, volume is way down.
That decline reflects caution among investors about where tax policy is headed. If tax cuts are put in place, munis could become less appealing.
Morgan Stanley muni strategist Michael Zezas writes Monday:
The tale of the tape, in our view, shows an investor base lacking conviction. Consider, for example, the ratio of bid-wanteds relative to trade volume. While they have recently eased, levels since the beginning of the year are elevated on a combination of lower trade volume and larger bid lists. This suggests an investor base that is testing liquidity and playing it safe.
Zezas says that negative sentiment would normally be a sign to add munis to a portfolio. But in this case he thinks it is appropriate for investors to be cautious.
We sympathize with the implied caution being expressed for two reasons: 1) policy risks, including existential tax risks, still loom large in the muni market; 2) valuations aren’t obviously reflecting that risk.
The benchmark-tracking iShares National Muni Bond ETF (MUB) is up 0.1% year to date at $108.34, but is down 3.2% in the past year.
Barron’s
By Amey Stone
February 13, 2017, 1:45 P.M. ET
In a little over 4 weeks the federal debt ceiling will return and with it, almost certainly, the SLGS window will close. NABL members who have closings around March 15 should plan for an alternative to purchasing SLGS.
In November of 2015, then-Speaker John Boehner reached an agreement with President Obama that suspended the debt limit through March 15, 2017. This was one of Speaker Boehner’s final acts before his resignation.
Absent action by the current Congress and President to increase or further suspend the debt limit before March 15, the Treasury Department can be expected to begin implementation of its “extraordinary measures” to delay the date on which the United States would begin to default on its obligations – not only payments on Treasury bonds but also the federal payroll, payments to contractors, and Social Security benefits, among other things. Generally the first of the extraordinary measures that is implemented is closing the SLGS window.
Most people agree that a “bond” is a financial instrument pursuant to which a creditor (holder of the bond) lends money to a borrower (the issuer of the bond) over a specified period of time in exchange for a periodic interest payment. However, although I occasionally see headlines about green bonds being issued, it was not clear to me what made a bond “green”. Since I like to drink clean water and breathe clean air, I thought it would be worth looking into.
Continue reading.
The Public Finance Tax Blog
By Cynthia Mog
February 10, 2017
Squire Patton Boggs
DALLAS – President Trump’s pledge of getting Congress to pass a major infrastructure program in his first 100 days is slipping away as lawmakers focus on health care as their top priority, leaving experts to wonder if the initiative will move forward at all this year.
Infrastructure has become tied to tax reform because of the revenues that would be needed to fund it. House Speaker Paul Ryan, R-Wis., said Thursday that Congress will not take up tax reform until it deals with the repeal and replacement of the Affordable Care Act.
Tax reform, ranging from a comprehensive overhaul of the tax code to attempts to repatriate trillions of dollars in overseas corporate profits, has been the preferred main source of additional infrastructure funding for many lawmakers. Trump’s promise of a $1 trillion boost to infrastructure spending has buoyed the stock market since his inauguration.
“It’s just the way the budget works that we won’t be able to get the ability to write our tax reform bill until our spring budget passes, and then we write that through the summer,” Ryan said during an interview on Fox News.
“We feel the need to rescue this system here and that’s why we’re going with health care first,” Ryan said. “And then in the spring we’re doing the second budget. That’s where tax reform comes.”
Trump favors a reduction in the corporate tax rate to 15% from the current 35%, while Ryan’s proposal would lower the rate to 20%.
Ryan and Rep. Kevin Brady, R-Texas, chairman of the House Ways and Means Committee, have said that revenue resulting from corporate tax reform should be used for overall tax reforms rather than being dedicated solely to infrastructure.
Rep. Bill Shuster, R-Pa., chairman of the House Transportation and Infrastructure Committee, said last week that Trump’s infrastructure program would likely be funded through an overhaul of the federal tax code that Democrats could support.
Infrastructure funding will probably be linked to tax reform, said Sen. John Thune, R-S.D., chairman of the Senate Commerce Committee and third-ranking Republican in the Senate.
“My guess is if that gets done, it probably hitches a ride on tax reform,” Thune said last week at the Republican legislative retreat in Philadelphia.
“We’ve got a very focused agenda, things that we want to get done in the next 200 days,” Thune said. “How infrastructure plays into that, we’re not sure yet.”
Delaying action on infrastructure funding to take care of other issues could mean farewell to hopes for an infrastructure program this year or next, said Norman Anderson, president of consulting firm CG/LA Infrastructure.
“President Trump’s main promise during the campaign for action on infrastructure in his first 100 days is in danger of not being fulfilled,” Anderson said. “It’s a big mistake and a very, very bad idea, because if infrastructure is the second or third priority in Washington instead of the first, then nothing will get done.”
History has shown that infrastructure programs are passed early in a new administration or not at all, Anderson said.
“It has to be done in the very beginning,” he said. “Nobody’s been able to do it after the first 200 days.”
A bipartisan trio of lawmakers has proposed incentives for corporations to bring an estimated $2 trillion in overseas earnings into the U.S. to spur private sector reinvestment and growth.
Rep. John Delaney, D-Md., one of the sponsors of the Infrastructure 2.0 Act, proposed similar measures in 2014 and again in 2015 with significant bipartisan support, but neither gained traction in Congress.
A Senate bill filed Tuesday by Sen. Deb. Fischer, R-Neb., would provide five years of supplemental federal highway funding, not through tax reform but by diverting Customs and Border Patrol revenues.
Fischer’s Build USA Infrastructure Act would move the first $21.4 billion of revenues collected per year from freight and passengers at international borders into the Highway Trust Fund for five years.
The Bond Buyer
By Jim Watts
February 2, 2017
A roundup of money (and other) news governments can use.
GOVERNING.COM
BY LIZ FARMER | FEBRUARY 10, 2017
PHOENIX – New language designed to protect investors appeared last month in the offering documents of a taxable hospital deal, as the ripple effect of a battle in the corporate bond arena spread to the municipal market.
The language, which appeared in offering documents for a $350 million taxable Children’s Hospital Corporation (Mass.) issuance, makes clear that investors are due a premium in the event of a default. It specifies that investors are due an amount “equal to the make-whole redemption price.” Municipal finance pros said the language appears to have crossed over as a result of a dust-up over corporate bond covenants in late 2016 – though some expressed skepticism that such covenants would take hold in the municipal market.
Adam Cohen, a corporate finance attorney who founded and writes for a research firm called Covenant Review, said the issue arouse in October when corporate borrowers started including provisions in their offering documents that prevented buyers from collecting any kind of premium if the bonds were redeemed early. They started doing so as an effort to “opt out” of court rulings that ordered some corporate borrowers to pay make-whole redemptions after covenant breaches, a move that investors quickly began railing against.
That meant that issuers could voluntarily breach their covenants and only pay out par. An ugly “war” played out over this in the corporate market late last year, Cohen said, leading borrowers to drop their insistence on that provision. The language in the Children’s Hospital Corporation deal is the “reverse” of what the corporate borrowers tried to do, Cohen said.
“It’s a big deal because this war from corporate bonds leapt over to munis,” Cohen said, adding that had personally spoken to some fund managers that said they would want this protective language in future muni deals they bought, but that the majority of the market appears unaware of the issue.
But despite the uproar the deal caused in the corporate world, muni market professionals seem skeptical that the issue is as big in the tax-exempt market. The hospital deal that included the make-whole provision was taxable, and so not representative of the most common type of muni bond issuances.
A bond lawyer who reviewed the offering documents at The Bond Buyer’s request but requested anonymity to comment on the deal said he didn’t believe that the provision would become commonplace in the muni market, and probably wasn’t necessary. The attorney said that taxable deals are generally sold to corporate buyers, and as such reflect the expectations of the corporate market.
“Our clients don’t have the same incentives to game the system like corporate players do,” the lawyer said. “I’m surprised they had this whole kabuki dance.”
Triet Nguyen, managing director and head of public finance credit at NewOak said that he had not seen the provision in a muni deal, and didn’t see much utility in including it in a tax-exempt issuance.
“I think it will be hard to enforce in bankruptcy and does not have any direct impact on recovery,” said Nguyen. “In a sense, all it does is inflate the bondholders’ potential claim.”
The Bond Buyer
By Kyle Glazier
February 7, 2017
WASHINGTON – Companion bills introduced in the House and Senate would allow state and local governments to issue up to $5 billion of private activity bonds to finance the repair or construction of public buildings under public-private partnership arrangements.
The “Public Buildings Renewal Act” was introduced in the House on Feb. 7 as H.R. 960 by Rep. Mike Kelly, R-Pa., and eight cosponsors, five of whom besides Kelly are members of the House Ways and Means Committee.
The measure in the Senate, which has not been assigned a number yet, is being introduced by Sens. Dean Heller, R-Nev., and Bill Nelson, D-Fla., both of whom sit on the Senate Finance Committee.
The bills they introduced last session were H.R. 5361 and S. 3177.
The legislation would create a new category of tax-exempt PABs that would allow states and localities to partner with private parties to construct or renovate qualified government buildings, which would be governmentally owned.
These could include public buildings, schools, state colleges or universities, public libraries, and courthouses, according to the bills’ text. They could also include government-owned hospital, health care, laboratory or research facilities and public safety facilities such as police stations or firehouses.
The bonds could not be issued to finance buildings or facilities for retail food and beverage services, private golf course or country clubs, or other sports or entertainment facilities, according to the text.
These kinds of projects cannot currently be financed with tax-exempt PABs because there is not a specific qualified PAB category for bonds for public buildings.
Jessica Giroux, Bond Dealers of America’s general counsel and managing director, said the bills, “fit the administration’s call for more infrastructure spending.”
“There has been a fair degree of interest and a few transactions done as P3s for what is called social infrastructure” such as courthouses and government office buildings, Giroux said. “The downside is that it’s hard to do these economically if you can’t use tax-exempt bonds. So this sort of thing would be a fix for that.”
Emily Brock, director of the Government Finance Officer’s Association’s federal liaison center, said the bills are in line with GFOA policy.
“The GFOA has a long-standing policy that encourages Congress and the Department of the Treasury to consider easing private activity restrictions on public use facilities,” she said. “We look forward to working with the bill sponsors to discuss how this concept can augment the financing toolkit for state and local governments, which also must include the full preservation of the municipal bond interest exemption.
Michael Decker, managing director at the Securities Industry and Financial Markets Association and co-head of its muni division, said, “Private activity bonds can provide an efficient mechanism for financing the debt portion of infrastructure projects. It’s appropriate for governments who determine that public-private partnerships are the most efficient financing model to be able to tap the tax-exempt, private-activity bond market to finance the project. This principle should apply to public buildings, as Sens. Heller and Nelson and Congressman Kelly have proposed, and other infrastructure projects as well.”
Rep. Kelly said in a release on the bill pending in the House, “Our country’s public buildings are in a historic state of disrepair and in need of a bold solution. That’s where the Public Buildings Renewal Act can come to the rescue.”
Blumenauer added, “Congress has failed to display the political courage to adequately invest in infrastructure – from roads to light rail to schools and courthouses. Our nation is literally falling apart and falling behind. We need an ‘all of the above’ approach to infrastructure funding and simple fixes to lower investment barriers are steps in the right direction.”
The other House and Ways and Means Committee members co-sponsoring the bill in the House are: Reps. Carlose Curbelo, R-Fla., Lynn Jenkins, R-Kan., James Renacci, R-Ohio, and Ron Kind, D-Wis. Reps. Lee Zeldin, R-N.Y., Will Hurd, R-Texas, and Scott Perry, R-Pa., are also co-sponsors.
The Bond Buyer
By Lynn Hume
February 9, 2017
Resolutions to block Department of Labor rules allowing states to set up private-sector retirement savings programs were introduced Wednesday by two members of the House Education and the Workforce Committee.
The Department of Labor issued final rules on Aug. 25 granting states a safe harbor to set up payroll deduction individual retirement accounts for private-sector workers who do not have access to workplace retirement savings programs. On Dec. 19, the DOL issued similar final rules for cities and other large political subdivisions. The rules remove concern over being pre-empted by federal regulators by clarifying that such programs would not be covered by ERISA.
H.J. Res. 66, introduced by Rep. Tim Walberg, R-Mich., who chairs the Subcommittee on Health, Employment, Labor and Pensions, would remove the safe harbor for states, and H.J. Res. 67, introduced by committee member Rep. Francis Rooney, R-Fla., would block the rules for cities.
Both measures, called resolutions of disapproval, take advantage of the Congressional Review Act, which allows Congress to legally prevent a federal agency from implementing a rule or issuing a substantially similar rule without congressional authorization.
“Our nation faces difficult retirement challenges, but more government isn’t the solution,” Mr. Walberg said in a statement. Mr. Rooney, in the same statement, said the rules would force people into government-run plans with fewer protections and less control, and present employers with “a confusing patchwork of rules” that could result in fewer retirement plans being offered.
In a letter to House Speaker Paul Ryan, R-Wis., the ERISA Industry Committee, which represents large employers on benefits issues, said its members “are discouraged by recent proposals at the state and local level that unnecessarily disrupt active employer-sponsored retirement plans that are already in full compliance with federal law and regulations,” particularly those that operate across state lines.
“Rules that are too onerous or restrictive can chill an employer’s commitment to offer a retirement plan,” the ERIC letter said.
A vote on the joint resolutions has not been scheduled, but is expected to happen as early as next week.
PENSIONS & INVESTMENTS
BY HAZEL BRADFORD | FEBRUARY 8, 2017 3:19 PM | UPDATED 4:47 PM
— Contact Hazel Bradford at hbradford@pionline.com | @Bradford_PI
WASHINGTON – Long-term municipal bond issuance is expected to fall to $417.5 billion this year from $423.8 billion last year, according to a survey released by the Securities Industry and Financial Markets Association on Wednesday.
Total muni issuance is expected to rise to $461 billion in 2017, with increases in short-term munis, but a decline in refundings, the survey of six municipal market firms showed.
SIFMA conducted its 2017 Municipal Bond Issuance Survey between Nov. 14 and Feb. 3 based on the median values of figures submitted from: Bank of America-Merrill Lynch; Hilltop Securities; J.P. Morgan Chase & Co.; RBC Capital Markets; Stoever Glass; and Wells Fargo Securities.
The $461 billion of total muni issuance would be up from $459.4 billion in 2016. That increase is tied to an expected jump in short-term issuance to $43.5 billion from $35.6 billion in 2016, according to the survey results. The participating firms said long-term issuance would reach anywhere from $320 billion to $450 billion for 2017, the median of which is $417.5 billion. Long-term tax-exempt muni issuance is expected to reach $375 billion in 2017, a 2.1% drop from the $383.1 billion in 2016. The firms expect taxable issuances to rise to $30 billion in 2017 from $28.5 billion in 2016, a 5.2% increase. Alternative minimum tax issuance is also expected to rise to $12.5 billion in 2017 from $12.2 billion in 2016.
Of the total issuances, only 41% are expected to be refundings in 2017 compared to the 51% in 2016.
Michael Decker, managing director and co-head of munis for SIFMA, said the lower number of refundings is likely due to the expectations of further Federal Reserve Board rate increases and the fact that 2007 was a relatively weak year for issuance. “Many bonds are issued with ten-year par calls so one of the driving factors for refunding volume is … the new money issuance volume ten years ago,” Decker said. “2007 was a relatively weak year so there will be relatively fewer issues that come up for refunding in 2017. That, compounded with the rate increase we saw toward the end of last year and maybe a smaller uptick in rates throughout this year, will together cause refunding volume to be lower than it has been.”
The Fed’s Federal Open Market Committee raised the federal funds target rate to 0.50% to 0.75% in December. The federal funds rate is expected to rise from 0.62% by the end of March 2017 to 0.94% by the end of December 2017, according to the survey. Most survey respondents said the largest sector of new munis would be general purpose for the next year. The balance will be evenly split between transportation, education, and public facilities, they said. General purpose has traditionally been the largest issuing sector by gross amount in past years.
The most likely event that would have the greatest effect on the muni market during the year is the possible curtailment of the tax exemption for municipal bond interest, the survey participants said. Muni groups have been actively lobbying legislators and federal government officials about the importance of maintaining the tax exemption for munis. Regulatory and compliance burdens dealers and others continue to experience will also have a large impact on the market in 2017, according to the surveyed firms.
The firms also said they expect the number of issuers that will default in 2017 to range from 20 to 25, comprising a par value that could range from $400 million to $26 billion. The survey defined default as the occurrence of a missed interest or principal payment or a bankruptcy filing.
The Bond Buyer
By Jack Casey
February 8, 2017
In January, S&P Global’s U.S. Public Finance Ratings team published their 2017 sector outlooks. In this CreditMatters TV segment, Managing Director Robin Prunty provides us with an overview of the key themes, credit risks, and opportunities in the municipal finance sector this year.
Feb. 9, 2017
S&P Global Ratings’ 2017 outlook for business conditions and credit quality for rated toll road facilities around the world is generally stable. The exception is the U.S., where the overall outlook is positive.
Feb. 8, 2017
More states are failing to sock away cash for the next rainy day.
The number without budget reserves has doubled to four from last year, according to data from the National Association of State Budget Officers. And discipline in building up cushions has slipped, with the median balance 4.9 percent of expenditures in fiscal 2017, down from 5.1 percent, Bank of America Merrill Lynch analysts said in a note to clients.
The number of states with rainy day funds of less than 1 percent of expenses rose to five from three in fiscal 2017, while those with balances of up to 5 percent declined to 17 from 19, the budget officers’ report showed.
Skimpier reserves risk exacerbating the effect of a national slowdown, as well as that from federal policies. President Donald Trump has pledged to repeal the Affordable Care Act, which would likely hit state budgets, and any overhaul that reduces taxes may curb demand for tax-free municipal bonds, which could make it more costly for localities to borrow.
Investors have punished states with low reserves. Of the four with none — Illinois, New Jersey, Nevada and North Dakota– Illinois and New Jersey must pay the highest premiums over benchmark debt among 20 states surveyed by Bloomberg. The two, which grapple with chronic budget deficits and elevated pension costs, are also the lowest-ranked U.S. states.
Other states have learned their lessons. California is enjoying its highest credit rating since the turn of the century, thanks partly to bolstering its rainy-day funds.
Lawmakers in California and in capitols across the country weren’t prepared for the last recession. In 2009, when it ended, budget gaps totaled $117 billion, about twice the level of reserves, according to Pew Charitable Trusts.
Analysts don’t expect a recession soon. The economy will probably expand through at least the first quarter of 2018, according to analysts surveyed by Bloomberg.
Even so, some state officials are girding for the eventual decline. Half of states expect to pad their reserves in fiscal 2017, according to the budget officers’ group. That includes California, where Governor Jerry Brown wants to further lift the savings account to $7.9 billion in fiscal 2018 from $6.7 billion this year.
“Saving now would allow the state to spend from its rainy day fund later to soften the magnitude and length of any necessary cuts,” California’s budget said.
Bloomberg
by Romy Varghese
February 7, 2017, 2:01 AM PST
New Jersey’s Kean University is joining a growing number of colleges tapping outsiders to finance dorms, a step that holds down debt as they cope with declining state aid and pressure to limit tuition increases.
Kean, the fourth-largest public university in the Garden State, located about 20 miles (32 kilometers) southwest of Manhattan, is working with a Baton Rouge, Louisiana-based non-profit to finance a new 385-bed dorm on campus. Provident Group-Kean Properties LLC is planning to sell $43.3 million municipal bonds Wednesday to pay for the project.
Rendering of new Kean University dorm building.Source: Kean University
“We’re able to, rather than tacking on more debt to the university directly, have this partner share in the burden,” said Felice Vazquez, Kean’s associate vice president for strategic initiatives.
Kean, the University of Massachusetts Boston, and Texas A&M are among universities that in the last year turned to separate non-profits to build dorms backed solely by revenue from the projects. That preserves universities’ capacity to borrow for classrooms and labs while reducing the risks of constructing new housing facilities that are a selling point to prospective students.
“Some universities are choosing a strategy of sticking to their knitting and divesting itself of anything that’s not purely academic,” said Jessica Matsumori, an analyst with S&P Global Ratings. In addition, “developers are seeing quite a bit of opportunity in this space and they’re getting much more aggressive in their marketing and pitching to universities.”
While such deals don’t officially add to a university’s debt, Matsumori said the company considers them contingent liabilities, given that administrators may want to spare their schools the stigma of a default.
“We believe if the project were distressed, they would likely be compelled to step in and assist – as it would affect their students, possibly their campus, and potentially their reputation,” Matsumori said.
Kean enrolled about 15,500 students for the current academic year, with about 2,000 living on campus. The university, which offers admission to about three-quarters of applicants, has adopted a strategic plan that calls for more rigorous academic programs and decreasing the share of students living off campus.
“When you’re here, 7 days a week, 24 hours a day, you do better and you’re more likely to graduate in four years,” said Vazquez.
With about $340 million in outstanding debt carrying an A- rating, Kean isn’t on the hook to pay debt service for the new dorm, which is replacing half-century-old residence halls and will include a 2,000 square foot bistro once it’s finished in August 2018.
Kean will treat the new dorm as part of its student housing program and won’t build and operate another unless there’s demand enough to keep them filled, according to an S&P rating report. In addition, Kean, which is managing the residence hall, agreed to reduce the number of spaces elsewhere so the new project will have enough students to meet debt-service coverage requirements.
S&P rates the bonds BBB-, the lowest investment grade and three steps below the university’s bonds.
Kean’s partner, Provident Resources Group, was founded in 1999 by a former public finance lawyer. The non-profit owns student housing at Montclair State University in New Jersey, Towson University in Maryland, and North Carolina State University.
In October, Provident partnered with the UMass Boston to finance a 1,080-bed residence hall, the commuter school’s first. Provident Commonwealth Education Resources, Inc. priced about $130 million of bonds rated BBB- for yields of as much as 3.74 percent on securities due in 32 years, or about 2 percentage points more than top-rated debt, according to data compiled by Bloomberg. With interest rates having risen since, the bonds traded for an average yield of about 4.4 percent this week.
Provident Commonwealth will own the dorm. Birmingham, Alabama-based Capstone Companies will develop and manage the facility. UMass Boston will get about $1 million per year in rent after bondholders are paid.
“We don’t have any housing on the campus right now, so it just really makes sense to bring in a private operator,” said Patricia Filippone, executive director of the University of Massachusetts Building Authority. She said the financing will help the university preserve debt capacity for projects that don’t directly generate revenue.
The project is being done as a “design-build” in which design and construction are contracted to single entity. Advocates say better coordination allows problems to be solved faster. Governments benefit from contracting with a single entity responsible for guaranteeing price and schedule.
“This is just a more efficient delivery method,” said Filippone.
Bloomberg
by Martin Z Braun
February 8, 2017, 2:00 AM PST
Taylor Riggs, a contributor to Bloomberg Briefs, talks with Editor Joe Mysak about this week’s municipal market news.
Bloomberg
February 9, 2017
Fitch Ratings-New York-01 February 2017: Moody’s Investor Services (Moody’s) has issued a report discussing:
–Legal options available to the Chicago Public Schools (CPS) to address its operating deficit, suggesting CPS can divert state aid to support operations to get around a restriction on a certain tax levy; and
–Bondholder protections provided by CPS’ dedicated capital improvement tax bonds series 2016 (CIT bonds), minimizing the special revenue status while crediting a ‘lock box’ device as a real enhancement.
Fitch Ratings disagrees with Moody’s on both points.
State Aid Not Available for Budget Relief
Moody’s report “Chicago Public Schools, IL Frequently Asked Questions”, released on Jan. 12, states “the district could elect to use unrestricted [general state aid] GSA for operations instead of debt service” on alternate bonds issued under the Illinois Local Government Debt Reform Act (the Act). Unless by ‘elect’ Moody’s is referring to a successful ballot referendum, a plain reading of the Act indicates this is not the case. Section 15(e) of the Act clearly indicates that CPS must apply available alternate revenues {state aid} to debt service. As there is no option in the law to apply alternate revenues to operations, Fitch believes any attempt to do it would draw a successful challenge in litigation opposing an attempt to levy taxes while alternate revenues were available for debt service.
The law (Section 15(e)) is pretty clear in our opinion, as it states: “[t]he …revenue source ..shall be in fact pledged to the payment of the alternate bonds; and the governing body shall covenant, to the extent it is empowered to do so, to provide for, collect AND APPLY [emphasis added] such …revenue source …to the payment of the alternate bonds.” It further states “The pledge …as provided in this Section for alternate bonds, shall constitute a continuing obligation of the governmental unit … and a continuing appropriation of the amounts received. All covenants relating to alternate bonds and the conditions and obligations imposed by this Section are enforceable by any bondholder of alternate bonds affected, any taxpayer of the governmental unit, and the People of the State of Illinois acting through the Attorney General … The intent is that such revenue source, shall be …applied to the payment of debt service on such alternate bonds so that taxes need not be levied, or if levied need not be extended, for such payment.”
Alternate Bonds Not Same as Other ULTGOs
Fitch believes this constraint on extending property taxes absent a referendum is consistent with the Property Tax Extension Limitation Law (PTELL), which limits growth in the property tax extension to the lesser of 5% or CPI in the prior calendar year unless the increase is approved by voters. Debt service is limited to the “debt service extension base”, which is based on the 1994 property tax extension for debt service, increased annually at the lesser of 5% or CPI, unless approved by voters. The Act exempts alternate bonds from this limitation. If an entity could readily opt to extend the property tax instead of paying debt service from the identified revenue source (GSA, in this case) despite the availability of the alternate source, the PTELL’s constraint on the rate of property tax growth for debt service would be ineffective. Fitch believes that the only way CPS could extend the ad valorem tax for debt service would be an insufficiency of pledged state aid revenues, which of course would create other serious financial challenges.
Lockbox Does Not Enhance Credit Quality
Unlike Moody’s, Fitch does not give rating uplift for the presence of a third-party lockbox structure absent other legal considerations. A lock box is a simple security device that loses its effectiveness upon a bankruptcy filing as a consensual lien on revenues generally does not continue once bankruptcy begins. There are two exceptions: bonds secured by pledged special revenues and bonds secured by a statutory lien. In a Chapter 9 bankruptcy, Fitch does not believe such a structure would insulate ordinary pledged revenues from an automatic stay. Therefore bonds utilizing that structure but not secured by pledged ‘special revenues’ as defined under section 902(2) of the code or by a statutory lien on pledged revenues could not be rated above the Issuer Default Rating (IDR).
No Statutory Lien Under Bankruptcy Code
Fitch also does not agree that the CIT bonds are secured by a statutory lien, which is defined in Section 101(53) of the Code as a lien arising automatically, by force of statute, on specified circumstances or conditions. This lien is in contrast to a consensual lien (or security interest [defined in Section 101(51) of the Code]), in which a lien is created by agreement, where both parties to a financing agree to a certain security structure and document that agreement in an indenture or loan document. The Debt Reform Act does not provide a statutory lien for bondholders as defined in the bankruptcy code. It gives effect to a consensual lien without any further requirement for filing or notice and is a protection against other lien holders.
Bankruptcy Protection Arises from Special Revenue Designation
Fitch believes that the pledged CIT revenues would be considered ‘pledged special revenues’ in the event of a CPS bankruptcy. As Moody’s points out, one of the differences between the alternate and CIT bond structures is that the former are “ultimately a general obligation of the district, which pledged its full faith and credit to their repayment.” The CIT bonds are “payable from the CIT tax levies only.” Fitch believes that this distinction is precisely the reason the CIT bonds can be considered to be secured by special revenues under 902(2)(E) of the code. As stated in Fitch’s rating action commentary discussing our ‘A’ rating/Outlook Stable on the bonds: “Fitch sets a high bar for considering local government tax-supported debt to be secured by special revenues, which provide security that survives the filing of a municipal bankruptcy (in preservation of the lien) and benefit from relief from the automatic stay provision of the bankruptcy code. We give credit to special revenue status only if, in our view, the overall legal framework renders remote a successful challenge to the status of the debt as secured by special revenues under Section 902 (2)(E) of the U.S. Bankruptcy Code.
“Fitch has identified a number of elements we consider sufficient to reduce the incentive to challenge the special revenue status given the definitions outlined in the bankruptcy code. These include clear statutory restrictions on the use of pledged revenues to finance identified projects and clear separation from the entity’s operations. Fitch has undertaken an extensive review of the statutory provisions that govern the use of the CIT. Those provisions, along with the legal documents governing the bond issuance, and related bankruptcy opinions provide sufficient strength for Fitch to rate the CIT bonds higher than the IDR.
“The bonds are secured by a first priority lien on CIT revenues. The board is authorized under the Illinois School Code to levy the CIT on all taxable property within the district, which is coterminous with the city of Chicago. State statute limits the permitted uses of CIT revenues to include construction, acquisition and equipping of school and administrative buildings, and site improvements. The board has identified specific capital projects in the bond resolution that may be funded either by bond proceeds or by residual CIT revenues. Any amendments to the project list must be passed by board resolution. The revenues legally cannot be used for general operations of the board.”
CIT Bonds Not Same as Detroit’s DSA Bonds
Revenue ownership is crucial. Moody’s likens the CIT bonds to Detroit’s distributable state aid (DSA) bonds, as in both cases the trustee receives the pledged revenues directly from a third party. However, Fitch views as a crucial distinction that the DSA revenues were not property of the city of Detroit, thus not included in the city’s bankruptcy estate. In the case of CPS, however, the CIT revenues are clearly property of the district. Were they not, Fitch’s rating would have been based on the credit quality of Cook County, which collects the revenues and remits them to the trustee. Fitch’s IDR on Cook County of ‘A’/Stable Outlook, does not cap the CPS rating.
Contact:
Amy Laskey
Managing Director
+1-212-908-0568
Fitch Ratings, Inc.
33 Whitehall Street
New York, NY 10004
Arlene Bohner
Senior Director
+1-212-908-0554
Media Relations: Elizabeth Fogerty, New York, Tel: +1 (212) 908 0526, Email: elizabeth.fogerty@fitchratings.com.
Additional information is available at ‘www.fitchratings.com’
ALL FITCH CREDIT RATINGS ARE SUBJECT TO CERTAIN LIMITATIONS AND DISCLAIMERS. PLEASE READ THESE LIMITATIONS AND DISCLAIMERS BY FOLLOWING THIS LINK: HTTPS://WWW.FITCHRATINGS.COM/UNDERSTANDINGCREDITRATINGS. IN ADDITION, RATING DEFINITIONS AND THE TERMS OF USE OF SUCH RATINGS ARE AVAILABLE ON THE AGENCY’S PUBLIC WEB SITE AT WWW.FITCHRATINGS.COM. PUBLISHED RATINGS, CRITERIA, AND METHODOLOGIES ARE AVAILABLE FROM THIS SITE AT ALL TIMES. FITCH’S CODE OF CONDUCT, CONFIDENTIALITY, CONFLICTS OF INTEREST, AFFILIATE FIREWALL, COMPLIANCE, AND OTHER RELEVANT POLICIES AND PROCEDURES ARE ALSO AVAILABLE FROM THE CODE OF CONDUCT SECTION OF THIS SITE. FITCH MAY HAVE PROVIDED ANOTHER PERMISSIBLE SERVICE TO THE RATED ENTITY OR ITS RELATED THIRD PARTIES. DETAILS OF THIS SERVICE FOR RATINGS FOR WHICH THE LEAD ANALYST IS BASED IN AN EU-REGISTERED ENTITY CAN BE FOUND ON THE ENTITY SUMMARY PAGE FOR THIS ISSUER ON THE FITCH WEBSITE.
Copyright © 2017 by Fitch Ratings, Inc., Fitch Ratings Ltd. and its subsidiaries. 33 Whitehall Street, NY, NY 10004. Telephone: 1-800-753-4824, (212) 908-0500. Fax: (212) 480-4435. Reproduction or retransmission in whole or in part is prohibited except by permission. All rights reserved. In issuing and maintaining its ratings and in making other reports (including forecast information), Fitch relies on factual information it receives from issuers and underwriters and from other sources Fitch believes to be credible. Fitch conducts a reasonable investigation of the factual information relied upon by it in accordance with its ratings methodology, and obtains reasonable verification of that information from independent sources, to the extent such sources are available for a given security or in a given jurisdiction. The manner of Fitch’s factual investigation and the scope of the third-party verification it obtains will vary depending on the nature of the rated security and its issuer, the requirements and practices in the jurisdiction in which the rated security is offered and sold and/or the issuer is located, the availability and nature of relevant public information, access to the management of the issuer and its advisers, the availability of pre-existing third-party verifications such as audit reports, agreed-upon procedures letters, appraisals, actuarial reports, engineering reports, legal opinions and other reports provided by third parties, the availability of independent and competent third- party verification sources with respect to the particular security or in the particular jurisdiction of the issuer, and a variety of other factors. Users of Fitch’s ratings and reports should understand that neither an enhanced factual investigation nor any third-party verification can ensure that all of the information Fitch relies on in connection with a rating or a report will be accurate and complete. Ultimately, the issuer and its advisers are responsible for the accuracy of the information they provide to Fitch and to the market in offering documents and other reports. In issuing its ratings and its reports, Fitch must rely on the work of experts, including independent auditors with respect to financial statements and attorneys with respect to legal and tax matters. Further, ratings and forecasts of financial and other information are inherently forward-looking and embody assumptions and predictions about future events that by their nature cannot be verified as facts. As a result, despite any verification of current facts, ratings and forecasts can be affected by future events or conditions that were not anticipated at the time a rating or forecast was issued or affirmed.
The information in this report is provided “as is” without any representation or warranty of any kind, and Fitch does not represent or warrant that the report or any of its contents will meet any of the requirements of a recipient of the report. A Fitch rating is an opinion as to the creditworthiness of a security. This opinion and reports made by Fitch are based on established criteria and methodologies that Fitch is continuously evaluating and updating. Therefore, ratings and reports are the collective work product of Fitch and no individual, or group of individuals, is solely responsible for a rating or a report. The rating does not address the risk of loss due to risks other than credit risk, unless such risk is specifically mentioned. Fitch is not engaged in the offer or sale of any security. All Fitch reports have shared authorship. Individuals identified in a Fitch report were involved in, but are not solely responsible for, the opinions stated therein. The individuals are named for contact purposes only. A report providing a Fitch rating is neither a prospectus nor a substitute for the information assembled, verified and presented to investors by the issuer and its agents in connection with the sale of the securities. Ratings may be changed or withdrawn at any time for any reason in the sole discretion of Fitch. Fitch does not provide investment advice of any sort. Ratings are not a recommendation to buy, sell, or hold any security. Ratings do not comment on the adequacy of market price, the suitability of any security for a particular investor, or the tax-exempt nature or taxability of payments made in respect to any security. Fitch receives fees from issuers, insurers, guarantors, other obligors, and underwriters for rating securities. Such fees generally vary from US$1,000 to US$750,000 (or the applicable currency equivalent) per issue. In certain cases, Fitch will rate all or a number of issues issued by a particular issuer, or insured or guaranteed by a particular insurer or guarantor, for a single annual fee. Such fees are expected to vary from US$10,000 to US$1,500,000 (or the applicable currency equivalent). The assignment, publication, or dissemination of a rating by Fitch shall not constitute a consent by Fitch to use its name as an expert in connection with any registration statement filed under the United States securities laws, the Financial Services and Markets Act of 2000 of the United Kingdom, or the securities laws of any particular jurisdiction. Due to the relative efficiency of electronic publishing and distribution, Fitch research may be available to electronic subscribers up to three days earlier than to print subscribers.
For Australia, New Zealand, Taiwan and South Korea only: Fitch Australia Pty Ltd holds an Australian financial services license (AFS license no. 337123) which authorizes it to provide credit ratings to wholesale clients only. Credit ratings information published by Fitch is not intended to be used by persons who are retail clients within the meaning of the Corporations Act 2001
ENDORSEMENT POLICY – Fitch’s approach to ratings endorsement so that ratings produced outside the EU may be used by regulated entities within the EU for regulatory purposes, pursuant to the terms of the EU Regulation with respect to credit rating agencies, can be found on the EU Regulatory Disclosures page. The endorsement status of all International ratings is provided within the entity summary page for each rated entity and in the transaction detail pages for all structured finance transactions on the Fitch website. These disclosures are updated on a daily basis.
CHICAGO – Fitch Ratings in a report Wednesday criticized Moody’s Investors Services’ recent assessment of Chicago Public Schools’ new credit structure and the legal options available to ease its distress.
The report titled “Fitch Disagrees With Moody’s Legal Analysis On Chicago Public Schools” was published to counter arguments laid out by Moody’s in special credit profile reports published Jan. 12 about the city and CPS.
Fitch’s public dissection of another rating agency’s opinions was described as “highly unusual” by several market participants.
“This is uncharted. Very rarely except on panels at conferences would you have this sort of open debate or defensiveness,” said Howard Cure, director of municipal research at Evercore Wealth Management, LLC. Cure worked for Moody’s until 1994.
Moody’s has not been asked to rate new deals by either issuer, but maintains junk ratings on their older debt.
Some suggested that Fitch’s motive for publicly calling out a peer rating agency may stem from market questions received after Moody’s released its commentary.
Fitch said that wasn’t the case.
“We read it and we didn’t feel all the information was correct and felt it would helpful to the market if we posed our reasons as to why we disagreed,” said the report’s co-author, Amy Laskey, a Fitch managing director.
“Our goal is to clearly articulate an opinion, and often that means openly disagreeing with other market participants. We may publish those comments if there is strong investor interest, or if we feel our view is meaningfully different from another,” said Daniel Noonan, Fitch’s global head of corporate communications.
Fitch outlines its disagreement with Moody’s on several aspects of its legal assessment of CPS’ new capital improvement tax-backed bonds. The district used the new property tax levy for the first time on a $730 million sale in December.
The deal garnered an A rating from Fitch based on analysts’ confidence in its bankruptcy-remote structure.
CPS asked only Fitch and Kroll Bond Rating Agency to review the bonds. Kroll assigned its BBB rating in line with its GO ratings of BBB and BBB-minus.
Fitch rates CPS GO debt B-plus, with a stable outlook. The other two rating agencies also rate CPS GOs at junk.
Fitch countered Moody’s suggestion that triggering the ad valorem tax pledge used on most of its $6 billion of debt offered one option for CPS to free up revenue for operations.
Fitch quoted Moody’s report suggesting that the district could elect to use unrestricted general state aid for operations instead of debt service on its alternate bonds issued under the Illinois Local Government Debt Reform Act.
Under the state’s alternate revenue structure, an ad valorem tax levy is imposed to repay bonds but it is typically abated as the “alternate” revenues are tapped. About $373 million in CPS state aid will go to such bond repayments this year.
“We believe that the most likely scenario for CPS is that the district will levy for debt service on GO alternate revenue bonds in order to free up state aid for operations,” Moody’s wrote. “The district could elect to use unrestricted GSA for operations instead of debt service.”
“Unless by ‘elect’ Moody’s is referring to a successful ballot referendum, a plain reading of the act indicates this is not the case,” Fitch countered, arguing that the act “clearly” indicates that CPS must apply available alternate revenues to debt service.
“As there is no option in the law to apply alternate revenues to operations, Fitch believes any attempt to do it would draw a successful challenge in litigation opposing an attempt to levy taxes while alternate revenues were available for debt service,” Fitch wrote in the report, co-authored by Laskey and lead CPS analyst Arlene Bohner.
Fitch also countered Moody’s position on various features of the district’s capital improvement tax structure. Moody’s had written that features like a “lockbox” on revenues helped “lessen but do not eliminate the risk of bondholder impairment in a future bankruptcy.”
“Unlike Moody’s, Fitch does not give rating uplift for the presence of a third-party lockbox structure absent other legal considerations,” its report said.
A lockbox is a security device that loses its effectiveness in bankruptcy, Fitch said, because a consensual lien on revenues generally does not continue unless the bonds are secured by pledged special revenues or they qualify as bonds secured by a statutory lien.
“In a Chapter 9 bankruptcy, Fitch does not believe such a structure would insulate ordinary pledged revenues from an automatic stay,” analysts wrote. “Fitch also does not agree that the CIT bonds are secured by a statutory lien.”
Fitch’s belief that the bonds would be protected in Chapter 9 stems from opinions that they meet the bankruptcy code’s designation of “pledged special revenues” which offers some insulation from impairment.
The belief stems from structural features such as the fact that the bonds are payable solely from segregated CIT revenues that can be used only for capital projects or CIT bond repayment and not for operations.
“We give credit to special revenue status only if, in our view, the overall legal framework renders remote a successful challenge to the status of the debt as secured by special revenues,” Fitch wrote.
In its January report, Moody’s had written that it viewed the new structure “to be at least as strong as, if not modestly stronger than, CPS’s GO bonds.”
State law would have to change to allow the school district to file for bankruptcy.
Moody’s spokesman David Jacobson had no direct response to the Fitch report, saying his agency’s Jan. 12 speaks for itself.
Cure said Moody’s opinion “carries weight with the market.”
He noted that the city of Chicago’s recent GO deal priced at junk levels, even though Moody’s is the only rating agency to rate Chicago at junk. CPS’ 30-year CIT bond – despite the Fitch A rating and BBB from Kroll – landed 309 basis points over the Municipal Market Data’s top-rated benchmark, 243 basis points over the single A benchmark, and 207 basis points over the BBB benchmark.
Moody’s January reports were released ahead of Chicago’s $1.16 billion GO sale and followed the city’s disclosure that it had asked Moody’s to withdraw all of its city ratings in December. Moody’s declined to withdraw.
The Bond Buyer
By Yvette Shields
February 1, 2017
CHICAGO – President Donald Trump’s agenda to repeal the Affordable Care Act and punish ‘sanctuary cities’ for resisting him on immigration is making its presence felt in the $3.8 trillion municipal bond market.
Municipal bond sales next week from New York City, the state of Oregon and a California health care provider worth nearly $1.7 billion include warnings to potential buyers that Trump’s policies could pose a financial risk to these issuers.
The Republican president signed an order on Jan. 25 directing the U.S. attorney general and Homeland Security secretary to withhold federal money from cities that adopted sanctuary policies for undocumented immigrants.
Trump is also pushing to repeal and replace the Affordable Care Act also known as Obamacare, reform the tax code and roll back some or all of the Dodd-Frank financial regulation law.
New York City on Tuesday told potential investors for its upcoming $800 million bond sale that its sanctuary city status should not result in a substantial loss in federal funding due to Trump’s recent executive order.
While sanctuary city is not an official designation, it represents policies adopted by municipalities where local law enforcement refuse to report undocumented immigrants they encounter to federal authorities. Municipalities have said this does not apply in the case of an undocumented immigrant involved in such things as violent crimes.
Self-proclaimed sanctuary cities say they have identified legal holes in the Trump Administration’s arguments saying it cannot cut funding for health care and education.
In the preliminary official statement for the general obligation bonds pricing through Citigroup, New York said federal grants related directly to immigration enforcement comprise a small portion of its budget and that grants supporting law enforcement in general would be exempted from the order.
“If implementation of the executive order results in the reduction of federal aid to the city, the city expects that it would mount a vigorous legal challenge,” the disclosure said. “However, there can be no guarantee that implementation of the executive order will not result in a significant reduction or delay in receiving such aid.”
In addition to New York, other major cities offering some form of protection to illegal immigrants include Los Angeles, Chicago, Philadelphia, Boston, Denver, Washington, and Seattle.
Another sanctuary city, San Francisco, filed a legal challenge to the order this week. Billions of dollars in federal aid to those cities could be at risk.
Trump and the Republican-controlled Congress also have the repeal of the Affordable Care Act on their agenda.
Oregon, which is selling $491 million of general obligation bonds through Citigroup, pointed to uncertainty surrounding the Affordable Care Act and its financial support for expanded numbers of Medicaid recipients. Any kind of repeal or replacement of the act “could have a material adverse effect on the financial condition of the state.”
The California Municipal Finance Authority also warned investors in a $405 million conduit debt offering prospectus for a nonprofit health care provider, Community Medical Centers. The document said federal tax reform, the rollback of Dodd-Frank, or replacing the ACA “could have a material impact on the Obligated Group’s operations and financial results.”
By Karen Pierog and Hilary Russ • Reuters Feb 3, 2017
On February 1, the House Transportation and Infrastructure Committee held a hearing on the future of infrastructure, focused largely on the funding of infrastructure projects.
Ranking Member Peter DeFazio (D-Ore.), as well as numerous members of the committee from both parties, expressed support for user fees and other dedicated revenue streams to pay for certain infrastructure projects. The only mention of municipal bonds came from Ranking Member DeFazio, who suggested that 30-year federal infrastructure bonds should be considered as a possible funding option for infrastructure projects.
Witnesses included Frederick W. Smith, Chairman and Chief Executive Officer of the FedEx Corporation; David W. MacLennan, Chairman and Chief Executive Officer of Cargill; Ludwig Willisch, President and Chief Executive Officer of BMW of North America; Mary V. Andringa, Chair of the Board of the Vermeer Corporation; and Richard L. Trumka, President of the AFL-CIO.
The Governmental Accounting Standards Board (GASB) has issued guidance for state and local governments regarding what constitutes fiduciary activities for financial reporting purposes, how fiduciary activities should be reported, and when liabilities to beneficiaries should be recognized.
Governments currently are required to report fiduciary activities in fiduciary fund financial statements. Existing standards are not explicit, however, about what constitutes a fiduciary activity for financial reporting purposes. Consequently, there is diversity in practice with regard to identifying and reporting fiduciary activities.
GASB Statement No. 84, Fiduciary Activities, establishes criteria for identifying fiduciary activities of all state and local governments. The criteria generally focus on:
Separate criteria are included to identify fiduciary component units and postemployment benefit arrangements that are fiduciary activities.
An activity meeting the criteria in Statement 84 should be reported in a fiduciary fund in the basic financial statements. Governments with activities meeting the criteria should present a statement of fiduciary net position and a statement of changes in fiduciary net position.
Statement 84 describes four types of fiduciary funds that should be reported, if applicable. The Statement clarifies the definitions of the three existing fiduciary funds associated with trusts that meet specific criteria:
Activities now reported in agency funds will be classified as custodial funds when Statement 84 is implemented.
Some states are seeking to fill funding holes and potholes with toll money. But it’s an uphill battle.
Tolls have been a fact of life in Indiana for at least 60 years, but state Rep. Edmond Soliday thinks there will have to be more of them if the state wants to keep its roads in good shape.
Soliday, a Republican who chairs his chamber’s transportation committee, said the most expensive part of the state’s transportation network are the heavily trafficked interstates that are filled with out-of-state trucks. Federal law, however, prevents states from tolling existing interstates without a waiver.
“I say to citizens and my fellow legislators: How much do the citizens of Indiana owe to provide an infrastructure to folks who don’t even stop for a Snickers bar?” said Soliday. “It’s irresponsible not to take a look at how much of it are Hoosiers willing to pay so that others can use it.”
So Soliday introduced an ambitious road-funding bill earlier this month that would instruct the Indiana Department of Transportation to apply for a federal waiver and to study how tolls could be added.
As traditional sources of transportation revenue, like gas taxes, have declined, tolling has increasingly become a part of everyday life for many Americans.
The miles of managed lanes with tolls on them has quadrupled since 2010. The number of drivers using toll facilities increased by 7 percent in just a single year, from 2014 to 2015. That growth could continue if lawmakers in places like Connecticut or Wisconsin move ahead this year with long-stalled plans to introduce tolling in their states.
There’s been a lot of discussion about whether a federal infrastructure stimulus from the Trump administration could help alleviate states’ fiscal pressures on transportation. But Soliday said he isn’t depending on help from Washington. Besides, he said, the longer the state waits for help from the federal government, the worse its roads get in the meantime and the more expensive they get to fix.
Tolls may be an expedient source of revenue in the near term, but Soliday’s real case is that they’ll become even more vital in the years ahead.
Thanks to increasing federal fuel standards, auto manufacturers will soon have to start producing more fuel-efficient vehicles. That could lead to an even bigger drop in gas tax revenue. The firm Cambridge Systematics predicted that, after accounting for inflation, the $450 million in revenue that Indiana’s gas tax produced in 2015 will bring in only about $300 million a decade from now.
“We have this huge hole starting in 2021,” said Soliday. “The issue is: How do you plug the hole if you can’t do it with a reasonable amount of gasoline tax? Tolling is clearly how we’re filling that gap starting in the 2021 era in the plan.”
But tolling existing interstates, as Soliday proposes, won’t be easy.
GOP Gov. Eric Holcomb is reportedly against the idea, and the Senate president has called it a “hard sell.” The trucking industry, which opposes most toll increases, will also likely push back.
In addition to upping the number of tolls, Soliday’s bill would also increase gas taxes, levy new fees for electric vehicles and hike vehicle registration fees. But raising the state’s gas tax would be hard, too.
Indiana voters are unlikely to accept a gas tax increase of more than 10 cents per gallon, said Soliday. Even if they did, a hike that size would only make up for the revenue lost to inflation since Indiana last raised its gasoline tax in 2003 and its diesel tax in 1998.
To improve local roads, Soliday’s bill would use the revenue raised from higher registration fees to build on a program created by Indiana lawmakers that set up matching grants for localities that would fund 50 percent of a project’s costs up to $1 million. According to Purdue researchers, 26 percent of city roads, 29 percent of town roads and 40 percent of county roads are in poor condition — and it would take $773 billion just to keep the road quality the same over the next decade. To make sure no roads were in poor condition, it would cost the state $1.6 trillion.
The bottom line, said Soliday, is that Indiana can’t achieve its goals without tolling or something else that will bring in that kind of revenue.
“If you take anything out of the package, then you’ve got to put something in, or you’ve got to lower expectations,” he said. “It’s a closed system.”
GOVERNING.COM
BY DANIEL C. VOCK | JANUARY 30, 2017
They would be mostly — but not all — good for state and local revenues.
The expectations over driverless cars are stratospherically high. For one, there’s the fascination with the technology and the presumption of an easier commute: The self-driving car will take us to work while we surf the Internet, read files and review emails. Once it drops us off, it returns home where others in our household can use it — until it’s time to call it to pick us up and take us home again.
There’s more to this futuristic concept than creature comforts, though. With self-driving cars anticipated to be in wider use on our roads within four years, there are promises of extraordinary impacts on state and local finances — most of them positive; a few not. Several reports from some of the biggest names in banking put startling numbers on the effects wrought by a changeover to driverless driving.
Let’s start with Morgan Stanley. Its new report, Autonomous Vehicles & Municipal Bonds, puts the net positive impact on municipal budgets in excess of half a trillion dollars. That number takes into account more efficient roadway use and a dramatic reduction in parking garages and parking spaces. With parking facilities no longer needed, those properties can be turned into higher-level development, which would provide municipalities with a boost in property taxes. Offsetting those gains, Morgan Stanley foresees losses of roughly $1.3 billion from such revenue sources as fuel taxes, license fees, parking fees, speeding tickets and personal property taxes.
Barclays, the British banking and financial services company, notes that transportation in the U.S. is the second highest average household expenditure and that the average car is parked 95 percent of the time. It estimates that the average U.S. household will reduce its car ownership from today’s 2.1 vehicles to 1.2. (A figure also cited in a University of Michigan Transportation Research Institute study.) For states and localities, such a reduction could signal an end to what Barclays calls “the fretting” about investing in additional highway lanes or new roads.
That lack of fretting would have quite an effect on infrastructure and the municipal bonds that finance it. The impact starts with this forecast from several researchers: A single self-driving car could replace up to 12 regular vehicles. If that happens, it would affect some of the existing $3 billion in dedicated tax-exempt state and local parking revenue bonds. It would also affect airport revenue bonds. Airports currently generate 28 percent of their operating revenue from rental cars, parking and ground transportation — revenue that could be at risk from the cascading parking effects of self-driving cars.
The influence on general obligation bonds would be significant in a more positive way. The greater efficiency of self-driving cars and the ability to fit triple the amount of traffic in existing lanes could sharply reduce current projected needs for infrastructure and therefore the need to borrow money to build new roads.
There are other revenue savings. Self-driving cars are predicted by the National Transportation Safety Board to save “many, if not most, of the 33,000 lives lost to traffic fatalities every year on our streets and highways.” If true, this would lead to a major benefit via the $18 billion annual health-care costs from emergency room visits related to motor vehicle injuries, injuries that currently average 15 percent of hospitalized injuries — not to mention the costs to local emergency responders.
Then there’s this: For many police departments, 42 percent of police contacts are initiated during a traffic stop — with driving under the influence of alcohol being the second highest cause. Self-driving cars would render DUIs virtually obsolete. That would be a signal benefit not only — and most important — on innocent lives saved, but also in a diminution of emergency medical and police costs.
No wonder Morgan Stanley came up with a half-a-trillion dollar figure.
GOVERNING.COM
BY FRANK SHAFROTH | JANUARY 2017
Kicking the can down the road is always tempting. But for infrastructure, innovative public-private partnerships offer a prudent alternative.
When infrastructure maintenance is deferred or a pension contribution is skipped, critics of imprudent public spending are quick to label it as “kicking the can down the road.” But that doesn’t really capture the essence of the practice. It’s a form of borrowing. More cash is available in the current period, but a future obligation in the same amount, plus accrued costs, is created. Just like a loan.
If done infrequently in small amounts and reversed quickly, borrowing by kicking the can is probably benign or even beneficial. State and local governments face many fiscal rules and limits; these constraints impose good discipline in the long run but can make it hard to square the circle when growth is uncertain and revenues are volatile. So a bit of slack can help hard-pressed public-sector officials cope with uncertainty and make better choices.
But the results are far from benign when this tactic morphs into a year-over-year budget gimmick that can accrue large and insidiously expensive liabilities without any plan for paying them. Kicking the can then becomes not a temporary coping strategy but an addictive credit card from hell. Deferred maintenance and underfunded pensions appear to be the high-limit platinum cards of this set, but there are others, including underfunding of future health-care obligations and delaying obviously valuable public-sector investment.
Infrastructure is a sitting duck for fiscal can-kicking. Existing infrastructure bears the brunt of maintenance deferral. New infrastructure projects, no matter how badly they are needed, don’t happen because the loss of value in delaying them is rarely as obvious as the cash saved by doing so.
Infrastructure spending is also an impetus for kicking the can, not just a target. The significant fixed and non-delayable obligations of public infrastructure can intensify fiscal constraints and increase pressure to defer critical spending elsewhere in the budget. Spending on an infrastructure asset’s basic operations, for example, might crowd out a more-or-less optional police pension contribution when a city’s budget is squeezed.
Using credit cards from hell for fiscal management is obviously unwise. But revenue volatility and low growth appear to be the new normal for the public-sector’s fiscal environment. The pressure to delay essential spending will remain or even increase. It’s easy to criticize poor choices in tough situations, but it’s more useful to ask: what better tools are available?
When infrastructure is involved, emerging forms of public-private partnerships (P3s) are a promising answer to that question. Availability-Payment P3s, for example, cut up the deferred-maintenance credit card by requiring adherence to an optimal schedule based on a project’s whole-life costing. Design-Build P3s incorporate an efficient project development and completion process that can operate outside the sometimes overly restrictive constraints of traditional procurement.
But using P3s for disciplined maintenance or faster delivery means that fixed-infrastructure payments will be higher and arrive sooner. In effect, current-generation P3s may simply shift the budget pressure away from infrastructure toward crowding out something else. Not much is gained if lower levels of deferred maintenance and delayed investment result in higher levels of underfunded pensions and health-care obligations. And the fear of being put in an even tighter budget corner, combined with the allure of yet another round of can-kicking, may cause public-sector officials to hesitate on P3s, which may be one explanation for their disappointingly slow uptake in the United States.
In this complex and frustrating situation, private-sector innovation could be transformative. The objective should be to improve P3s with respect to real-world fiscal and budget concerns. Achieving this should not be difficult given the high credit quality of most state and local governments and the excellent collateral value of infrastructure assets. For example, an Availability-Payment P3 that permits lower payments when a budget shortfall occurs but requires higher make-up payments when revenues are back to normal is financially feasible.
The value proposition for innovation is straightforward. There’s clearly enormous potential for improvement over the public sector’s current set of opaque, costly and dangerous credit cards from hell. It’s realistic to expect that next-generation P3s could go a long way toward replacing them with transparent, cost-effective and prudent alternatives.
GOVERNING.COM
BY JOHN RYAN | JANUARY 31, 2017
A roundup of money (and other) news governments can use.
GOVERNING.COM
BY LIZ FARMER | FEBRUARY 3, 2017
In much of the country, states are offering localities less financial help than they were before the recession. That won’t change anytime soon.
The fire department in Springfield, Ohio, has grown accustomed to frugal times. Calls for service keep climbing, but staff levels are frozen. Firefighters themselves fix vehicles and breathing equipment in order to save money on repair contracts. Recently, when a fire engine’s generator failed and they couldn’t afford to replace it, they had to mount a portable generator and rig it to work.
Springfield’s revenue is below the levels of a decade ago, not even counting inflation. The city has responded by eliminating administrative staff, deferring maintenance and taking other measures intended to be least burdensome for residents. “The last five or six years has been nothing but one cut after another,” says Warren Copeland, the city’s mayor. “We’ve reached the point where any of the cuts we make from here on out are much more noticeable.”
GOVERNING.COM
BY MIKE MACIAG, J.B. WOGAN | FEBRUARY 2017
GFOA’s best practices in school guidelines are centered on a comprehensive budget process framework focused on academic and finance collaboration to best align resources and desired student outcomes. The framework represents the culmination of a multi-year effort led by GFOA, with input from numerous school district officials and other experts in education finance to develop guidelines for better budgeting tailored specifically for school districts.
The recommended framework is not limited to financial topics. A robust budget process should engage and communicate with stakeholders, along with prioritizing goals, allocating resources, and tracking progress. The budget process is a plan, a tool for transparency, and a structure for ensuring accountability.
Budgeting—the process by which programs and services are planned and funds are allocated to accomplish their goals— is crucial to any organization’s success. The need for better budgeting is ever more pressing given the constant pressure to provide high-quality services with limited resources. This is especially true in school districts, where budget decisions can affect the education of future generations.
GFOA’s best practices in school budgeting framework begins with guidelines for district-wide communication and collaboration, including setting baseline expectations for what the budget process will achieve. The focus then shifts to developing robust goals and integrating the process with the district’s strategic plan, including developing a comprehensive package for implementing a district’s goals, or instructional priorities. Also included are guidelines on how to develop a strategic financial plan and a budget document that communicates not only the district’s financial plan but also student learning objectives. To help assess and improve programs, services, and the budget process, recommendations for incorporating continuous improvement principles are embedded throughout the framework.
The framework is organized around five major steps or phases: 1) plan and prepare; 2) set instructional priorities; 3) pay for priorities; 4) implement plan; and 5) ensure sustainability. Included within each of the five major steps are more specific sub-steps, which provide details on how to implement the best practices, including supporting evidence and research on their effectiveness. Each of the 15 sub-steps include a highlight of recommendations, the key points, and also how the recommendations meet the criteria related to GFOA’s Award for Best Practices in School Budgeting.
Districts can find additional resources that complementing the best practices in school budgeting—including tools for implementing recommendations and case studies on districts use of the framework—www.smarterschoolspending.org.
Wednesday, February 1, 2017
Municipal bond volume in January jumped ahead of last year’s pace, as a spike in new money deals made up for a drop in refinancing transactions.
Total volume for the month rose 22.8% to $31.59 billion in 661 transactions from $25.73 billion in 831 transactions in January 2016, according to data from Thomson Reuters. The gain, which followed a record year for issuance in 2016, was due in part to some large transactions, said Natalie Cohen, managing director of municipal securities research at Wells Fargo Securities.
“New issue volume is starting off 2017 strong, with numerous large deals in the market,” she said. “We note that the number of transactions is down in January 2017 compared with January 2016, a reflection of these larger deal sizes. This is despite the significant drop in refunding activity following the second Federal Reserve rate hike in December 2016.”
Among the month’s biggest new money transactions were: Washington State’s sale of $473.42 million of various purpose general obligation bonds; the Metropolitan Government of Nashville and Davidson County’s $457.25 million of GO improvement bonds; and Los Angeles County Metropolitan Transportation Authority’s sale of $455.71 million of Proposition C Sales Tax Revenue Bonds Senior Bonds. Some other of the larger monthly transactions were combined refunding and new money deals, like Chicago’s $1.16 billion deal for example.
Refundings, which market participants expected slow primarily due to rising interest rates, slid to $7.44 billion in 223 deals from $10.10 billion in 362 deals in January 2016.
“I was not surprised to see year-over-year volume in January increase, but I do not place much stock in first-month volume,” said Alan Schankel, managing director at Janney Capital Markets. “We expect refunding volume to drop by about 10% in 2017, so the large falloff in January is ahead of our expectations,” he said. “The sharp rise in rates in the month following the election led to several refinancing deals being placed on day-to-day status. If rates were to fall in coming weeks, opening a refinancing window, I would expect strong refunding volume in February.”
New money issuance easily picked up the slack from the lack of refundings, increasing 37% to $14.43 billion in 371 deals to account for almost 50% of the months’ issuance. This is up from $10.53 billion of new money volume in 407 deals in January 2016.
Combined new-money and refunding issuance almost doubled to $9.72 billion from $5.09 billion. Issuance of revenue bonds gained 25.7% to $17.71 billion, while general obligation bond sales rose 19.3% to $13.88 billion.
Negotiated deals were up 38.9% to $24.73 billion and competitive sales increased by 2.9% to $6.83 billion.
Taxable bond volume more than doubled to $3.29 billion from $1.42 billion, while tax-exempt issuance increased by 13.5% to $27.49 billion. Minimum tax bonds increased to $816 million from $84 million.
“Taxables have been popular in the higher education and healthcare sectors for a while, but healthcare volume is likely to remain light given the volatility of changes to the Affordable Care Act,” said Cohen. “Higher education institutions sold a number of large deals in January, a reflection of relatively tight spreads between taxable and tax exempt, greater flexibility with the use of proceeds in the taxable markets. Also, long-dated high quality higher education issues have appeal to a broad buyer base.”
The volume of deals wrapped with bond insurance fell 16% to $1.29 billion in 104 deals from $1.53 billion in 120 deals. The industry expects to see improvement as interest rates continue to climb.
Six of the 10 sectors saw year-over-year increases, as transportation jumped up 161% to $4.83 billion from $1.85, development improved 80.1% to $1.33 billion, public facilities grew 45.9% to $608 million, general purpose increased 43.8% to $6.62 billion, education gained 24.5% to $12.65 billion and housing saw a 7.5% increase to $951 million.
The other four sectors declined at least 5.1% with the biggest drops posted by health care, which was at $1.88 billion compared with $3.66 billion, and utilities which slid to $1.71 billion from $2.29 billion.
As for the different types of entities that issue bonds, five of the seven were in the green. Colleges and Universities improved the most, with volume rising to $3.72 billion from $1.55 billion. Local authorities produced a 127.9% increase, to $5.61 billion.
On the other end of the spectrum, volume for the other six types of entities slid at least 13.8%, led by countries and parishes, with a declined 33.3% to $1.02 billion from $1.53 billion.
Just as it did after the first month of the year in 2016, Texas has the most issuance among states so far in 2017.
The Lone Star State has issued $6.07 billion, getting a decent sized lead ahead of the state which finished 2016 with the most issuance, California.
The Golden State is second with $3.58 billion, while New York State is third with $2.67 billion. Illinois captured the fourth spot with $2.16 billion and Pennsylvania is very close behind with $2.11 billion.
“I expect volume in 2017 to about equal last year’s pace,” Schankel said. “February volume should be strong, perhaps exceeding last year’s $31 billion total. The fly in the ointment is the uncertainty surrounding the administration’s plans for infrastructure investment and tax reform. Until more clarity is achieved, many issuers will be cautious about new issuance.”
Cohen agreed, saying that going into February, she thinks that volume will continue to be healthy when compared with 2016, given the slow start in 2016. Volume may slow down later in the year, she said. “given the expectation that refunding activity will make up a smaller proportion of total volume in 2017.”
The Bond Buyer
By Aaron Weitzman
January 31, 2017
State and local government tobacco-settlement bonds are bouncing back from the drubbing they took in November as investors pick up the debt on the cheap and cigarette consumption declines remain moderate.
The securities, which are repaid with payments from tobacco companies under a 1998 settlement, returned 7.7 percent over the past two months, four times more than investment-grade debt, according to Bloomberg Barclays indexes. That rebound pared a 9.2 percent loss in November, when fund managers sold the securities — which are among the most liquid high-yield munis — to meet redemptions during the bond-market rout that erupted after Donald Trump’s presidential victory.
“There was really no reason for tobacco to get hammered in November,” said Mikhail Foux, head of municipal strategy in New York at Barclays Plc. “People just sell what they can, not what they should.”
The settlement payments that back the tobacco bonds are based on cigarette shipments, which have declined at a slower pace as the low price of gasoline leaves consumers with more money to spend.
Altria Group Inc., which sells Marlboro brand cigarettes in the U.S., reported on Feb.1 its domestic shipment volume declined about 3.5 percent in 2016, in line with its competitors. From 2007 to 2014, shipments fell an average of 4.7 percent annually, according to data from the National Association of Attorneys General, which monitors the settlement.
Jeffrey Burger and Dan Barton, who co-manage the Dreyfus High Yield Municipal Bond fund, expect shipments to fall 3.5 percent in 2017. The $162 million fund, the best performing open-end high-yield muni fund this year, had about 13 percent of its assets invested in tobacco bonds as of Dec. 31, according to data compiled by Bloomberg.
One cloud on the horizon: California, which accounts for more than a tenth of the tobacco industry’s sales, on April 1 is raising cigarette taxes by $2 per pack, which may crimp sales 0.6 percent or 0.7 percent, Barton said. Dreyfus factors state cigarette-tax increases, including California’s, in its financial models, he said.
IHS Global, an econometric consultant, forecasts consumption to decline about 3.5 percent per year through 2020, according to an offering statement for a New York City tobacco bond issue last month.
“We would expect to see more state tax increases going forward as states look to balance their budgets,” Barton said. Six states raised cigarette taxes in 2016, while 10 increased their rates in 2015.
A federal excise tax increase, which would have a greater impact on consumption, isn’t imminent, given the Trump administration’s push to reduce taxes and cut regulation, Burger said. When the federal government raised cigarette taxes 62-cents-a pack in 2009, sales fell 9.2 percent.
“There’s no indication that a Trump administration would ever pass through any kind of federal excise tax increase,” Burger said.
Moreover, if Trump and the Republican-controlled Congress enact policies to expand manufacturing, lower income taxes and possibly raise the minimum wage, discretionary income and demand for cigarettes should increase, helping to offset the drop in sales anticipated from the California measure, Foux said.
Bloomberg Markets
by Martin Z Braun
February 3, 2017, 8:58 AM PST
John Loffredo and Robert DiMella, co-directors of municipal debt investments for MacKay Shields, have been reliable guides to what the coming year will bring in the state and local government bond market.
The two money managers, whose company oversees about $94.5 billion, have issued annual forecasts for the past two years that largely proved prescient, correctly anticipating that tobacco-settlement bonds would rally, transportation-related debt would outperform and any price drops would be exaggerated by a pullback in money from the market. During the last three years, shares in their MainStay Tax Free Bond Fund have delivered annual returns of about 4.9 percent, beating some 86 percent of their peers, according to data compiled by Bloomberg.
Here’s their major market predictions for 2017:
Liquidity Improves
The amount of money flowing in the market is likely to pick up, they say, amid a rollback of financial regulations and oversight. President Donald Trump this week said, “we’re going to be doing a big number on Dodd-Frank,” the law Congress enacted to prevent a repeat of the 2008 market meltdown. There are signs that liquidity is increasing, with trading volume rising last year and brokerage firms boosting their exposure to the market, according to regulatory data.
High-Tax, High Returns
Loffredo and DiMella predict that debt sold by governments in higher-tax states will outperform those from states where residents’ incomes aren’t taxed as much. Why? If federal levies are reduced, as Trump plans, those bonds will still be sought out because they’re exempt from state income-taxes, too. That would mark a shift from 2016: Debt from California, which has the highest marginal rates, returned 0.28 percent last year, about half as much as those from Texas, which has no income tax at all, according to S&P Global Ratings indexes.
Beating Treasuries
MacKay’s money managers say that municipals will outperform Treasuries as uncertainty about the size and scope of Republican tax-cut plans subsides. While lower rates on individuals would decrease the relative value of municipals, Trump has expressed support for keeping intact the federal tax breaks given to buyers of state and local debt, according to mayors who met with him before he took office. If municipals outperform, the yields — which move in the opposite direction as price — would decline relative to Treasuries.
Bloomberg Markets
by Jordyn Holman
February 1, 2017, 8:59 AM PST
Taylor Riggs, a contributor to Bloomberg Briefs, talks with Siobhan Wagner about this week’s municipal market news.
Bloomberg
February 2, 2017
Fitch Ratings-New York-30 January 2017: More travelers are flying, which is good news for U.S. airports, according to Fitch Ratings in its latest interactive peer study for standalone U.S. airport credits.
Large hubs and international gateways were primarily responsible for the steady upward trajectory year-over-year. Median enplanement value for Fitch-rated U.S airports rose over 4% to 4.16 million in 2015 (from 3.99 million in 2014).
“Several airports have sizeable capital programs with additional debt coming online, though median cost per enplanement is still relatively flat at approximately $9,” said Senior Director Seth Lehman. “Additionally, both net debt and available cash flow have improved, reflecting the strength of the airports’ use and lease agreements to recover costs. It also indicates that increased concession spending has helped build liquidity.”
The Fitch Analytical Comparative Tool (FACT) contains key financial information for Fitch-rated standalone airport issuers in the U.S.; a graphical plotting function for four-year annual and median performance; and a radar chart that indicates key risk levels. FACT also features a peer analysis tool, which allows users to review and compare summary credit profiles for selected individual issuers. The median charting tool allows users to generate a graphic representation of how specific metrics for individual airports compare to sector medians.
‘Fitch Analytical Comparative Tool – U.S. Airports’ is available at ‘www.fitchratings.com’. Fitch will also be rolling out an interactive map further detailing the financial profiles of its rated U.S. airports in the coming days.
Contact:
Seth Lehman
Senior Director
+1-212-908-0755
Fitch Ratings Inc.
33 Whitehall St.
New York, NY 10004
Jeffrey Lack
Director
+1-312-368-3171
Media Relations: Sandro Scenga, New York, Tel: +1 212-908-0278, Email: sandro.scenga@fitchratings.com.
Additional information is available at ‘www.fitchratings.com’.
ALL FITCH CREDIT RATINGS ARE SUBJECT TO CERTAIN LIMITATIONS AND DISCLAIMERS. PLEASE READ THESE LIMITATIONS AND DISCLAIMERS BY FOLLOWING THIS LINK: HTTPS://WWW.FITCHRATINGS.COM/UNDERSTANDINGCREDITRATINGS. IN ADDITION, RATING DEFINITIONS AND THE TERMS OF USE OF SUCH RATINGS ARE AVAILABLE ON THE AGENCY’S PUBLIC WEB SITE AT WWW.FITCHRATINGS.COM. PUBLISHED RATINGS, CRITERIA, AND METHODOLOGIES ARE AVAILABLE FROM THIS SITE AT ALL TIMES. FITCH’S CODE OF CONDUCT, CONFIDENTIALITY, CONFLICTS OF INTEREST, AFFILIATE FIREWALL, COMPLIANCE, AND OTHER RELEVANT POLICIES AND PROCEDURES ARE ALSO AVAILABLE FROM THE CODE OF CONDUCT SECTION OF THIS SITE. FITCH MAY HAVE PROVIDED ANOTHER PERMISSIBLE SERVICE TO THE RATED ENTITY OR ITS RELATED THIRD PARTIES. DETAILS OF THIS SERVICE FOR RATINGS FOR WHICH THE LEAD ANALYST IS BASED IN AN EU-REGISTERED ENTITY CAN BE FOUND ON THE ENTITY SUMMARY PAGE FOR THIS ISSUER ON THE FITCH WEBSITE.
Copyright © 2017 by Fitch Ratings, Inc., Fitch Ratings Ltd. and its subsidiaries. 33 Whitehall Street, NY, NY 10004. Telephone: 1-800-753-4824, (212) 908-0500. Fax: (212) 480-4435. Reproduction or retransmission in whole or in part is prohibited except by permission. All rights reserved. In issuing and maintaining its ratings and in making other reports (including forecast information), Fitch relies on factual information it receives from issuers and underwriters and from other sources Fitch believes to be credible. Fitch conducts a reasonable investigation of the factual information relied upon by it in accordance with its ratings methodology, and obtains reasonable verification of that information from independent sources, to the extent such sources are available for a given security or in a given jurisdiction. The manner of Fitch’s factual investigation and the scope of the third-party verification it obtains will vary depending on the nature of the rated security and its issuer, the requirements and practices in the jurisdiction in which the rated security is offered and sold and/or the issuer is located, the availability and nature of relevant public information, access to the management of the issuer and its advisers, the availability of pre-existing third-party verifications such as audit reports, agreed-upon procedures letters, appraisals, actuarial reports, engineering reports, legal opinions and other reports provided by third parties, the availability of independent and competent third- party verification sources with respect to the particular security or in the particular jurisdiction of the issuer, and a variety of other factors. Users of Fitch’s ratings and reports should understand that neither an enhanced factual investigation nor any third-party verification can ensure that all of the information Fitch relies on in connection with a rating or a report will be accurate and complete. Ultimately, the issuer and its advisers are responsible for the accuracy of the information they provide to Fitch and to the market in offering documents and other reports. In issuing its ratings and its reports, Fitch must rely on the work of experts, including independent auditors with respect to financial statements and attorneys with respect to legal and tax matters. Further, ratings and forecasts of financial and other information are inherently forward-looking and embody assumptions and predictions about future events that by their nature cannot be verified as facts. As a result, despite any verification of current facts, ratings and forecasts can be affected by future events or conditions that were not anticipated at the time a rating or forecast was issued or affirmed.
The information in this report is provided “as is” without any representation or warranty of any kind, and Fitch does not represent or warrant that the report or any of its contents will meet any of the requirements of a recipient of the report. A Fitch rating is an opinion as to the creditworthiness of a security. This opinion and reports made by Fitch are based on established criteria and methodologies that Fitch is continuously evaluating and updating. Therefore, ratings and reports are the collective work product of Fitch and no individual, or group of individuals, is solely responsible for a rating or a report. The rating does not address the risk of loss due to risks other than credit risk, unless such risk is specifically mentioned. Fitch is not engaged in the offer or sale of any security. All Fitch reports have shared authorship. Individuals identified in a Fitch report were involved in, but are not solely responsible for, the opinions stated therein. The individuals are named for contact purposes only. A report providing a Fitch rating is neither a prospectus nor a substitute for the information assembled, verified and presented to investors by the issuer and its agents in connection with the sale of the securities. Ratings may be changed or withdrawn at any time for any reason in the sole discretion of Fitch. Fitch does not provide investment advice of any sort. Ratings are not a recommendation to buy, sell, or hold any security. Ratings do not comment on the adequacy of market price, the suitability of any security for a particular investor, or the tax-exempt nature or taxability of payments made in respect to any security. Fitch receives fees from issuers, insurers, guarantors, other obligors, and underwriters for rating securities. Such fees generally vary from US$1,000 to US$750,000 (or the applicable currency equivalent) per issue. In certain cases, Fitch will rate all or a number of issues issued by a particular issuer, or insured or guaranteed by a particular insurer or guarantor, for a single annual fee. Such fees are expected to vary from US$10,000 to US$1,500,000 (or the applicable currency equivalent). The assignment, publication, or dissemination of a rating by Fitch shall not constitute a consent by Fitch to use its name as an expert in connection with any registration statement filed under the United States securities laws, the Financial Services and Markets Act of 2000 of the United Kingdom, or the securities laws of any particular jurisdiction. Due to the relative efficiency of electronic publishing and distribution, Fitch research may be available to electronic subscribers up to three days earlier than to print subscribers.
For Australia, New Zealand, Taiwan and South Korea only: Fitch Australia Pty Ltd holds an Australian financial services license (AFS license no. 337123) which authorizes it to provide credit ratings to wholesale clients only. Credit ratings information published by Fitch is not intended to be used by persons who are retail clients within the meaning of the Corporations Act 2001
ENDORSEMENT POLICY – Fitch’s approach to ratings endorsement so that ratings produced outside the EU may be used by regulated entities within the EU for regulatory purposes, pursuant to the terms of the EU Regulation with respect to credit rating agencies, can be found on the EU Regulatory Disclosures page. The endorsement status of all International ratings is provided within the entity summary page for each rated entity and in the transaction detail pages for all structured finance transactions on the Fitch website. These disclosures are updated on a daily basis.
Fitch Ratings-New York-30 January 2017: For the third time since 2008, 2016 upgrades outpaced downgrades for U.S. public finance, with upgrades at their highest level in over 10 years, according to a new Fitch Ratings report.
Eighty-one percent of 2016 rating actions were affirmations.
“The high level of upgrades and downgrades are largely the result of the new state and local rating criteria implemented in the spring of 2016,” said Jessalynn Moro, Managing Director of the U.S. Public Finance Group. “Credits have clearly benefited from the revised criteria’s more focused concentration on the economy.”
Upgrades totaled 332, a significant increase from 148 in 2015. Upgrades represented 9.6 percent of all rating actions and the par value totaled $211 billion.
Downgrades totaled 153 in 2016 versus 65 in 2015. Downgrades represented 4.4 percent of all rating actions and the par value totaled $141.1 billion.
At year-end, both Negative Rating Outlooks and Watches slightly increased by four to 118 and 20, respectively. Positive Rating Watches remained unchanged, while the number of Positive Rating Outlooks decreased to 91 from 124.
Five states were downgraded, reflecting budget and economic challenges. Three states were upgraded due to fundamental improvement.
The largest downgrade by par amount in the fourth quarter was Trinity Health Credit Group at approximately $5 billion. The downgrade reflects the system’s thinner operating margins in fiscal 2016.
For more information, a special report titled “U.S. Public Finance Annual Rating Actions 2016” is available on the Fitch Ratings web site at www.fitchratings.com.
Contact:
Jessalynn Moro
Managing Director
+1-212-908-0608
Fitch Ratings, Inc.
33 Whitehall St.
New York, NY 10004
Arthur Tildesley
Associate Analyst
+1-646-582-4749
Media Relations: Elizabeth Fogerty, New York, Tel: +1 (212) 908 0526, Email: elizabeth.fogerty@fitchratings.com.
Additional information is available at ‘www.fitchratings.com’
ALL FITCH CREDIT RATINGS ARE SUBJECT TO CERTAIN LIMITATIONS AND DISCLAIMERS. PLEASE READ THESE LIMITATIONS AND DISCLAIMERS BY FOLLOWING THIS LINK: HTTPS://WWW.FITCHRATINGS.COM/UNDERSTANDINGCREDITRATINGS. IN ADDITION, RATING DEFINITIONS AND THE TERMS OF USE OF SUCH RATINGS ARE AVAILABLE ON THE AGENCY’S PUBLIC WEB SITE AT WWW.FITCHRATINGS.COM. PUBLISHED RATINGS, CRITERIA, AND METHODOLOGIES ARE AVAILABLE FROM THIS SITE AT ALL TIMES. FITCH’S CODE OF CONDUCT, CONFIDENTIALITY, CONFLICTS OF INTEREST, AFFILIATE FIREWALL, COMPLIANCE, AND OTHER RELEVANT POLICIES AND PROCEDURES ARE ALSO AVAILABLE FROM THE CODE OF CONDUCT SECTION OF THIS SITE. FITCH MAY HAVE PROVIDED ANOTHER PERMISSIBLE SERVICE TO THE RATED ENTITY OR ITS RELATED THIRD PARTIES. DETAILS OF THIS SERVICE FOR RATINGS FOR WHICH THE LEAD ANALYST IS BASED IN AN EU-REGISTERED ENTITY CAN BE FOUND ON THE ENTITY SUMMARY PAGE FOR THIS ISSUER ON THE FITCH WEBSITE.
Copyright © 2017 by Fitch Ratings, Inc., Fitch Ratings Ltd. and its subsidiaries. 33 Whitehall Street, NY, NY 10004. Telephone: 1-800-753-4824, (212) 908-0500. Fax: (212) 480-4435. Reproduction or retransmission in whole or in part is prohibited except by permission. All rights reserved. In issuing and maintaining its ratings and in making other reports (including forecast information), Fitch relies on factual information it receives from issuers and underwriters and from other sources Fitch believes to be credible. Fitch conducts a reasonable investigation of the factual information relied upon by it in accordance with its ratings methodology, and obtains reasonable verification of that information from independent sources, to the extent such sources are available for a given security or in a given jurisdiction. The manner of Fitch’s factual investigation and the scope of the third-party verification it obtains will vary depending on the nature of the rated security and its issuer, the requirements and practices in the jurisdiction in which the rated security is offered and sold and/or the issuer is located, the availability and nature of relevant public information, access to the management of the issuer and its advisers, the availability of pre-existing third-party verifications such as audit reports, agreed-upon procedures letters, appraisals, actuarial reports, engineering reports, legal opinions and other reports provided by third parties, the availability of independent and competent third- party verification sources with respect to the particular security or in the particular jurisdiction of the issuer, and a variety of other factors. Users of Fitch’s ratings and reports should understand that neither an enhanced factual investigation nor any third-party verification can ensure that all of the information Fitch relies on in connection with a rating or a report will be accurate and complete. Ultimately, the issuer and its advisers are responsible for the accuracy of the information they provide to Fitch and to the market in offering documents and other reports. In issuing its ratings and its reports, Fitch must rely on the work of experts, including independent auditors with respect to financial statements and attorneys with respect to legal and tax matters. Further, ratings and forecasts of financial and other information are inherently forward-looking and embody assumptions and predictions about future events that by their nature cannot be verified as facts. As a result, despite any verification of current facts, ratings and forecasts can be affected by future events or conditions that were not anticipated at the time a rating or forecast was issued or affirmed.
The information in this report is provided “as is” without any representation or warranty of any kind, and Fitch does not represent or warrant that the report or any of its contents will meet any of the requirements of a recipient of the report. A Fitch rating is an opinion as to the creditworthiness of a security. This opinion and reports made by Fitch are based on established criteria and methodologies that Fitch is continuously evaluating and updating. Therefore, ratings and reports are the collective work product of Fitch and no individual, or group of individuals, is solely responsible for a rating or a report. The rating does not address the risk of loss due to risks other than credit risk, unless such risk is specifically mentioned. Fitch is not engaged in the offer or sale of any security. All Fitch reports have shared authorship. Individuals identified in a Fitch report were involved in, but are not solely responsible for, the opinions stated therein. The individuals are named for contact purposes only. A report providing a Fitch rating is neither a prospectus nor a substitute for the information assembled, verified and presented to investors by the issuer and its agents in connection with the sale of the securities. Ratings may be changed or withdrawn at any time for any reason in the sole discretion of Fitch. Fitch does not provide investment advice of any sort. Ratings are not a recommendation to buy, sell, or hold any security. Ratings do not comment on the adequacy of market price, the suitability of any security for a particular investor, or the tax-exempt nature or taxability of payments made in respect to any security. Fitch receives fees from issuers, insurers, guarantors, other obligors, and underwriters for rating securities. Such fees generally vary from US$1,000 to US$750,000 (or the applicable currency equivalent) per issue. In certain cases, Fitch will rate all or a number of issues issued by a particular issuer, or insured or guaranteed by a particular insurer or guarantor, for a single annual fee. Such fees are expected to vary from US$10,000 to US$1,500,000 (or the applicable currency equivalent). The assignment, publication, or dissemination of a rating by Fitch shall not constitute a consent by Fitch to use its name as an expert in connection with any registration statement filed under the United States securities laws, the Financial Services and Markets Act of 2000 of the United Kingdom, or the securities laws of any particular jurisdiction. Due to the relative efficiency of electronic publishing and distribution, Fitch research may be available to electronic subscribers up to three days earlier than to print subscribers.
For Australia, New Zealand, Taiwan and South Korea only: Fitch Australia Pty Ltd holds an Australian financial services license (AFS license no. 337123) which authorizes it to provide credit ratings to wholesale clients only. Credit ratings information published by Fitch is not intended to be used by persons who are retail clients within the meaning of the Corporations Act 2001
ENDORSEMENT POLICY – Fitch’s approach to ratings endorsement so that ratings produced outside the EU may be used by regulated entities within the EU for regulatory purposes, pursuant to the terms of the EU Regulation with respect to credit rating agencies, can be found on the EU Regulatory Disclosures page. The endorsement status of all International ratings is provided within the entity summary page for each rated entity and in the transaction detail pages for all structured finance transactions on the Fitch website. These disclosures are updated on a daily basis.
The president’s recent executive order that would make so-called “sanctuary jurisdictions” ineligible for federal funding in certain circumstances is unlikely to result in changes to credit ratings, at least in the near term.
Feb. 1, 2017
On January 25, 2017, President Trump issued the executive order, Enhancing Public Safety in the Interior of the United States. An executive order is an official statement from the president that directs federal agencies as to how they are to expend their resources within the laws that are established by Congress and the Constitution. Technically, while an executive order is considered binding, it is subject to legal review and cannot be used to create new law or appropriate new funding from the U.S. Treasury. And while the use of executive orders is common, this particular executive order has drawn concern from finance officers in various jurisdictions because of a potential loss of federal grant funding for failure to comply with the order. Legal arguments against the executive order have been identified and are in development. As a member of the State and Local Legal Center, GFOA will continue to monitor the implementation of this executive order and will update GFOA members as developments occur.
Almost immediately after its publication, the executive order raised questions and caused confusion as jurisdictions debated on how broadly to interpret its language. Aside from the political debate the order generates on federal immigration policy, most of the remaining concern is because the order threatens to withhold federal funding from so-called “sanctuary cities.” Although there is no specific legal definition for a sanctuary city, in general, the term refers to cities, counties, and states that chose not to cooperate with federal efforts to deport undocumented immigrants.
The issues primarily revolve around the extent and scope of the executive order, particularly as it relates to the restriction of federal funding. Sec. 2(c) broadly states that jurisdictions that fail to comply with federal law will not receive federal funds, and Sec. 9(a) seems to narrow the focus of the order to denying federal grant funding to the sanctuary jurisdictions. Even if the restriction just applies to federal grant funding, the language still raises the question of whether the order is imposing new conditions on grants that have already been appropriated or on future grants. In either scenario, some legal scholars are noting this could raise constitutional issues because “new” conditions on federal grant funding fall under the authority of Congress and not the president.
There will likely be a number of legal challenges in the coming weeks and months, as some local government leaders have already declared their intention to fight the order. Some of the current discussion on challenging the executive order has identified previous U.S. Supreme Court decisions as possible defenses. For example, in South Dakota v. Dole (1987), the Supreme Court upheld prior case law that restrictions on federal grants would not be valid “if they are unrelated to the federal interest in particular national projects or programs” and must also be to promote “general welfare.” And two decisions that will likely receive significant attention are Nat’l Fed’n of Indep. Bus. v. Sebelius (2012) and Printz v. US (1997). In both cases, the Supreme Court focused on the federal government compelling states to take certain action or administer a federal regulatory program, and the court ruled against the federal government because the actions violated the Tenth Amendment and undermined the principles of federalism.
Wednesday, February 1, 2017
But not from the new president’s promise to repeal Obamacare.
Donald Trump had city dwellers up in arms last week, when he signed an executive order to cut off federal funding to “sanctuary cities,” a loosely defined group of municipalities that don’t enforce federal immigration law.
Big cities such as Chicago, Los Angeles, and New York, whose mayors have pledged to maintain their sanctuary status in the face of the president’s threats, get millions of dollars a year from the federal government, which helps pay for everything from education to law enforcement to public transportation. Small cities get less but can be just as reliant on federal funding to provide such services.
The order to defund sanctuary cities didn’t come as a surprise. Trump often targeted them during his campaign for president, arguing that local governments were putting citizens at risk by failing to share information with federal immigration authorities. The cities typically responded that the threat was exaggerated and that their police departments depend on working relationships with immigrant communities marked by trust.
Worries about the executive order are probably misplaced, a note published on Monday by Fitch Ratings said. A lot of the federal money that cities depend on flows through states, counties, and school districts, according to the credit rater, making it harder to cut off. Cities, meanwhile, can be expected to mount constitutional challenges to any attempt to cut funding.
The White House hasn’t yet responded to a request for comment.
Fitch didn’t expound on potential legal challenges, but there are decades’ worth of case law limiting the federal government’s ability to make funding contingent on local policy. Congress can make highway dollars dependent on traffic safety laws, for example, but tying school funding to health-care policy would be less likely to pass muster.
In any case, President Trump’s executive order is unlikely to affect the bond ratings of sanctuary cities, Fitch said, meaning that a city’s immigration policy is unlikely to threaten its ability to borrow.
The new president presents other problems for municipal budget makers, Fitch said. Repealing the Affordable Care Act could heap additional costs on local health care facilities, while changing the way that Medicare funding is dispersed could ultimately reduce the amount of money that local governments receive.
Bloomberg
by Patrick Clark
January 30, 2017, 1:11 PM PST
SAN FRANCISCO — President Donald Trump’s executive order last week to cut federal funding to self-proclaimed sanctuary cities would likely not result in an impact to cities’ bond ratings, Fitch Ratings reported on Monday.
Instead, a push to convert Medicaid to a block grant would likely result in a more significant effect on state and local government finances, Fitch noted.
Federal funding represents only a small portion of local revenues and most of the funding is restricted to specific programs, such as Temporary Assistance for Needy Families (TANF) and school lunch subsidies, Fitch reported. In general, federal funding does not support cities’ general operations.
Sanctuary status is not an official designation. Still, cities across the country have vowed some sort of protection to undocumented residents, including New York, Los Angeles, San Francisco, Boston and Chicago.
Much of the federal funding spent at the municipal level flows to states, counties and school districts, rather than cities.
A Reuters analysis of the nation’s ten largest cities that shield illegal immigrants found that the presidential order could strip municipalities of $2.27 billion annually.
“Direct funding is limited,” reported Fitch. “Moreover, civil and constitutional challenges appear likely to impede the implementation of the executive order.”
Last week’s executive order exempted federal dollars used for law enforcement, sparking opponents to say that a judge could strike down that section of the order as unconstitutional.
Fitch noted that President Trump’s push to repeal the Affordable Care Act, also known as Obamacare, without a replacement could have a more meaningful impact on state and local government finances.
The Kaiser Family Foundation estimates a repeal of Obamacare and a cap on federal Medicaid spending, such as through a block grant or a per capita cap, could cut Medicaid funding by 41 percent over the next decade. That would likely handicap states’ ability to respond to larger enrollments during recessions.
By REUTERS
JAN. 30, 2017, 4:09 P.M. E.S.T.
(Reporting by Robin Respaut; Editing by Andrew Hay)
A reliance on oil production remains a key indicator of credit stress in the U.S. state sector as of early 2017. Energy producing states account for five of the 11 states on which S&P Global Ratings maintains negative rating outlooks.
Jan. 24, 2017
S&P Global Ratings expects ratings in the municipal housing sector to remain stable in 2017, with just a small number of downgrades within the tax-exempt bond ratings universe. Following the downgrades that began in 2008, the sector turned this trend around and has had ongoing stability in the new decade.
Jan. 24, 2017
DALLAS - President Donald Trump’s executive order to streamline the environmental permitting process for high-priority infrastructure projects will allow roads and bridges to be built more quickly, according to Rep. Bill Shuster, R-Pa., chairman of the House Transportation and Infrastructure Committee.
Trump signed an executive order this week that requires the chairman of the White House Council on Environmental Quality to coordinate “expedited procedures and deadlines for completion of environmental reviews and approvals” for infrastructure projects designated as a high priority by a governor or the head of a federal department or agency.
“Too often, infrastructure projects in the United States have been routinely and excessively delayed by agency processes and procedures,” the order said. “These delays have increased project costs and blocked the American people from the full benefits of increased infrastructure investments.”
Shorter delays with a more rapid environmental permit review would result in road and bridge projects being operational years earlier than now and at a lower cost, Shuster said during an interview Wednesday on Fox Business News.
“This is what we need to do with these reforms in Congress,” Shuster said. “We need to make sure these projects move faster because time is money.”
Once the request for high-priority status is received, the council’s staff has 30 days to decide whether the project qualifies for an expedited approval process. If the deadline is missed, the head of the agency must provide a written explanation for the delay to the council chair.
A certified project would go to the top of the priority list of the federal agencies required by law to review and approve it.
Trump said the executive order will help streamline a “cumbersome, long, horrible permitting process” that has held up some infrastructure projects for years.
“We can’t be in an environmental process for 15 years if a bridge is going to be falling down or a highway is crumbling,” he said during the signing ceremony in the Oval Office.
“If it’s a no, we’ll give them a quick no, and if it’s a yes, it’s like ‘Let’s start building,'” Trump said. “The regulatory process in this country has become a tangledup mess, and very unfair to people.”
The order shows that Trump sees infrastructure as an important function of government and that the review process is often too cumbersome, said Nick Goldstein, vice president of regulatory affairs at the American Road and Transportation Builders Association.
“It’s certainly a good thing, although we don’t know yet who is going to head the environmental council,” Goldstein said. “One of our priorities always has been a more rational environmental review process.”
Trump’s executive order is an endorsement of the regulatory reforms that construction contractors have been seeking for years, said Brian Turmail, senior executive director of public affairs at the Associated General Contractors of America.
“Despite significant reforms we have helped get enacted in recent surface transportation measures that have cut some time from the federal review process, it still takes too long to get a final decision out of the federal government,” Turmail said.
“These delays needlessly inflate the cost of many infrastructure projects and undermine public confidence in the federal government’s ability to get the job done,” he said.
It’s too early to tell how the order will affect project delivery, said Lloyd Brown, director of communications at the American Association of State Highway and Transportation Officials.
“We’re going to work with federal and state officials to make sure we understand the process and get projects delivered as quickly as possible,” Brown said. “AASHTO supports regulatory streamlining but we also take very seriously our environmental responsibilities.”
The Bond Buyer
By Jim Watts
January 26, 2017
DALLAS – More than 300 road, rail, bridge, and port projects have been submitted to the Trump administration by 43 states as prime candidates for funding in the new president’s proposed $1 trillion infrastructure program.
The large list was compiled by the National Governors Association, which asked governors in December to provide information to the Trump team on projects suitable for inclusion in the plan that relies on private investments to help rebuild the nation’s infrastructure.
“They seek examples of priority infrastructure projects that might be incorporated into a future infrastructure investment program,” the NGA said in the letter dated Dec. 16, more than a month before Trump was sworn in. “Specifically, the transition team is looking for three to five project suggestions from each state that they would vet for inclusion in a new program.”
The submissions to the initial information-gathering request are non-binding, the letter noted.
“The initial spend on these projects for 2017 is expected to be $150 billion, and the transition team hopes that this type of project will be continued over the next two years,” NGA said.
The compilation of project information is still going on, said Elena Waskey, a spokeswoman for the NGA.
A preliminary list of 50 high-priority “Emergency & National Security Projects” across the nation includes a high-speed rail line between Dallas and Houston, Maryland’s Purple Line light rail system, airport upgrades, and interstate highway expansions.
Total cost of the 50 projects on the list is $137.5 billion, with 50% of the funding coming from private investors, according to documents obtained by McClatchy’s Kansas City Star and The News Tribune.
The origin of the project list is unclear. The 50-project list is almost identical to a spreadsheet circulated in December by the NGA among state officials, with only two projects not found in both.
The McClatchy report said the list was provided to the NGA by the Trump transition team. However, Brigham McCown, chairman of the Alliance for Innovation and Infrastructure and a former member of the Trump transition, has denied that the team developed the project list.
Several of the projects have been completed and others don’t meet Trump’s criteria for significant private investments, McCown said.
The 50-project list is “not an official White House document,” Trump spokeswoman Lindsay Walters said Wednesday.
The first project on the list is the $12 billion Gateway Program to rebuild the rail infrastructure between New York City and Trenton, N.J.
Other projects on the priority list include a $2 billion expansion of Seattle-Tacoma International Airport and a $1 billion redevelopment of Chicago’s Union Station.
Texas Central Rail said it is pleased that its 240-mile bullet train system between Houston and Dallas was included in the high-priority list.
“Texans are looking for safe, reliable, and productive transportation options,” the company said. “The high-speed train answers that call for the region, state and country.”
Trump should reject the Texas Central project, said Kyle Workman of Texans Against High-Speed Rail.
“We are confident that President Trump will identify projects of worth and benefit to America and this will not be one of them,” he said.
The list also includes a 68-mile light rail line proposed by Dallas Area Rapid Transit from the far northern suburbs of Dallas to the west side of Fort Worth, with a stop at Dallas-Fort Worth International Airport.
DART has no plans to seek private investment in the $2.8 billion project, said spokesman Morgan Lyons.
“We are always supportive of ways to inject additional federal dollars into long-term transportation infrastructure, but have not been contacted to help develop this list,” Lyons said.
The Bond Buyer
By Jim Watts
January 25, 2017
DALLAS — Senate Democrats have countered President Trump with their own 10-year, $1 trillion infrastructure package that calls for more direct federal funding rather than incentives for private investments.
The proposal outlined Tuesday by Senate minority leader Chuck Schumer, D-N.Y., would provide $210 billion for roads and bridges, $180 billion for rail and bus systems, $110 billion for water projects, $75 billion for schools, $65 billion for ports and airports, $20 billion for projects in national parks and tribal lands, $20 billion for expanding wireless broadband service, and $10 billion for Veterans Affairs hospitals.
It would expand the Transportation Investment Generating Economic Recovery (TIGER) grant program by $10 billion and provide major increases in clean water and drinking water state revolving funds.
The proposal also includes a $200 billion Vital Infrastructure Projects (VIP) program that will direct major federal investments to the most critical national projects.
“It’s a challenge to the president,” Schumer said in an online interview with USA Today. “We’re challenging the president — he talked about in his campaign — to join with us. If he does, we’ll work with him on this.”
Trump’s 10-year plan unveiled by his campaign in late October relies on $137 billion of federal tax incentives to leverage private investments in revenue-producing projects.
Public-private partnerships are the wrong approach in most cases, Schumer said.
“Some people have talked about doing this as a tax break for wealthy people. We don’t believe that works,” he said.
“We would pay for it out of the Treasury,” Schumer said. “It’s a stimulus program. We need more and better-paying jobs.”
The Democrats’ proposal would create 15 million jobs, he said.
Democrats will discuss and negotiate with President Trump about how to pay for the infrastructure plan, Schumer said.
“There will be no cuts to education or healthcare programs,” Schumer said. “Are the tax cuts for the rich going to be paid for?” he asked, adding, “I doubt it.”
Trump’s infrastructure program will likely be funded through an overhaul of the federal tax code that Democrats could support, according to Rep. Bill Shuster, R-Pa., chairman of the House Transportation and Infrastructure Committee.
“The bitter pill for Democrats is tax reform,” Shuster said at a Tuesday event sponsored by the Republican Main Street Coalition. “But the sweet chaser is infrastructure dollars. So I think they’re willing to go along if they’re finding those dollars.”
Trump would need Democratic support to pass an infrastructure program, Schuster said.
“We Democrats have always been behind this but we’ve been stymied by Republicans in the Senate over and over again,” Schumer said. President Trump “is going to have to work with us. To get this done, Trump may have to break with those doctrinaire people who are out of touch with what Republicans and Democrats in America have always supported: The federal government should assist in building roads and bridges and tunnels.”
Sponsors of the infrastructure legislation include Schumer and Sens. Thomas Carper from Delaware, Bill Nelson from Florida, Ron Wyden from Oregon, Sherrod Brown from Ohio, Bernie Sanders and Patrick Leahy from Vermont, and Maria Cantwell from Washington.
“Senate Democrats have unveiled this blueprint because we need a wide-sweeping infrastructure plan, and we need it now,” Schumer said.
Trump’s infrastructure plan may face resistance from congressional Republicans who are concerned about how to pay for it, said Richard LeFrak, a New York developer appointed by the president to a panel that will oversee it.
Trump “has to come up with a financing plan, and I think there’s going to be a little bit of a tug of war between the conservatives in the Republican party who are concerned about deficits and the president who’s concerned about jobs,” he said Monday on CNBC. “I think [Trump] he will prevail, ultimately, because he wants to put people to work.”
Trump supports a $1 trillion plan but the final price tag may be lower, LeFrak said. “He’d like it to start with a “t,” but I think the number I’ve heard tossed around is about $550 billion,” LeFrak said.
The Bond Buyer
By Jim Watts
January 24, 2017
The City of Cambridge is pleased to announce that it intends to offer Cambridge residents the chance to invest directly in Cambridge infrastructure by purchasing minibonds. Minibonds enable residents to earn tax-exempt interest and invest for the future while supporting the Cambridge capital budget.
A minibond is similar to a traditional municipal bond in which investors loan money to a city or public agency for an agreed period of time, receive interest on the investment, and get their loan paid back when the bond matures. The City will use minibond proceeds to support capital projects such as school building renovations, municipal facility upgrades, and implementation of the Complete Streets plan.
All municipal bonds previously sold by the City were sold in denominations of $5,000 or more. Minibonds are different because residents can purchase them for as little as $1,000, making them more accessible than traditional municipal bonds for potential investors.
The City is working with Neighborly Securities* to issue the minibonds. Neighborly is not affiliated with the City of Cambridge in any way, other than as the broker-dealer for this sale of minibonds.
The City expects to sell up to $2 million of minibonds in its first minibond sale, which will take place from February 17-23, 2017. Each Cambridge resident may purchase up to 20 minibonds for a total possible investment of $20,000 (20 x $1,000/minibond). The interest rate on the 2017 minibonds will be determined on February 17, 2017 and interest will be paid semiannually. Principal on the 2017 minibonds will be paid in five years in 2022.
Minibonds will only be offered to investors following release of a Preliminary Official Statement of the City that will describe the terms of the minibonds and provide other financial information concerning the City. The City expects to issue a Preliminary Official Statement by February 13, 2017.
Residents who are interested in buying Cambridge minibonds will need to create an account through Neighborly.com before the order period ends or purchase minibonds through their own broker. Once a minibond order is submitted through Neighborly, Neighborly’s investment team reviews it for approval and allocation. If the order is approved, minibonds will then be allotted and filled on a first-come, first-serve basis. Neighborly representatives will be at Cambridge City Hall on Wednesday, February 15 from 6-8pm and Tuesday, February 21 from 6-8pm to provide assistance and discuss the minibond process.
For questions about setting up an account with Neighborly to purchase minibonds, please contact Neighborly at (866) 432-1170, support@neighborly.com, or www.neighborly.com/cambridge.
For general questions about Cambridge minibonds, please visit minibonds.cambridgema.gov or contact the City’s Budget Office at minibonds@cambridgema.gov or (617) 349-4270.
Sign up today.
*Minibonds will only be ordered through Neighborly Securities, member FINRA, SIPC & registered with MSRB, pursuant to a preliminary and final official statement to be made available during the ordering period. This information does not constitute an order to sell or the solicitation of an order to buy any securities. You will be responsible for making your own independent investigation and appraisal of the risks, benefits, and suitability of any securities to be ordered and neither the City of Cambridge nor Neighborly Securities is making any recommendation or giving any investment advice.
1/23/2017
PRINCETON, N.J., Jan. 26, 2017 /PRNewswire/ — MacKay Municipal Managers™, the municipal bond team of fixed income investment management firm MacKay Shields LLC, today delivered its top five municipal market insights for 2017. Key highlights include:
The MacKay Municipal Managers™ team is led by John Loffredo and Bob DiMella, co-heads and executive managing directors. For over 20 years, the pair has worked together on portfolio strategy and municipal credit. In those two decades, the team has grown to include portfolio managers Scott Sprauer, David Dowden, Michael Petty and Frances Lewis.
“Uncertainty is abound in 2017. The new administration will usher in the possibility of new federal legislation that, if implemented, could impact the municipal market. Hesitation regarding these changes and the resulting impact on state and local governments could delay the budget processes, capital projects, and debt issuance of many municipalities. However, state and local governments with strong budget controls, long-term capital planning processes, and accumulated reserves will remain strong during this time, and we believe that value will rise to the top in this uncertain market,” explained John Loffredo and Robert DiMella, co-heads of the MacKay Municipal Managers Team™.
To view the full year outlook, please visit: https://mainstayinvestmentsblog.com/2017/01/top-five-municipal-market-insights-for-2017/
About MacKay Shields LLC and MacKay Municipal Managers™ Team
MacKay Shields is a fixed-income focused investment management firm with $94.5 billion in assets under management as of December 31, 2016. MacKay Shields manages fixed income strategies for high-net worth individuals, institutional clients, mutual funds and other commingled vehicles. Its investment strategies include unconstrained bond, global high yield, high yield, high yield active core, municipal high yield, short duration high yield, low volatility high yield, municipal short term, core investment grade, municipal investment grade, core plus, core plus opportunities, convertibles, emerging markets credit, and bank loans. MacKay Municipal Managers™ is the investment team within MacKay Shields focused on municipal bond solutions and offers a number of specialized offerings designed to meet the unique needs of investors. The team currently manages approximately $20 billion in municipal bond mandates.
MacKay Shields LLC and MacKay Shields UK LLP (collectively, “MacKay Shields”) are indirect wholly-owned subsidiaries of New York Life Insurance Company. MacKay Shields LLC is a registered investment adviser and is regulated in the United States by the U.S. Securities & Exchange Commission. MacKay Shields UK LLP is authorized and regulated in the United Kingdom by the U.K. Financial Conduct Authority. For more information please visit MacKay’s website at www.mackayshields.com.
For additional information, please contact:
Allison Scott
New York Life Insurance Company
(212) 576-4517
allison_scott@newyorklife.com
Kevin Maher
New York Life Insurance Company
(212) 576-6955
kevin_b_maher@newyorklife.com
This material contains the opinions of the MacKay Municipal Managers™ team of MacKay Shields LLC, but not necessarily those of MacKay Shields LLC. The opinions expressed herein are subject to change without notice. This material is distributed for informational purposes only, and is not intended to constitute the giving of advice or the making of a recommendation. The investments or strategies presented are not appropriate for every investor and do not take into account the investment objectives or financial needs of particular investors. An investor should review with its financial advisors the terms and conditions and risks involved with specific products or services and consider this information in the context of its personal risk tolerance and investment goals. Forecasts, estimates, and certain information contained herein are based upon proprietary research and should not be considered as investment advice or a recommendation of any particular security, strategy, or investment product. Any forward looking statements speak only as of the date they are made, and MacKay Shields LLC assumes no duty and does not undertake to update forward looking statements. Information contained herein has been obtained from sources believed to be reliable, but not guaranteed. Historical evidence does not guarantee future results. No part of this material may be reproduced in any form, or referred to in any other publication, without express written permission of MacKay Shields LLC.
WASHINGTON – Republican lawmakers’ aggressive 200-day agenda to overhaul the tax code by August and to repeal the Affordable Care Act, with some replacement by March or April, is certain to worry and mobilize muni market and state and local groups.
House Speaker Paul Ryan, R-Wis., and Senate Majority Leader Mitch McConnell, R-Ky., who laid out the agenda at the GOP retreat in Philadelphia and a follow-up news conference this week, acknowledge the schedule is ambitious. The Senate is currently tied up with confirmations of Trump’s nominees for Cabinet positions. The chamber also needs at least 60 votes to limit debate and push through any legislation and has only 52 Republicans. The exception is a reconciliation bill that can be passed with only 50 votes and is therefore being considered as a vehicle for repeal of the ACA.
Ryan said the sweeping tax reform bill will lower individual and corporate rates, broaden the tax base and be revenue neutral, noting that will upset lobbyists.
“I think it’s a cause of great alarm,” said Emily Brock, director of the federal liaison center for the Government Officers Finance Association, referring to the timeline. “We are storming the Hill as we speak.”
“This thing is moving,” said Jessica Giroux, general counsel and managing director of Bond Dealers of America.
Muni market groups, which have been vigorously lobbying members of Congress about the importance of tax-exempt bonds, worry that a tax reform bill will eliminate or restrict tax exemption for certain kinds or all munis.
The Republican blueprint for tax reform proposed eliminating “special-interest” deductions and credits. The comprehensive tax reform plan proposed in 2014 by former House Ways and Means chair Dave Camp, who has some former staff still on the committee, would have imposed a 10% surtax on muni bond interest for high-income households retroactively and eliminated advance refundings, bank-qualified bonds, and private activity bonds, including 501(c)(3) bonds for hospitals, universities and other nonprofits.
Reps. Randy Hultgren, R-Ill., and C. A. Dutch Ruppersberger, D-Md., co-chair of the Municipal Finance Caucus, are circulating a draft letter for signatures that will be sent to leaders of the House Ways and Means Committee to stress the “vital role of tax-exempt bonds” as tax reform legislation is drafted. The letter points out that nearly two thirds of core infrastructure investments in the U.S. are financed with municipal bonds, including $400 billion of munis in 2015 alone.
Meanwhile, state and local groups are up in arms about the executive orders recently issued by President Trump to block federal grants from cities serving as sanctuaries for undocumented immigrants and repeal the Affordable Care Act – both of which could seriously hurt their finances.
Trump’s Jan. 25 executive order: “Enhancing Public Safety in the Interior of the United States,” directed the Secretary of the Department of Homeland Security to designate jurisdictions as sanctuary cities. The Attorney General would deny them federal grants, except for law enforcement purposes.
Tom Cochran, executive director of the U.S. Conference of Mayors (USCM), along with the Major Cities Chiefs Association president Thomas Manger of Montgomery County, Md., said in a release: “Cities that aim to build trusting and supportive relations with immigrant communities should not be punished because this is essential to reducing crime and helping victims, both stated goals of the new administration.”
Mayors in many of the nation’s cities, including New York, Chicago, Los Angeles, Denver, Syracuse, and Austin opposed the executive order, with some of them, such as New York’s Bill de Blasio and Denver’s Michael Hancock stating or suggesting they will sue to block implementation of it.
The nation’s 10 largest cities could lose an estimated $2.27 billion of federal grants, according to Reuters. But Trump’s order does not include definitions of sanctuary cities or federal grants, as many mayors, the USCM, and some muni market participants pointed out.
Would the order affect federal subsidy payments for direct-pay bonds such as Build America Bonds or federal allocations of private activity bonds to states? Probably not, said sources, adding that there are many unknowns, according to the mayors and some market participants.
“I would say that a BAB payment is not a federal grant, it is a tax credit. But what will the Trump administration say?” asked Bill Daly, director of governmental affairs for the National Association of Bond Dealers. Daly pointed out that Trump cannot override legislation that provides federal grants. Congress would have to change the legislation.
“There’s going to be a lot of litigation over this,” said Daly. “It’s going to be very unclear for a while what this means.”
The USMC and MCCA suggested the executive order is illegal. “The U.S. Supreme Court has held that denying federal funds to cities to coerce compliance with federal policies may be unconstitutional,” they said.
Trump’s executive order on repeal of the ACA: “Minimizing the Economic Burden of the Patient Protection and Affordable Care Act Pending Repeal,” was issued on Jan. 20. It orders the Secretary of Health and Human Services and other federal agencies, “to the maximum extent permitted by law” to “waive, defer, grant exemptions from, or delay implementation of” any provision or requirements of the Act that “would impose a fiscal burden on a state of a cost fee, tax, penalty, or regulatory burden” on families, individuals, and health care providers, insurers, and others.
The USCM sent a letter to Congress urging members “to build upon, not tear down the progress that has been made to our healthcare system and to ensure that none of the 20 million newly covered individuals is left without health care coverage.” The group said the costs and effects of repealing the ACA “will be felt most heavily at the local level” because “it is the cities and counties that will see increases in indigent care costs for our hospitals, in uninsured rates and uncompensated care costs.” The mayor said they also strongly oppose efforts to convert Medicaid to block grants.
The Bond Buyer
By Lynn Hume
January 26, 2017
U.S. states, cities, schools and other issuers in the municipal market are expected to sell about $4.4 billion of bonds and notes next week, down from about $7 billion this week, according to preliminary Thomson Reuters data.
Infrastructure deals rank high on next week’s sales, led by $478.5 million of revenue and refunding bonds from the Oklahoma Turnpike Authority. New York City Municipal Water Finance Authority plans to sell $330 million of water and sewer system second generation resolution revenue bonds. There’s also $300 million of District of Columbia Water and Sewer Authority public utility senior lien revenue bonds.
Large education deals will also go to market next week. There’s $381 million of Board of Regents of Texas Tech University System taxable refunding and improvement bonds, and $323.6 million of general obligation bonds from North Clackamas School District No. 12. The University of Colorado Hospital Authority plans to sell $300 million of revenue bonds.
All of the top sales next week come from the negotiated calendar, which in total is expected to bring $3.4 billion to the market. An estimated $1 billion will hail from the competitive calendar.
The municipal market was a bit weaker on Thursday as munis posted losses in various spots along the yield curve, reported Janney Fixed Income on Friday. The benchmark 10-year and 30-year rates each increased by 1 basis point to finish at 2.39 percent and 3.19 percent. Municipal fund inflows were positive for the third consecutive week.
Reuters
Fri Jan 27, 2017 | 11:28pm IST
(Reporting By Robin Respaut; Editing by Bernard Orr)
Bonds for health care systems have long been a staple of the high-yield municipal bond market. I believe that they are closer to low-risk tax-backed and utility revenue bonds, which have extremely low default rates which approximate .5% an issue over the entire life of those bonds.
Bonds for senior living communities, development district “dirt bonds”, tobacco bonds and corporate “industrial development bonds can have default rates over the life of those bonds that range from 8%-15%. It is estimated that hospital bond defaults in range between 3%-4% over their life.
There is a wide spectrum of health care bonds. Bonds issued by large multi-state issuers have the lowest risk, because no single hospital default would drag down the rest of the system. Lower risk however means lower yields. Then then there is an array of single site hospitals, with varying degrees of risk. I prefer hospitals that have national or international demand, perhaps because of the specialty they may offer such as state-of the art pediatric, heart and/or cancer services. I also look for balance sheets containing at least 150-200 days of cash on hand to meet recurring monthly expenses, and cash equaling or exceeding outstanding debt.
Finally, there are “Critical Access Hospitals”, small units in rural areas where patients cannot reach acute care facilities within driving distance. These hospitals obtain special subsidies to allow for their operation under sparse resources.
Risks in this sector are considerable because competition from new hospitals can drain resources from older hospitals. However, health care represents a vital public service, and will continue unless technology provides an alternative. At this point, it is fruitless to ascertain changes to ObamaCare until the President and Congress “show their cards.”
Dick Larkin, Credit Analyst for Stoever Glass
6:00 a.m. Monday, Jan. 23, 2017
Dick Larkin is a former Chief Municipal Rating Officer for S&P. Stoever Glass is a 54 year-old Investment firm specializing in Municipal Bonds located in New York & Florida. A registered Broker/Dealer, Member FINRA, SIFMA, & SIPC. Advisory Services through Stoever Glass Wealth Management, Inc., a registered advisory firm.
WASHINGTON – President Trump’s nominee for Treasury Secretary Steven Mnuchin told lawmakers in writing that he plans to “enhance” private activity bonds so that they can be used to encourage more private investment in infrastructure projects.
In written responses to questions from members of the Senate Finance Committee who will decide whether to recommend the Senate confirm him, Mnuchin also said that he would help administration officials consider all options to ensure the long-term solvency of the Highway Trust Fund.
In addition, he promised committee chair Sen. Orrin Hatch, R-Utah, who is very displeased with Treasury’s Office of State and Local Finance, that he will evaluate the office and its activities.
Mnuchin’s comments about private activity bonds came after Sen. Sherrod Brown, D-Ohio, asked him what steps he would take to modernize private activity bonds (PABs).
“There are areas where we can improve [PABs], including changing volume caps for certain types of projects,” Mnuchin responded. “If confirmed, I plan to review ways to enhance [PABs] with the goal of driving more private investment into American infrastructure.”
The Treasury nominee was less specific about governmental tax-exempt bonds. When asked by Sen. Maria Cantwell, D-Wash., if he considers the tax exclusion for municipal bond interest a “special interest deduction,” Mnuchin said, “The President is committed to rebuilding America’s infrastructure. If confirmed, I will work with Congress to determine the role of tax exempt financing vehicles under that plan and as part of broader tax reform.”
Trump and Republican lawmakers have vowed to eliminate special interest deductions as part of tax reform.
Sen. Mark Warner, D-Va., asked the Treasury nominee if he would commit to work to identify potential revenue sources to bring long-term solvency to the Highway Trust Fund (HTF).
Mnuchin responded, “As Treasury Secretary, I will help the administration consider all options for increasing investments in infrastructure and ensuring the long-term solvency of the [HTF].”
State highway officials have been worried that Trump’s proposed $1 trillion infrastructure proposal obscures the need to find a long-term source of federal funding for the HTF, which supports almost all federal highway and transit funding.
The HTF, which contains revenues from federal gas, diesel and other taxes, is anemic and will only remain solvent through 2020, according to the Congressional Budget Office. Those revenues have been dropping because cars are more fuel efficient and, during the Great Recession, families and individuals drove less.
Mnuchin promised to review Treasury’s Office of State and Local Finance at the request of Hatch who noted the office was established in April of 2014 “without notification or discussion” with him when he was ranking minority member of the committee.
“That office has engaged many of its activities in recent years to lobbying Congress for bankruptcy authority for Puerto Rico, including what in my view has been highly politicized rhetoric concerning ‘austerity’ versus creditor ‘haircuts,’ where many creditors happen to be innocent residents of Puerto Rico who purchased bonds issued by numerous component units of the Puerto Rico government,” he said.
The committee chairman noted that while the office was authorized to provide ‘technical assistance’ to Puerto Rico, it “recently tried to expand that authority” by requesting appropriation committee members to authorize it to give the same kind of assistance to states and municipalities.
Hatch said the office has been unresponsive to requests from his staff for briefings on the “technical assistance” it’s providing Puerto Rico “and why at least one Treasury official has signed confidentiality agreements with component units of the Puerto Rico government, including a bond-issuing unit.”
Hatch raised this issue last June in a letter to Treasury Secretary Jacob Lew, warning the agreements signed with the Puerto Rico Electric Power Authority (PREPA) “have the potential of granting select federal officials access to possibly market-sensitive information.”
Lew responded that the agreements were a “typical arrangement” that helped Treasury officials better understand Puerto Rico’s financial condition and that Treasury staff had provided the agreements to the committee.
Hatch, in his written questions, said, “troubling press reports” suggest the office’s activities may be “more political than what Congress would reasonably expect to be ‘technical’ assistance.”
Mnuchin responded, “I will be pleased to look into the Office of State and Local Finance and evaluate both its focus and effectiveness as you suggest.”
As for the Internal Revenue Service, Mnuchin told Warner that he “will seek to adequately staff and modernize” it. “I do not have access to all of the information, but it is likely that further cuts to the IRS will indeed hamper our ability to collect revenue,” he said.
The Bond Buyer
By Lynn Hume
January 25, 2017
The link between corruption and debt is particularly prominent for private projects, such as stadiums.
Corruption might not just land politicians in jail. It could also cost taxpayers more money.
According to new research published in the journal Public Administration Review, states with more public corruption convictions have greater levels of government debt. Fighting corruption, the authors argue, can help governments limit debt and lower the higher borrowing costs they’re subject to.
“Public corruption is far from a victimless crime. It costs money,” said John Mikesell, an Indiana University professor who co-authored the study.
Researchers found that the 10 most corrupt states would have owed an average of 9 percent less, or $249.35 per capita, if they cut levels of corruption to the 50-state average.
A link between public debt and corruption may exist for a number of reasons. Compared to operating budgets, issuance of debt typically isn’t as closely scrutinized. And, the report authors say, stealing a fraction of money from a large deal is often more profitable than siphoning dollars from a single line item in the budget.
From 1977 to 2008, the study found the relationship between corruption convictions and debt to be strongest for long-term debt issued for private purposes. Debt issued for private purposes typically involves more private-sector players, opening up more opportunities for corruption. For instance, deals involving private parking garages or stadiums — where profits are a major consideration — are more ripe for corruption than construction of new schools, said Mikesell.
There’s also a relationship between corruption and how governments spend their money. According to related research published in the journal Economics of Governance, developed countries with more corrupt political environments invest more in housing and physical capital projects than schools and health.
Interestingly, the new study didn’t find a relationship between corruption and short-term debt, which is typically due within a year. That’s because, according to the authors, short-term debt is generally subject to greater scrutiny.
To approximate levels of corruption, the study relied on numbers of convictions reported by the U.S. Department of Justice. One limitation of the study is that this data does not distinguish between public officials and all other types of government employees, such as postal workers and administrative staff caught stealing. The study further controlled for multiple political and demographic factors, such as incomes and the competitiveness of elections.
Governments can try to curb mounting debt levels, but it’s difficult.
The report found some measures — such as limiting tax expenditures and general obligation debt, and giving governors strong veto powers — showed no significant effects on public debt.
Other research suggests rating agencies disincentivize corruption by giving lower credit ratings to bonds issued by governments viewed as more corrupt. Despite that, lower credit ratings, and thus higher borrowing costs, aren’t shown to curb corruption either.
But it’s likely, the report notes, that some legal determinants are easily avoidable when corrupt officials possess the will to do so.
Still, this doesn’t mean that deterrents are futile. Other safeguard measures not studied might be more effective. Mikesell cited efforts such as aggressive internal audits, requirements for more than one person to sign checks and regular personnel rotations.
“It’s very important to have robust systems in place to prevent the impact of public corruption as much as possible,” said Mikesell. “Little things could prevent fairly massive theft.”
GOVERNING.COM
BY MIKE MACIAG | JANUARY 24, 2017
A roundup of money (and other) news governments can use.
GOVERNING.COM
BY LIZ FARMER | JANUARY 27, 2017
The U.S. public transportation sector dealt with a lot of uncertainty in 2015, stemming from uncertain federal funding, fluctuating transaction volumes, and a continued slow economic recovery. Standard & Poor’s Ratings Services believes the sector will continue to face some minor turbulence and bumps in the road in 2016, and with perhaps some positive news for certain grant anticipation revenue vehicle (GARVEE) bonds.
We define the transportation sector as consisting of seven categories. The three largest, by the number of entities that Standard & Poor’s rates, are airports, toll roads and bridges, and ports. Other categories include bonds secured by parking systems, transit systems, special facilities (such as cargo or passenger airline terminals, as well as fuel farms at airports), and GARVEES, which are bonds backed by direct federal payments for highway and transit programs (GARVEES are grant anticipation revenue vehicles). Standard & Poor’s expects 2016 to be another year of stable credit quality for the Transportation sector. The GARVEE category, however, is bifurcated as bonds rated ‘AA’ and higher are stable and ‘A’ rated credits may have upside potential.
12-Jan-2016
Taylor Riggs, a contributor to Bloomberg Briefs, talks with Joe Mysak about this week’s municipal market news.
Bloomberg
January 27, 2017
CHICAGO — U.S. governors are flagging hundreds of “shovel-ready” projects they regard as high-priority for President Donald Trump’s plan to fix the nation’s infrastructure.
Scott Pattison, executive director of the bipartisan National Governor’s Association, said on Monday his group, at the request of the White House, has assembled a list of 300 projects costing billions of dollars from 43 states and territories, with more expected to come.
“The good part from a bipartisan standpoint is there seems to be full consensus that we have a lot of infrastructure problems in the U.S., a lot of maintenance issues, also things that need building,” he said in an interview.
In his inaugural address Friday, the Republican president said the nation’s infrastructure “has fallen into disrepair and decay.”
“We will build new roads, and highways, and bridges, and airports, and tunnels, and railways all across our wonderful nation,” Trump said.
White House Press Secretary Sean Spicer on Monday told reporters that “infrastructure continues to be a huge priority.”
The American Society of Civil Engineers’ infrastructure report card has estimated the United States needs to invest $3.6 trillion by 2020.
Pattison said while it was still early in the process, disagreements are likely over how to fund infrastructure. He added that governors want “all the tools” to be made available, including cash, municipal bonds, public-private partnerships and federal matching programs.
“One of the biggest issues that has to be faced is that the gas tax has been primarily the way in which we funded a lot of our transportation projects, and that’s a declining revenue source,” Pattison said.
Governors also want to make sure their project priorities are immune from congressional earmarking, Pattison said, adding that states have developed “robust” prioritization programs.
By REUTERS
JAN. 23, 2017, 6:06 P.M. E.S.T.
(Reporting by Karen Pierog; Editing by Matthew Lewis)
They are an important part of the infrastructure toolkit, but they can’t replace tax-exempt debt.
State and local governments are eager to find ways to address the infrastructure deficit. While both the Obama administration and the incoming Trump White House have promoted a greater use of public-private partnerships (P3s), government officials are well advised to bring rigorous analysis and staff expertise to the negotiating table to avoid costly mistakes and minimize risks for taxpayers.
Recent news coverage highlights the importance of careful analysis. A recent article in the New York Times reported on a long-term deal that Bayonne, N.J., cut with a private equity firm in 2012 to manage the city’s water system. While the city got an immediate infusion of investment in its ailing water system, residents have since seen their bills rise by 28 percent. City officials had expected rates to be frozen for four years after an initial bump. The rate freeze did not occur, in part because residents had conserved more water than expected, which reduced the amount of revenue the private-sector partner had negotiated.
And in Virginia, the Washington Post reported that one of the state’s top transportation priorities has run into a financial hurdle. The state seeks to expand a tunnel in the notoriously congested Hampton Roads region. The project could be costlier than expected due to a non-compete clause negotiated in a 2011 agreement with Elizabeth River Crossings , a partnership between a Swedish construction company and an Australian finance group. The 58-year agreement stipulates that if ERC’s toll revenue falls after the tunnel project is built, the state might be required to make up the difference.
Of course, some P3 projects work out well for both the public and private sector. Can Chen and John Bartle describe the successful Port Miami Tunnel project in a new policy white paper written for the International City/County Management Association (ICMA) and the Government Finance Officers Association (GFOA). The tunnel opened in August 2014 and features a 35-year concession agreement, service-quality standards and milestone payments to the concessionaire during the construction period by the Florida Department of Transportation, in partnership with Miami-Dade County and the city of Miami. The tunnel will be returned to the Florida DOT in 2044.
Clearly, P3 projects can be a good way to leverage advanced technology and innovation in the private sector, and they have the potential to bring greater efficiency to an operation. On the other hand, complete project costs and risks often are not anticipated, and many do not factor in the range of equity issues related to service provision and fees. Some states and localities acknowledge the need for more staff and outside expertise to develop and manage P3s. Recognizing that some P3 projects pose a significant risk to public-sector entities — sometimes for decades — GFOA last year issued an advisory to exercise caution when considering a P3 arrangement.
As useful as public-private-partnerships are, they still represent a small part of the infrastructure investment toolkit in the United States. Tax-exempt municipal bonds top the list, paying for everything from roads and bridges to schools, airports, water and wastewater projects, parks, sidewalks, infrastructure repairs, and public transportation. Between 2003 and 2014, states, counties, cities and other local governments invested $3.5 trillion through municipal bonds, while the federal government provided $1.46 trillion. And tax-exempt bonds are on a path to finance another $2 trillion in infrastructure over the next 10 years. In all, debt financing accounts for 90 percent of state and local capital spending, according to a 2015 ICMA policy paper.
None of this is to suggest that alternative financing tools shouldn’t have a place in the toolkit. It’s no secret that our investment in roads, water systems and just about every other critical infrastructure priority has fallen behind in recent years. Having a reliable revenue stream to finance the most pressing projects is essential. But while P3s and other financing tools are welcome additions, they cannot replace the role of municipal bonds in financing public projects.
GOVERNING.COM
BY ELIZABETH K. KELLAR | JANUARY 18, 2017
A roundup of money (and other) news governments can use.
GOVERNING.COM
BY LIZ FARMER | JANUARY 20, 2017
As we talk about rebuilding our public works, we need to remember that parks are as important to our cities as roads and bridges.
The new presidential administration has signaled a strong desire to rebuild our infrastructure, especially in our cities. This is sparking a renewed and welcome national conversation on how to make it happen. But along with roads, rails, bridges and water systems, let’s remember the profound role that city parks play as a necessary ingredient in those plans. Urban parks are not luxuries; they are essential infrastructure for 21st century cities.
Nearly 80 percent of Americans live in urban areas. Increasingly, many of our cities are challenged by aging water and transportation systems that are nearing or exceeding their designed capacity. Complicating the picture, a new focus on environmental resilience to flooding and other natural disasters is driving city planners to more strongly consider “mixed-use” infrastructure. Urban parks are the very definition of mixed use.
So strong is the case for urban parks in America’s future that the bipartisan Mayors for Parks coalition wrote a letter to the Trump transition team calling for parks to be prioritized among its infrastructure plans. These mayors, and other leaders at the municipal, state and federal levels, know that community parks can grow local economies and attract businesses, workers and investment. And numerous studies have shown that the presence of a nearby park adds 15 to 20 percent to residential and commercial property values.
That’s not all. Investment in mixed-use infrastructure projects — those that include both parks and green space — is building a strong track record of leveraging public funds with private capital to address many of our most vexing urban challenges, including those relating to transportation, stormwater management and access to recreation. Beyond the economic and environmental benefits of mixed-use infrastructure, there are the well documented human health benefits of proximity to nature. Studies show that people exercise more if they have access to parks, and including nature in the built environment improves quality of life and sense of community.
The outcome of this renewed emphasis on city parks is remarkable. The Historic Fourth Ward Park and Reservoir in Atlanta is a prime example of what is possible. Atlanta’s Department of Watershed Management saved $16 million by constructing a water-retention pond to mitigate flooding, rather than tunneling and installing a single-use network of pipes to deal with the problem.
The park is one of many that are linked to the Atlanta BeltLine, which has been described as the most comprehensive transportation and economic-development effort ever undertaken by the city. This visionary project includes a 22-mile network of parks and trails connecting 45 neighborhoods and providing new transportation options. The park and the nearby Ponce City Market have attracted an additional $600 million in commercial investment and residential construction. Quality of life has surged and community services have improved dramatically.
Atlanta is not alone. Over the next quarter-century, Philadelphia’s Green City, Clean Waters program will invest $2 billion in parks and green infrastructure to capture 85 percent of the city’s stormwater runoff. The program not only will lead to green jobs but also will save billions that would otherwise be spent on underground pipes and tunnels. And Philadelphians will enjoy beautiful parks for decades to come.
While city parks are a clear win for everyone, they are not a new cause. For three years running, the U.S. Conference of Mayors has had the foresight to adopt resolutions calling for permanent and full funding of the federal Land and Water Conservation Fund, whose goal is to conserve land and improve outdoor recreation opportunities nationwide, and to emphasize parks in comprehensive urban policy and community development.
Americans are taking note. In poll after poll, voters agree that fixing our aging transportation and water infrastructure is a priority. As the new Trump administration promises to deliver infrastructure investment, parks deserve a prominent place in the mix of options to help revitalize our urban communities.
This summer, from July 29 through Aug. 2, more than 1,000 global park leaders will gather at the Greater & Greener 2017 conference in Minneapolis and Saint Paul to explore the power urban parks have to support healthy, resilient and sustainable cities.
GOVERNING.COM
BY CATHERINE NAGEL | JANUARY 23, 2017
WASHINGTON, DC (January 13, 2017) — Congresswoman Rosa DeLauro (CT-03) reintroduced the National Infrastructure Development Bank Act today with 73 original cosponsors supporting the legislation. DeLauro’s bill would create and fund a public bank to leverage public and private dollars to help rebuild roads, highways, bridges, and environmental and energy projects of national or regional significance.
“With the nation’s infrastructure in dire need of rebuilding and reinvestment, a National Infrastructure Bank would allow Congress to pursue a clear, comprehensive infrastructure policy that addresses the scope of the issue. Now is the time to invest in our nation, building better infrastructure systems and a stronger economy,” said DeLauro. “Through this bill, we can take a step forward that addresses the tremendous shortfall in infrastructure investment, creates jobs, spurs long-term economic growth, and improves our competitiveness across the globe.
“Congress should work together to pass my National Infrastructure Development Bank Act and send it to President-elect Trump as soon as he is sworn into office,” continued DeLauro. “Mr. Trump advocated for investment in our nation’s infrastructure on the campaign trail, and this legislation is an opportunity for him to build on his promises.”
The legislation, modeled after the European Investment Bank, would leverage private sector dollars from institutional investors, such as pension funds, to supplement current funding in our nation’s infrastructure. It would provide loans and loan guarantees to projects, and issue Public Benefit Bonds with proceeds to fund projects, and make payments to help states and localities cover their bond interest payments.
The National Infrastructure Bank would finance surface transportation projects, as well as energy, environmental, and telecommunications projects. The bank would consider each project’s economic and environmental impacts, social benefits, and costs objectively before selecting projects to finance.
Environmentally conscious green bonds are a tool more issuers use to finance various means of purifying drinking water and buffering against rising seas.
Municipal issuers from transit agencies to small cities and towns have sought to manage water more effectively — notably after Hurricane Sandy struck in 2012 – with varying degrees of success.
Larger agencies with bonding capability, such as New York’s Metropolitan Transportation Authority, have earned praise from climate experts and municipal analysts alike.
Other municipalities are still struggling.
“Municipalities have not figured that out yet,” said storm financing expert Alan Rubin. “Unlike municipalities, the MTA can do it because they have their metrics and their own bonding without having to go through a referendum.
“Municipalities can use green bonds to purchase this kind of equipment,” said Rubin, nicknamed the “Hurricane Czar” after working extensively in Miami-Dade County, Fla., when Hurricane Andrew caused more than $30 billion in damage in 1992. While working in Lehman Brothers’ investment banking division, Rubin also helped design and underwrite the catastrophe fund for hurricane relief.
According to Rubin, municipal options include partnering with corporations and manufacturing firms, or working with other communities under shared-services arrangements.
Also on the table is matching state and federal grant and loan money. “[Andrew] Cuomo’s got a lot of money available,” Rubin said of New York’s governor, who on Jan. 9 called for spending $2 billion to improve the state’s water infrastructure.
According to S&P Global Ratings’ Boston-based credit analyst Kurt Forsgren, water projects still represent about half of all par issued for green bonds as well as half of all issues in 2016 from January through August.
“One challenge is balancing the need for global consistency across and within asset categories while serving the often unique features of local infrastructure providers in different markets,” said Forsgren. “For example, many U.S. municipal water utilities operate as combined enterprises with water, wastewater and storm water assets as part of an integrated system. Other water and wastewater utilities operate as separate enterprises.”
London-based Climate Bonds Initiative is working to group similar asset classes into broader categories.
MTA post-Sandy initiatives included the issuance of a $200 million catastrophe bond late in 2013, the first bond that covered storm-surge risk arising from named storms.
The MTA, which operates New York City’s subway, bus and commuter rail systems plus several bridges and tunnels, has beefed up capital spending, including $2 billion alone to seal off water entry points. Other actions have included launching a catastrophe fund, repairing several tunnels and rebuilding the South Ferry station in lower Manhattan – built below the water table, renovated in 2009, and which Sandy hammered in 2012. MTA officials expect to reopen South Ferry later this year.
“The MTA has figured it out. It has done a very, very good job,” Rubin said of the authority, one of the largest municipal issuers with roughly $37 billion in debt.
In addition, the MTA took proactive steps by shutting down in advance of the storm and moving subway trains, commuter rail cars and buses to safe storage locations.
Water management includes preserving the quality of drinking water to buffering against sea surge. The sea level rose to 14 feet during Hurricane Sandy.
Municipal management of water is a different story, according to think tank Brookings Institution.
Only a handful of drinking water utilities in the largest cities performed well across six indicators of financial health, Brookings said in a report. Metrics, culled from American Water Works Association data, included operating and debt-to-asset ratios, and monthly residential water rates.
Brookings examined local water infrastructure investment in the U.S., notably large drinking water facilities. “As concerns continue to ripple from incidents in Flint, Mich., and beyond, cities remain at the forefront of many investment challenges, yet they often do not have a clear sense of where they stand relative to it.”
Brookings cited a disconnect between investment demand and institutional capacity. According to Brookings, while more than 88% of Americans believe some kind of action is necessary to grasp the country’s water infrastructure challenges and many analysts agree that the time is ripe for more infrastructure investment, only 17% of utilities are confident that they can just cover existing service costs – let alone necessary upgrades — through rates and fees.
“Publicly owned and operated utilities are increasingly running up against tight budgets, debt obligations and other barriers to investment as user charges, municipal bonds and traditional financing tools fail to keep up with the level of need,” said Brookings.
Sea level rise, meanwhile, continues to threaten the tri-state New York region, which holds about 23 million residents with roughly 3,700 miles of tidal coastline.
“Relatively little has been done to address the inevitable permanent inundation of buildings, infrastructure and communities,” transit-oriented organization Regional Plan Association said in its own report. According to RPA, the region could realize one foot of sea-level rise by 2050, possibly by the 2030s. Six feel of sea-level rise is possible early next century, the report said.
That, said RPA, could threaten the region’s three major airports plus Teterboro Airport in northern New Jersey.
For MTA, the surprise nature of Sandy – the eye of the storm veered from sea and right-angled into metro New York – provided opportunity on two fronts: to improve its water resilience and to grasp overall operational flaws.
“My sense is that the structural deficiencies and other deficiencies were brought to light as a result of Sandy,” Stuart Lerner, vice president of MTA contractor Stantec, said at a Jan. 10 workshop at the New York Transit Museum in downtown Brooklyn. “Sandy provided a whole new opportunity to solve two problems at once, which were water resilience and structural defects.”
Compounding the MTA’s difficulties was the corrosive salt in the water that gushed through the tunnels.
“Millions and millions of gallons of salt water are a bad thing for a 110-year-old legacy system,” Iain Watt, director for recovery and resiliency at the MTA’s New York City Transit unit, told the Transit Museum gathering.
Much of the damaged equipment was deep in the bowels of the subway tunnels. “Pumps, fan controls, signal systems, emergency equipment … much of it dates back longer than anyone in this room,” he said.
According to Watt, the MTA is spending $2 million of its capital funds to seal off 3,600 water entry points, basing its work as suitable for a Category 2 flood zone, based on a National Weather Service model.
Entry points, beyond the obvious subway entrances, include “stairwells and manholes, some of them with our name on it, some with Time Warner’s,” said Watt, while structures also varied widely by nature of abutting property.
New equipment, said Watt, was tailored for MTA contemporary needs. “Nothing off the shelf,” he said. “All of it was designed for us.”
The Bond Buyer
By Paul Burton
January 17, 2017
In November, voters across the United States endorsed numerous state and local ballot measures approving additional funding for green space, land conservation, and public transportation. Notably, voters also approved minimum-wage increases in four states and legalized medical or recreational marijuana ballot initiatives in eight states.
According to the Center for Transportation Excellence, which follows ballot measures related to public transportation, “November 8 was a historic day for public transportation in the United States as voters approved 34 of 49 public transit measures for an election-day passage rate of 69 percent.” The success rate for transit ballot measures throughout 2016 was 71 percent. In 23 states and communities of all sizes, voters considered nearly $200 billion in local and state support for public transportation.
The largest ballot measures were in California, where San Francisco Bay area voters approved $3.5 billion for the Bay Area Rapid Transit (BART) regional transit system, while Los Angeles voters approved Measure M, a 0.5 percent sales tax increase that will generate an estimated $100 billion over 40 years, including $860 million a year for a big expansion of bus and rail transit.
It wasn’t just in politically progressive California where voters endorsed transit funding. Voters in Atlanta approved $2.5 billion for transit including rail extensions, bus upgrades, and streetcar extensions. Voters also approved an additional $379 million over five years for bike trail and sidewalk improvements.
In Indiana, Indianapolis voters approved a 0.25 percent income tax increase that will fund a regional rapid transit network of expanded bus and bus rapid transit lines, including the next phase of the existing Red Line. Similarly, voters in Raleigh, North Carolina, and Columbus, Ohio, approved ballot measures providing additional funds ($1 billion over ten years for Raleigh) for expanded transit services.
Active transportation including bike trail development and sidewalk improvements also got a boost in several communities, including Atlanta; Portland, Oregon; Charleston, South Carolina; and Maine.
While transit measures received widespread support, park and open space measures received even stronger support. For example, Los Angeles Measure M passed with 70 percent approval, but another proposition, Measure A, passed with an even higher margin, earning nearly 73 percent of the vote. Measure A will boost investments in park space and will accelerate plans to open much of the Los Angeles River to public access for bicycling and outdoor recreation.
According to the Trust for Public Land, which follows state and local ballot measures for land conservation and parks, voters approved 68 of 86 ballot measures, providing $6.3 billion for conservation. Many of these measures involved tax increases or bonds. Will Rogers, president of the Trust for Public Land, said, “Tonight, we saw again that while American voters are divided on many issues, parks and natural areas are an issue that we can agree on. Whether they were voting for ‘red’ or ‘blue’ candidates, voters are ‘green’ when it comes to parks and close-to-home places for outdoor recreation.”
Earlier in 2016, voters approved 14 of 17 land conservation ballot measures, approving an additional $3.3 billion for parks and open space. This means that in 2016, voters endorsed 82 of 103 ballot measures for land conservation, allocating a total of $9.6 billion. Some of the green space initiatives approved by voters include the following:
The high approval rate (79 percent) for land conservation ballot measures is not surprising given the fact that over the last 25-plus years, 75 percent of all state and local ballot measures for conservation have also been approved. Since the Trust for Public Land started tracking ballot measures on land conservation in 1988, voters have approved nearly 2,000 ballot measures allocating more $75 billion for parks and open space.
ULI members should pay particular attention to measures supporting transit and parks because both are key drivers of real estate investment and community revitalization. In 2014, when the Institute surveyed industry leaders and public officials on infrastructure’s role in shaping the competitive city, “infrastructure quality” emerged as the top factor driving where real estate development happens. What’s more, “upgrades to public transit systems”—including bus and fixed-rail systems—emerged as the top infrastructure funding priority. Transit- and park-oriented development have both emerged as major forces shaping the cities of the future.
Urban Land Institute
By Edward T. McMahon
November 28, 2016
Edward T. McMahon holds the Charles E. Fraser Chair on Sustainable Development and Environmental Policy at the Urban Land Institute in Washington, D.C.
DALLAS – Vice President-elect Mike Pence tried to sell to the nation’s mayors on the infrastructure plan to be proposed by the new Trump administration, just before a national poll showed there is little support for the tolls on which the plan would rely.
Speaking at the US Conference of Mayors’ winter meeting in Washington, D.C., Vice President-elect Mike Pence said the new Trump administration will propose a robust infrastructure bill with the ample funding needed for large projects. “I called him [President-elect Donald Trump] this afternoon to tell him I was coming by,” Pence told the approximately 300 mayors on Tuesday. “In addition to urging me to send along greetings, he said, ‘Tell ’em we’re going to do an infrastructure bill, and it’s gonna be big.’ ”
Pence provided no additional details to Trump’s proposal from late October that would use $137 billion of federal tax credits to leverage $1 trillion of private investments in infrastructure over 10 years.
“It will have the funding to help communities and states all across America meet the needs that face too many communities and often times stifle growth,” he said of the infrastructure bill.
Trump’s proposed reliance on tolls from revenue-producing infrastructure projects to provide an attractive return on investment for private investors found scant support in a new Washington Post-ABC News poll of 1,005 respondents carried out from Jan. 12 to Jan. 15.
The tolling plan was strongly opposed by 44% of those polled and somewhat opposed by 22%. Only 11% said they strongly supported the Trump proposal and 18% were somewhat supportive.
The new administration will work with city and state officials to fund infrastructure projects that deliver results, Pence said.
“This administration is going to be a friend to America’s mayors,” he said. “I can assure you, our president-elect understands that America’s mayors are facing serious challenges you can’t always solve on your own.”
Trump’s experiences as a developer showed him the significant economic benefits that can result from large infrastructure projects, Pence said.
“Our president-elect believes, as I do, that the federal government can play a critical role in helping our cities thrive,” he said.
“That’s probably why he spent so much time in the campaign highlighting many issues that are facing America’s cities,” Pence said. “Remember, after all, he’s a New Yorker, through and through.”
Trump last week appointed two well-known New York City developers to leadership of a panel that would oversee the nationwide infrastructure plan.
Steven Roth of Vornado Realty and Richard LeFrak of LeFrak Organization have agreed to head up the infrastructure council, Trump told the Wall Street Journal last week.
“They’re pros,” Trump said. “That’s what they do. All their lives, they build. They build under budget, ahead of schedule.”
Vornado will merge this year with The JBG Cos to form JBG Smith, which is one of four groups to be short-listed by the General Services Administration for redevelopment of the FBI headquarters in downtown Washington.
The GSA intends to pay for a new FBI building in part through the swap of the 6.7-acre J. Edgar Hoover Building site to a private partner who would build a larger, more secure facility on one of three sites outside the city.
The total federal contribution to the project has been capped at $2.11 billion, which does not include the estimated $500 million value of the Hoover Building.
Mick Cornett, the Republican mayor of Oklahoma City who is president of the mayors group, said infrastructure funding is a bipartisan issue.
“Our nation’s highways need work,” he said. “America’s people deserve an investment in their infrastructure. We’re ready to go.”
Transportation Secretary-designate Elaine Chao said at her Senate confirmation hearing last week that Trump would be agreeable to more direct federal funding of state and local projects than is contained in the five-year Fixing America’s Surface Transportation Act adopted in 2015.
The Bond Buyer
By Jim Watts
January 18, 2017
U.S. states, cities, schools and other issuers in the municipal market are expected to sell about $7 billion of bonds and notes next week after muni prices dropped sharply on Thursday and Friday.
The price fall boosted the 10-year yield on Municipal Market Data’s benchmark triple-A scale 17 basis points over the week to 2.33 percent. The 30-year yield rose 15 basis points to end Friday at 3.06 percent.
Peter Block, a muni market strategist at Ramirez, said tax-free bonds were following a slump in U.S. Treasuries.
“It’s really driven by Treasuries. It’s hard to say what will happen next week,” he said, adding that much depends on what messages emerge from Washington under President Donald Trump’s new administration. Topping next week’s negotiated calendar is a $486 million new and refunding city of Baltimore water and wastewater revenue bond issue pricing through Citigroup on Thursday after a retail presale period on Wednesday.
San Francisco’s Bay Area Toll Authority will sell $450 million of toll bridge revenue bonds through Bank of America Merrill Lynch on Thursday.
In competitive bidding, the Metropolitan Government of Nashville and Davidson County will sell $457 million of general obligation bonds on Tuesday. The bonds carry serial maturities between 2018 and 2036, according to the preliminary official statement.
The Los Angeles County Metropolitan Transportation Authority has set a $455.7 million sales tax revenue bond sale for Tuesday. The bonds mature in 2018 through 2042.
U.S. municipal bond funds reported a second straight week of net inflows, indicating investors were seeing relative value in munis, according to Block. Lipper reported $511.7 million of inflows in the week ended Jan. 18, down from $974 million in the prior week.
Reuters
Fri Jan 20, 2017 | 3:53pm EST
(Reporting By Karen Pierog; Editing by Chizu Nomiyama)
Looking back, municipal experts compared the tax-exempt bond market in 2016 to a white-knuckle thrill ride – without seat belts.
“I would describe 2016 as a ride on a roller coaster – there were some wonderful highs and some very painful lows,” Dan Heckman, senior fixed income strategist at U.S. Bank Wealth Management, said in an interview on Thursday.
Tax-exempt professionals were caught off guard by three events in 2016: the consecutive inflows into municipal bond mutual funds, the spike in volume, and the selloff following the presidential election.
They were otherwise largely on target with most of their other expectations about the economy, demand, and credit spreads just as 2016 was getting under way a year ago. In retrospect, though, they said they couldn’t have predicted the volatility that surfaced by year end.
“The market initially expected at the start of 2016 that bond rates were likely to move higher in line with the Fed’s expectation for better U.S. growth,” Rich Ciccarone, president and chief executive officer of Merritt Research Services LLC, said in an interview on Wednesday.
“That trajectory was derailed just weeks later as evidence of subdued global prospects and weak oil prices appeared to suggest an unforeseen negative correction,” he said. “Bond rates fell and the stock market subsequently languished for much of the year as low inflation expectations, oil, Brexit and politics provided fertile ground for volatility and being defensive.”
Heckman said the market saw its share of major ups and downs along the way, starting with a dismal forecast.
“The market set up not to do that well after two previous strong performance years in 2015 and 2014,” Heckman said. However, the market “took a strong bid and saw lower interest rates from February through June.”
Many of the surprising events took place in the second half of the year, Heckman said.
“In July the market saw signs of weakening, and stayed weak as we went through September, October, and through November,” he said. “In November, the market got sold off and the severity of it took us all by surprise,” before rebounding in December, Heckman said.
Municipals were flat and total returns were zero heading into year-end as the post-election dip erased earlier gains.
Some analysts were on the right track when it came to their general predictions, but admitted they were off when it came to volume and the impact of the election.
“With the benefit of hindsight, as the year unfolded it largely went in the direction we thought it would, but we certainly didn’t anticipate it would take the roller coaster ride it did,” said Jim Grabovac, who co-manages portfolios with Dawn Mangerson at McDonnell Investment Management.
He was referring to the plunge in municipals following Donald Trump’s victory in the Nov. 8 presidential election.
“Our fundamental outlook worked very well for us, but we certainly did not anticipate those deviations on the political front that took place” in the fourth quarter, Grabovac said in an interview on Tuesday.
Muni yields, which move inversely to price, surged on concern that Trump’s victory in the presidential race and Republican control of the House and Senate would open the way to tax reforms that dissipate the value of – or eliminate – the bonds’ tax exemption.
Muni yields rose by as much as 55 basis points a week after the election amid uncertainty over government spending and inflation, including a one-day jump in yields by 22 basis points in a single trading session on Nov. 14.
“We turned bullish on the market because we thought things had gotten very extreme,” Heckman said. “Yields had gotten too high and prices too low” over concerns of personal income tax reform under the Trump administration as well as the expectations of the Fed’s December rate hike and prospects for ratcheting up the pace of tightening with further increases in 2017.
The S&P Municipal Bond Index finished down 3.46% in November, the worst monthly total return since September 2008, according to S&P Dow Jones Indices.
“What I didn’t predict was the big sell-off in the Treasury market,” Heckman said. “People were positioned for rates to drop” under a Trump victory, but instead, the opposite occurred, he said.
Further significant market impact after the election surfaced when municipal mutual funds reported the biggest outflow in more than three years as investors withdrew $3.011 billion out of the industry in the week ended Nov. 16. That came on the heels of $62.837 million of inflows in the previous week.
Some of the unexpected activity arrived in the first half of the year – well before the election and the market sell-off.
“The number one surprise for everyone was the consecutive flows into muni bond funds,” Heckman said. “It ran much longer than we anticipated and that consecutive streak set a record,” he said of the 54 consecutive weeks of inflows into municipal bond mutual funds.
That streak came to a close in the week ended Oct. 19 when $135.9 million fled the industry for the first time in over a year. It was the second longest stretch after weekly reporters saw 63 weeks of consecutive inflows back in 2010.
Meanwhile, Heckman was among those market participants that were off target with their predictions for volume – which turned out to be larger than he and others estimated. He assumed supply would total just over $400 million — but his guess was well under where it ended at approximately $446 billion.
Due to concerns over the Fed’s rate policy, issuers raced to market to get deals done – particularly between September and November, Heckman noted.
“The issuance total for 2016 took us a little off guard – it was larger than we expected and also broke a record set back in 2010,” he said.
As a result, Heckman expects issuance to taper off in early 2017 given the late 2016 flurry.
The McDonnell team anticipated 2016 supply would be closer to the $375 billion total of 2015. However, lower interest rates after the British vote to leave the European Union helped swell refunding issuance, which drove the record municipal volume in 2016, Grabovac said.
Like Heckman, the McDonnell team didn’t foresee the potential for interest rates to rise in 2016 as significantly and substantially beyond the general level the market had seen in the last few years, Grabovac said. That volatility was politically driven and changed the rate scenario dramatically through the year.
“It drove rates lower than they should have, and then the reaction to the election took them higher than we warranted,” Grabovac said.
In addition, he and Mangerson were surprised by the fluctuation in municipal valuations compared with their expectations for valuations to remain relatively stable over the year.
In late November, ratios of triple-A municipals to Treasuries soared above 100% from 10 through 30 years, according to Municipal Market Data.
“Because of the big increase in supply last year, munis underperformed Treasuries,” Grabovac said. Ratios of municipal yields to Treasury yields spent most of 2016 at 100%, after hovering at 85% in the 10-year range heading into the year.
“It was a reflection of higher-than-anticipated new-issue supply, and as a consequence, munis underperformed and valuations cheapened relative to Treasuries,” he said.
So far early in 2017, there has been a decent amount of supply and demand has strengthened following the November market sell-off, Mangerson said.
“As we enter 2017, munis remain attractive relative to Treasuries,” Grabovac said, adding that ratios across the yield curve are currently hovering around 90%.
“Right now, if we continue to see strong demand, valuations are likely to richen up from here,” Mangerson said.
She said overall the team’s fundamental outlook panned out in the end, but there was a little more volatility than they expected.
Aside from the effects of the political storm, Grabovac and Mangerson were close to their target predictions. McDonnell oversees $11.5 billion in client assets, 63% of which are tax-exempt municipal assets, including separately-managed accounts and two sub-advised municipal mutual funds.
The team anticipated that economic expansion would continue in 2016, although it ended up growing slower than they anticipated last year, Grabovac said.
“We thought inflation was well contained and in the process of drifting back toward the Fed’s 2% goal – and we believe the same in 2017 – largely driven by shelter cost and medical care inflation,” he explained.
They also predicted the Federal Reserve Board would continue to normalize rates at a gradual pace.
They believed the Fed would continue to raise short-term interest rates, but felt it penciled in too aggressive a rate path in the beginning of 2016. The Fed at that time had announced its plans for three rate hikes in 2016 – yet only accomplished one by yearend.
“Going forward we continue to think the rate path will be more gradual than the Fed’s summary of economic projections,” Grabovac said.
The firm’s other predictions – such as increasing exposure to spread sectors, such as hospitals, transportation, and power — worked in its favor.
“We thought the credit fundamentals were still solid and we felt comfortable going into sectors that offered more yield, but are historically more volatile,” Mangerson said.
The strategy allowed more yield into the portfolios from the hospital sector, for instance, where there was healthy issuance and attractive yields versus the plain-vanilla state general obligation sector — which underperformed for the year, Ms. Mangerson explained.
“Anything with yield performed better,” she said, noting that single-A and triple-B paper outperformed higher-quality paper in 2016.
For example, an A-rated hospital versus an A-rated GO – both due in 10 years – offered a 50 basis points yield pick up as spreads widened toward the end of the year, after compressing in the first two quarters, she added.
“Overall, the compression over the year helped performance,” as did the firm’s prediction that lower-quality sectors would outperform in a low rate environment with investors reaching for yield.
Heckman was more cautious and avoided some of the riskier outliers as he predicted some continued credit turmoil in 2016.
“I think we continued to be negative on Chicago, Illinois, and many of the states in the Northeast Corridor as we continued to see credit downgrade actions,” he said. “I believe we were spot on in 2016, and those things did occur,” he said.
He said troubled credits will gather more spotlight in 2017 – especially state pension funds will continue to raise a red flag due to liabilities growing faster than assets.
“We see that getting worse over the next few years if they are not addressed,” Heckman said.
Meanwhile, analysts, like Ciccarone, said years like 2016 are an example of why investor’s should always expect the unexpected.
“Economic and bond rate forecasts proved once again how difficult it is to confidently foresee the future when there are so many moving pieces that don’t always play out as expected,” Ciccarone said.
The Bond Buyer
By Christine Albano
January 20, 2017
The public power sector in the U.S. has long been characterized by solid and stable ratings, as credit quality has been bolstered by widespread rate-setting autonomy and a lack of competition for retail customers.
Jan. 19, 2017
In addition to saying that the outlook is stable, every year S&P Global Ratings anticipates the most likely drivers of credit quality for municipal waterworks and sanitary sewer utilities in the United States. While we always note that the sector carries relatively very low risk, we add that it is not without risk.
Jan. 18, 2017
Taylor Riggs, a contributor to Bloomberg Briefs, talks with Joe Mysak about this week’s municipal market news.
January 19, 2017
S&P Global Ratings’ outlook for the charter school sector in 2017 is stable. While the general charter school movement has seen growth over the past year and appears poised to continue that trend in 2017, we expect this growth to have little if any impact on the underlying credit quality of charter schools.
Jan. 12, 2017
Hire a talented executive and then find a business for him or her to run.
This method has worked well for David Becker, First Internet Bancorp’s (INBK) chairman, president and CEO, over his nearly 18 years at the helm of the $1.8 billion-asset institution.
That credo was on display earlier this month when the company hired Timothy Dusing to lead its municipal lending team.
The Fishers, Ind., company has never been a prominent lender to local governments, but that did not stop Becker from adding an executive with a long track record in the business.
The decision to hire Dusing “wasn’t a planned play,” said Becker, who was introduced to the executive by another First Internet employee. “My mantra has always been, if you run across a good employee, find a home for him.”
In doing so, First Internet joins a growing list of banks that are either entering municipal finance or significantly raising their profile in the space.
HomeTrust Bancshares (HTBI) in Asheville, N.C., earlier this month bought United Financial of North Carolina, a municipal lease finance company. Opus Bank (OPB) in Irvine, Calif., formed a public finance division last summer after hiring an executive from Umpqua Holdings (UMPQ).
Municipal lending is gaining broader traction. The number of municipal loans on banks’ book increased by 10% over the first nine months of 2016, to $169 billion at Sept. 30, based on data from the Federal Deposit Insurance Corp.
Government finance can benefit banks in several ways, industry experts said.
Loans to municipalities typically have better credit quality compared to private-sector loans and they provide a way to diversify beyond areas such as commercial real estate. Those relationships could also pave the way for banks to bring in more municipal deposits, which could have greater importance in a rising interest rate environment.
“It’s a new opportunity to generate quality assets for the bank,” Becker said.
Municipal loans, however, tend to have lower yields compared to other types of credits, said Jerry Johnson, a former chairman and CEO of Mercantile Bancorp in Grand Rapids, Mich.
“We never made a municipal loan,” Johnson said. Publicly traded banks “live and die by analysts’ estimates, so return on assets and equity are very important.”
First Internet found a banker with extensive experience in the municipal finance field.
Dusing previously spent 24 years at City Securities, an Indiana investment firm, where he focused on public finance. He cut ties with the company after it sold in September to Stifel Financial (SF).
While this is its first formal foray into public finance, First Internet has made municipal loans in the past. At Sept. 30, the portfolio had $8.1 million of loans, or less than 1% of the company’s $1.2 billion in total loans, based on FDIC data.
Becker said the municipal book was built on an ad hoc basis as lenders came across deals for fire trucks, garbage trucks and other heavy equipment used by local governments in the course of their normal commercial lending activities.
Dusing now must boost that number, though he has largely been given autonomy when it comes to charting a course. Specific goals and strategy for the municipal operation are “TBD,” Becker said.
“He’ll take it to whatever level he can,” Becker said. “He’s certainly got the skill set.”
Dusing plans to leverage his “experience and network of investors, public finance professionals and financial advisors,” to expand the business, First Internet said in its release announcing his hiring.
BY SOURCEMEDIA | MUNICIPAL | 01/12/17 07:18 PM EST
By John Reosti
Although not intended to be classics of literature, we have found tales of two municipalities and their Chapter 9 bankruptcies. One was warm and prosperous and on the West Coast, whose housewives we have followed in the age of reality TV. The other was from a grittier place in the midwest with industrial gothic scenes and rappers who have captured its spirit. Please join us as we discuss the post Chapter 9 filing bond disclosures of Orange County, CA and the City of Detroit.
Please click here for video.
The purpose of this podcast is to briefly compare and contrast a couple of examples of primary market disclosure for securities offerings made subsequent to the respective Chapter 9 bankruptcy filings by two of the largest municipal issuers- Orange County, California and the City of Detroit.
The two bankruptcies are similar insofar as they both involved large general purpose governments and were high-profile.
The two bankruptcies and the related securities offerings which we will discuss were notably different in terms of timing (separated by about twenty years) and in the nature and timing of the causes that led to the bankruptcies.
Moreover, they are also notably different in that the Orange County example occurred before the County emerged from bankruptcy whereas Detroit had completed its bankruptcy case prior to the reoffering memorandum examined.
Part of the purpose of our podcast is to examine the impact on disclosures made to the markets when these issuers tried accessing the public markets after Chapter 9 filings.
A review of these issuers’ disclosures may also be helpful context given a trend by many issuers in the municipal securities market toward greater disclosure about municipal bankruptcy notwithstanding that a Chapter 9 filing may be remote for the vast majority of such issuers.
We will turn some attention initially to a discussion of some points about Chapter 9.
Chapter 9 refers to the provisions of the Federal Bankruptcy Code which address the process where municipalities (which includes cities, counties and other entities) can seek protection under the bankruptcy laws through a voluntary filing.
Chapter 9 is relatively rare and although it draws upon other provisions of the federal bankruptcy code, such as Chapter 11 relating to reorganization, it has certain unique features.
For purposes of our discussion, it is helpful to keep two unique factors in mind. First, there is no involuntary filing under Chapter 9 initiated by creditors. Second, Chapter 9 does not have a liquidation concept. Chapter 9 presumes that a municipal entity will need to continue to operate and provide public services.
Chapter 9, even apart from Detroit, has taken on increased attention in recent years, particularly since the financial crisis from 2008.
The Orange County, California bankruptcy from the mid-1990s is remarkable in a number of aspects. First, it involved a large issuer in a very prosperous area. The bankruptcy was a surprising event not foreseeable based on a normal examination of the County’s demographics, economy and tax base. The bankruptcy was also notable given its suddenness. Also, noteworthy is the relatively short time period before Orange County was able to return to the capital markets. In fact, as we will discuss further, Orange County was able to undertake a public bond offering while many uncertainties still existed during its bankruptcy case.
At a very high level, the Orange County bankruptcy can be summarized as stemming from an adverse turn in the County’s investment pool which led to staggering losses. The County, through its popularly-elected Treasurer, had made ultra vires investments in derivatives and effectively had wagered on short-term interest rates remaining low. An increase in rates by the Federal Reserve Bank in late 1994 precipitated losses. The County’s investment pool, after unwinding a number of positions to manage the risk of further losses incurred a total loss of approximately $1.7 billion, $600 million of which was for the County itself (with the remainder related to other County entities, such as local governments and school districts).
The City of Detroit’s bankruptcy, filed in the summer of 2013, although involving a large general purpose governmental issuer was quite distinct from Orange County. The circumstances which gave rise to the bankruptcy were developing over a much longer period of time, arguably several decades, and could not be easily attributable to a single series of events or policy decisions.
It is also arguably the case, that even if the City, with the benefit of hindsight, had made the best policy decisions over the years, the City, if not facing Chapter 9, would have been under severe fiscal stress due to economic and demographic changes (e.g., loss of population).
Also in contrast to Orange County, California, and given what we’ve said already, the filing of the bankruptcy itself was not surprising as evidenced by considerable debate and involvement by the State of Michigan prior to the filing.
For purposes of our discussion we looked at one offering document each for Orange County and the City of Detroit.
In the case of Orange County, it was the official statement for $278,790,000 Refunding Recovery Bonds, 1995 Series A, dated June 13, 1995 which were publicly offered.
In terms of timing, Orange County had filed for Chapter 9 on December 6, 1994 and had not emerged from bankruptcy as of the time of the official statement. Consequently, this was a public offering document produced in the midst of a Chapter 9 proceeding.
In the case of Detroit, it was a reoffering memorandum, dated August 19, 2015, for $245,000,000 Michigan Finance Authority Local Government Loan Program Revenue Bonds, Series 2014F (City of Detroit Financial Recovery Income Tax Revenue and Refunding Local Project Bonds).
In terms of timing, Detroit emerged from Chapter 9 bankruptcy on December 10, 2014. Consequently, this was a public offering document produced subsequent to the bankruptcy proceeding.
A small amount of background on the related bonds is helpful for context.
The Orange County bonds were not ad valorem bonds but rather were payable from all lawfully available funds of the County and additionally secured by a pledge of certain motor vehicle license fees collected by the State of California. The bonds were insured and the County elected to participate in an intercept program related to the motor license fees. Moreover, debt service payments on the bonds, so long as the County remained in bankruptcy, were given an “administrative expense” priority treatment over unsecured claims against the County by order of the bankruptcy court.
The Michigan Finance Authority’s bonds issued on behalf of the City of Detroit are secured by, among other things, certain Municipal Obligations issued by the City payable from certain income tax revenues (which are subject to a statutory lien) from a levy of an excise tax on income and a pledge of the City’s limited tax full faith and credit.
The original proceeds from both bond offerings were used for refinancing purposes. In the case of Orange County, warrants were refunded. In the case of Detroit, it was to pay off certain classes of claims and to finance certain reinvestment and revitalization projects. In each case, and what is somewhat unique for general purpose governments, certain reserve accounts were also funded.
One interesting factor related to the disclosure and more precisely, the manner of the offerings, was that neither disclosure document indicated that any sort of investor letter would be required or particularly focused on matters of suitability. In each case, the applicable bonds were offered in $5,000 denominations.
This is likely largely due to certain favorable credit features. The Michigan Authority bonds received an investment grade rating. The County’s bonds were insured by a then triple A bond insurer.
Both of the offering documents included a risk factors type section and addressed the risk of a potential second bankruptcy. This was not addressed so much in the context of identifying and discussing potential sources of further or recurring financial problems but rather more in the context of potential impact in terms of modifications of rights and the impact on the security of holders.
Due to the particular nature of the bankruptcies, the Orange County disclosure spent considerably more time discussing the factors which contributed to the bankruptcy. This is not surprising given that the Orange County bankruptcy was not anticipated and was due to very specific events which were not necessarily tied to underlying economic circumstances. In contrast, Detroit’s fiscal deterioration was something which occurred over a longer period of time and could not be attributed reasonably to isolated events.
Both offering documents devoted substantial attention to recovery plans and governance matters, such as oversight and reorganization, under state law.
Orange County’s disclosure addressed a restructuring of the County Administrative Office including the creation in February 1995 of a new Chief Executive Officer position and the establishment of a Treasury Oversight Committee which was comprised of five citizens “to review the Treasurer’s investments and ensure adherence to stated policies.”
Detroit’s disclosure discussed a nine-member Financial Review Commission created in November 2014, about a month prior to the exit from bankruptcy and went into extensive detail about Michigan Act 436, and the role of the Emergency Manager and the City Council in the budget process, the Michigan Financial Review Commission Act 181 of 2014, and Act 182 which requires the City to adopt a multi-year financial plan subject to Financial Review Commission approval.
A somewhat unique aspect of the Detroit financing is its discussion of statutory liens under the Bankruptcy Code and the explicit discussion that Bond Counsel to the City provided a reasoned opinion that any residual interest in the pledged income tax revenues should be subject to a statutory lien in favor of the holders of the municipal obligations. The disclosure elaborated how bond counsel’s opinion was based on certain “reasoned conclusions” such as that “both pre-deposit and post-deposit liens are created by Act 279 and that the pre-deposit lien created by Act 279 arises automatically under such Act upon the occurrence of “specified circumstances or conditions” which is a term of art in the definition of statutory lien under the Bankruptcy Code.
The Detroit offering memorandum also discussed in detail Act 279’s provision of a statutorily-created trust for the pledged income tax revenues.
Again, it discussed how bond counsel to the City provided a reasoned opinion that the trust would be enforceable in bankruptcy and should not be reachable by general creditors of the City. Again, the disclosure indicated how the opinion of bond counsel was based on certain reasoned conclusions which were briefly outlined in the disclosure.
In terms of take-aways: disclosure is driven in part by the timing of the bankruptcy proceeding (i.e., where the case stands procedurally at the time of the offering document’s disclosure).
For example, in the case of the particular Orange County official statement examined, the posture of various ongoing litigation and settlements were discussed with more prominence than in Detroit where certain settlements (including with bond insurers) were addressed in the City Appendix III.
Disclosure is also impacted by the causes of a bankruptcy which influence the discussion of remedial or preventative steps.
Orange County focused more on telling the front-end story of its bankruptcy than Detroit where the story slowly (and somewhat painfully) unfolded over a long period of time with very extensive attention in the general media.
The Detroit offering document is somewhat unique in public finance in that it has generally been atypical for reasoned opinions (rather than the typical “clean” opinions) to be given in public finance transactions and to be discussed in detail within an official statement or other offering document. The Detroit case is a leading example of increased attention paid to statutory liens (or other provisions that may give bondholders a stronger position vis a vis general unsecured creditors).
Recognizing that there are many other observations that can be added over time, I found it interesting that the risk factor disclosure, did not go into particularly great detail (or analysis) about economic and similar risks facing the City. There was a very high level and general identification of what reasonably seems to be all the key factors set out in a few clear and concise but modest paragraphs captioned “Uncertainty of Future Income Tax Revenue” and “Economic and Other Factors Affecting the Financial Condition of the City”– which took up less than a single page).
The Michigan Finance Authority disclosure, however, did take a forward-looking perspective on disclosure (which is generally not the case in bond issues for local governments that are tax-supported) by including a “Projected Pledged Income Tax Revenue” table that showed the then-existing projections for four fiscal years (through June 30, 2019) which lined up with the four-year scope of the City’s financial plan. The City Appendix III showed a breakdown of the projections over major revenue and expense categories throughout the projection period. I did not find in the Orange County disclosure any analogous use of projections.
Moreover, there was not a significant discussion (or identification) in the risk factors disclosure of the risks that may arise in relation to the somewhat amorphous area of competing claims of retirees and workers against other creditors. This may be due to two reasons. First, are the inherent uncertainties in this area. Second, and I think easier for me to appreciate, is the consideration (and I caution that I speculate) that statutorily created priorities for these bondholders may, in the City’s view, have obviated a need to try to parse out the uncertain landscape when dealing with unsecured creditors in the context of equities towards a municipality’s workers and retirees. The disclosure, however, was very focused on pensions and OPEBs and provided a detailed discussion in the City Appendix III about the nature of the pension and OPEB settlements and how the benefit plans were affected and aligned going forward out of the bankruptcy.
Mark Vacha | Cozen O’Connor
1/10/17
JD Supra Business Advisor
Mayor Rahm Emanuel is pitching Wall Street investors on the latest city borrowing plan, a $1.2 billion package that, like previous versions, pushes hundreds of millions of dollars of debt into the future at higher costs to taxpayers.
The mayor is continuing scoop-and-toss borrowing, which involves paying off old bonds with the proceeds from new ones — a practice akin to taking out another mortgage on a house to pay off the old mortgage, kicking payments down the road. An Emanuel budget spokeswoman said this year marks the last scoop-and-toss bond issue.
The administration also said it’ll be the last time the city will borrow money to pay for a portion of routine legal settlements and judgments, adding millions in interest to what are short-term expenses. Some of that debt will take the form of taxable bonds, which carry higher interest rates. That’s because the federal government doesn’t allow the issuance of tax-free bonds for what are considered yearly operating expenses.
Beyond that, the mayor plans to borrow a to-be-determined amount to cover some of the initial interest payments on the new debt the city is taking out, which adds to the overall cost. It’s the equivalent of taking out a loan to pay the initial interest on a mortgage.
Emanuel inherited the costly borrowing practices, detailed by the Chicago Tribune in its 2013 “Broken Bonds” investigation, from predecessor Richard M. Daley. Emanuel, now on his sixth spending plan, has used the techniques to prop up a sagging City Hall budget. In 2015, the mayor promised to end the costly financial moves by the end of his second term in 2019.
The administration’s plans call for pricing the bonds on Jan. 18-19, when the market will determine the interest rates, and closing on the deal Feb. 1, Emanuel’s Chief Financial Officer, Carole Brown, said in a web-based “roadshow” used to pitch the bonds. City finance officials also plan to meet with investors in Chicago, Boston and New York before the bonds are sold to make further pitches, a common tactic Chicago and other major cities have begun to use in recent years.
The city is likely to pay relatively high interest rates because municipal bond market rates recently increased, and continuing financial problems at Chicago Public Schools and the state of Illinois has investors concerned, said Matt Fabian, a partner at Concord, Mass.-based Municipal Market Analytics.
Fabian also said buyers would look more favorably on city debt if it stopped using “budget gimmicks” like scoop-and-toss and borrowing to pay initial interest payments “instead of just talking about how they’re going to stop.”
But he added that “the municipal market has come to see and talk about Chicago as a bit of a success story” after Emanuel set in motion plans to contribute hundreds of millions of additional dollars a year to its pension plans for police officers, firefighters, city workers and laborers.
At Emanuel’s urging, the City Council in recent years increased telephone fees for emergency service, dramatically increased property taxes and enacted a new tax on city water and sewer service to help fund higher contributions to the four pension funds.
But there’s uncertainty about how the city will come up with hundreds of millions of additional dollars in the early- to mid-2020s that will be needed to make even higher contributions to those funds in an effort to prevent them from running out of money. And the plans for the municipal workers’ and laborers’ funds have yet to be approved by a state government mired in partisan gridlock.
Nevertheless, Wall Street bond rating agencies have changed the city’s debt outlook from negative to stable based on the efforts underway to stabilize the pension funds, all of which were at risk of going broke in the 2020s even if the city’s general bond ratings remain low. That could result in the city paying lower interest rates than they otherwise would have when the bonds go to market this month.
Richard Ciccarone, president and CEO of Merritt Research Services, said interest rates also could go higher because of “intangible” factors not directly related to city finances, like a recent “60 Minutes” segment on Chicago’s spiking violent crime rate. “Those kind of things don’t help, even though they are very indirectly related to finance,” he said.
But Ciccarone praised the mayor’s efforts to fix the pension systems, reduce the city’s annual budget funding gaps, rely less on short-term borrowing and beef up city budget reserves. “The city moved forward in 2016 on making real incremental progress,” he said.
The City Council signed off last year on the latest round of borrowing, but the scoop-and-toss total is about $100 million higher than Emanuel finance aides told aldermen was in the works. The dollar amount went up because plans to refinance about $100 million in debt to save money were no longer possible after a recent rise in municipal bond interest rates, budget spokeswoman Molly Poppe said. The city still plans to refinance about $25 million.
Some specifics about the $1.2 billion borrowing plan:
•$440 million in scoop-and-toss borrowing, a long-term delay tactic that adds millions of dollars in interest costs to be paid by taxpayers over the next 20 years.
•About $225 million to pay legal settlements and court judgments. Other cities with sounder finances pay such costs without borrowing that adds millions of dollars to the taxpayer tab.
•About $405 million for construction projects and equipment, including new police vehicles.
Poppe defended the city’s plans to borrow money to cover some of the initial interest costs, saying that’s “common practice” in cases where cities don’t anticipate the construction projects financed by the borrowing to be completed for a while. That way, “debt service expense does not begin until the project is operational and benefiting communities,” she said.
Laurence Msall, president of the nonpartisan Civic Federation budget watchdog group, lauded Emanuel’s pledge to end borrowing for scoop-and-toss and legal settlements and judgments, but expressed some skepticism as to whether the mayor could keep the promise.
“Even if the city is able to end most borrowing for operations by 2019, it faces significant financial challenges that could make it difficult to maintain its commitments in the future,” said Msall, who called on Emanuel to “present a plan” for covering future debt service payments and paying off legal settlements and judgments.
by Hal Dardick
January 9, 2017
Chicago Tribune
hdardick@chicagotribune.com
In December, President Barack Obama signed the Water Infrastructure Improvements for the Nation (WIIN) Act into law. The bill authorizes $170 million for communities facing drinking water emergencies, including funding for Flint, Mich., to recover from the lead contamination in its drinking water system.
The legislation also authorizes other vital water projects across the country to restore watersheds, improve waterways and flood control, and improve drinking water infrastructure.
The WIIN Act is a measure that includes the Water Resources Development Act (WRDA) of 2016, in addition to provisions to improve drinking water infrastructure around the country, address control of coal combustion residuals, improve water storage and delivery to help drought-stricken communities, address federal dam maintenance backlogs, and approve longstanding water settlement agreements for the benefit of taxpayers and Native Americans.
The WIIN legislation also includes both short-term and long-term provisions related to addressing the continuing drought in California. In the long-term, it invests in a number of water projects to promote water storage and supply, flood control, desalination and water recycling. These projects will help assure that California is more resilient in the face of growing water demands and drought-based uncertainty.
The WIIN legislation, S. 612, along with a four-month continuing resolution (CR) to keep the federal government operating through April (which had already been signed by the president earlier in December), will provide $100 million for lead removal projects in Flint through the Drinking Water State Revolving Fund and another $20 million to EPA to begin issuing loans under the Water Infrastructure Finance and Innovation Act (WIFIA).
The money for WIFIA has been available since funding was made available in the original legislation creating the program in 2014. In previous fiscal years, Congress had only appropriated money for the U.S. Environmental Protection Agency (EPA) to set up the program. However, the SRF money and other funds to help with Flint’s lead crisis had to be authorized before they could be released.
Of the $20 million appropriated for WIFIA, $3 million is to be used for administrative purposes, leaving $17 million to seed loans. WIFIA leverages federal dollars so that for every dollar Congress appropriates, $50 to $60 is expected to be loaned out. That means up to $1.02 billion could be available for loans, according to the AWWA, which helped craft the WIFIA program.
“AWWA is thankful to all those members of Congress and water sector partners who championed WIFIA over the past several years,” said Tracy Mehan, AWWA executive director of government affairs. “With more than $2 trillion needed to repair and expand water and wastewater infrastructure in the coming years, water utilities needed a smart new finance tool to help communities pay for large, critical water projects. Funding WIFIA is a tremendous step forward as we confront the nation’s water infrastructure challenge.”
Meanwhile, the CR will also extend most other federal department and agency budgets at their FY2016 levels through April 28, at which time Congress must finalize an FY2017 spending plan for the federal government.
WIFIA is actually authorized to receive $35 million in 2017 under the law creating the program in 2014. But under the WIIN Act, WIFIA will be funded at the $20 million level as part of Congressional negotiations for moving WIIN/WRDA and the CR forward. In all, the legislation provides:
• $100 million for making capitalization grants to Flint under the Drinking Water State Revolving Funds. These funds will address lead or other contaminants in drinking water, including repair and replacement of lead service lines and public water system infrastructure;
• $20 million for Water Infrastructure Finance and Innovation (WIFIA) grants to finance water infrastructure efforts, including those to address lead and other contaminants in drinking water systems;
• $20 million for a Lead Exposure Registry to collect data on lead exposure and an Advisory Committee to review programs, services, and research related to lead poisoning prevention;
• $15 million in additional funding for CDC’s Childhood Lead Poisoning Prevention Program to conduct screenings and referrals for children with elevated blood lead levels; and
• $15 million in additional funding for HRSA’s Healthy Start Program to reduce infant mortality and improve perinatal outcomes.
“We were hoping WIFIA would receive the fully authorized amount of $35 million,” AWWA CEO David LaFrance said in a press release. “But this is a short-term spending bill, and it is a positive step. Still, there is more work to do, and AWWA will keep working for additional funding to address the country’s water infrastructure needs. Because WIFIA is a loan program, it strikes just the right balance between federal assistance and local responsibility.”
BY TRENCHLESS TECHNOLOGY STAFF ON JANUARY 12, 2017
DALLAS – President-elect Donald Trump will unleash the potential of private investments and use innovative financing tools to rebuild the nation’s transportation networks, Transportation Secretary-designate Elaine Chao told lawmakers at her Senate confirmation hearing on Wednesday.
“As we work together to develop the details of President Trump’s infrastructure plan, it is important to note the significant difference between traditional program funding and other innovative financing tools, such as public-private partnerships,” she said in her opening remarks before the Senate Commerce, Science and Transportation Committee.
“In order to take full advantage of the estimated trillions in capital that equity firms, pension funds, and endowments can invest, these partnerships must be incentivized with a bold new vision,” Chao said.
The Trump administration will look at how to remove current legal and regulatory roadblocks to P3s, she said.
“Private investors are encouraged when they see a bold vision and this president has a bold vision,” Chao said. “At the very minimum we need to do away with these impediments.”
The new administration will form a task force to look at a variety of financing options for infrastructure projects, she said.
“The government does not have the resources to address all the infrastructure needs in our country,” Chao said.
Trump released a 10-year, $1 trillion infrastructure proposal in late October that relies on $137 billion of tax credits to attract private investments in transportation and other infrastructure projects.
She and Trump would support more direct federal funding for infrastructure beyond what is in the five-year Fixing America’s Surface Transportation Act adopted in late 2015, Chao said.
“The Highway Trust Fund is in bad shape,” she said. “The gasoline tax, which provides 90% of the HTF’s revenues, is not as lucrative as it once was.”
Restoring the HTF to financial health before the FAST Act expires will be one of Trump’s top issues, Chao said.
“The fund will be broke in 2021 unless we do something,” she said. “It’s a huge issue.”
Pressed to provide details on the potential for more direct federal funding by Sen. Bill Nelson, D-Fla., the ranking Democrat on the panel, Chao said she would give the committee a progress report soon after Trump is sworn in.
“I will try for a report in 30 days but I can’t promise that,” she said. “I can promise that there will be continuous and constant dialogue with Congress on this matter. We cannot do it alone.”
Sen. Deb Fischer, R-Neb., said at the hearing that she will file a transportation funding bill in the coming weeks. Fischer in 2015 proposed a national infrastructure bank capitalized with $30 billion from tax revenues on repatriated corporate overseas earnings.
Committee chairman Sen. John Thune, R-S.D., said he expects the committee to approve Chao’s nomination on Jan. 20, the first day of the Trump presidency.
Rep. Sam Graves, R-Mo., said at an aviation industry gathering on Tuesday that the proposed $137 billion of tax credits in the proposal would not be enough to bring in the amount of private investments in infrastructure that Trump is seeking.
“President-elect Trump has got a massive infrastructure bill that he wants us to work on,” said Graves, who chairs a House Transportation and Infrastructure Committee panel on highways and transit. “He wants to spend $1 trillion. I do not think it will be that big. We just simply can’t afford it.
“And we also have to figure out a way to pay for it,” he said. “We can’t do it all through public-private partnerships that the president-elect is talking about.”
The Bond Buyer
By Jim Watts
January 11, 2017
CHICAGO – Chicago Mayor Rahm Emanuel isn’t happy with Moody’s Investors Service, so he’s trying to make the rating agency go away.
Emanuel’s administration disclosed Tuesday that the mayor formally asked Moody’s to withdraw all of the city ratings. The disclosure came ahead of investor meetings set for this week.
Moody’s declined, according to a city official.
Moody’s downgraded the city’s GO bonds to junk-level Ba1 in May 2015. The rating remains there today, with a negative outlook.
Three other rating agencies assign Chicago ratings in the lowest investment-grade tier of triple-B.
In a stinging letter dated Dec. 8 to Moody’s president and chief executive officer Raymond W. McDaniel Jr., Emanuel accused the rating agency of failing to recognize the city’s strides on factors identified by Moody’s as needed to win an upgrade. The city cited factors such as raising its pension payments to actuarially required contributions and increasing revenue to fund pension obligations.
“With each rating action or market comment, Moody’s instead introduces new and sometimes unrelated factors to justify its negative view of the city’s credit,” Emanuel wrote. “All the while, measurable progress by the city to confront the fiscal challenges do nothing to impact our rating or our outlook.
“It has become increasingly clear that Moody’s rating methodology and agenda are far from objective and independent…your current rating does not accurately reflect the city’s credit or our ability to pay debt service when due,” the letter continued.
If Moody’s does not grant Emanuel’s request, the mayor said it should be made clear that any opinions from Moody’s are based solely on publicly available information.
The city has not sought Moody’s ratings on new issues for more than two years.
Moody’s rates the city’s general obligation, sales tax and motor fuel bonds at Ba1 with a negative outlook. The city’s GOs were already trading at speculative-grade levels before Moody’s downgraded them to junk in 2015. Moody’s rates the city water and wastewater debt in the lowest investment grade Baa tier and airport debt in the single-A category.
The city’s 10-year GOs have traded in recent months at the junk-level spread of 250 to 300 basis points to the Municipal Market Data’s top-rated benchmark, and its yields on tax-exempt sales over the last year and half have landed within that range. The BBB benchmark on Tuesday was at 3.17%, a 95 basis point spread to the AAA rate. The city carries ratings of BBB-minus and BBB-plus from the three other rating agencies.
The spread on its 10-year paper hitting 200 basis points in November 2014, six months before the Moody’s downgrade, dropping some and then rising to 250 basis points in April, a month before the downgrade. After the downgrade, spreads steadily climbed upward, hitting 300 basis points. That marked a doubling of the 145 basis point spread on its 10-year in a primary market outing in March 2014.
A speculative grade spread is a moving target, said one market participant. Currently, a weak investment grade name should price in the mid-to-high 100s, one market participant said. Anything at 225 basis points is considered high yield, another trader said. Another said anything over 200 falls into the high yield category.
“This shows that the market is appropriately skeptical about the other three ‘investment grade ratings,’ since much of Chicago’s near-term outlook still hinges on what happens in Springfield. It’s certainly outrageous for Mayor Emanuel to try to bully Moody’s into withdrawing its rating and kudos to Moody’s for sticking to its ‘process,'” said Triet Nguyen, head of public finance credit at NewOak Fundamental Credit. “We believe there’s no imminent risk of default at this time, just ‘spread risk’ or underperformance risk.”
Market participants have said the city could see yield penalties narrow a bit if it loses its junk status, but they may not reach investment grade levels. One participant suggested it’s more about the city shedding the taint of the label or the risk of further negative headlines from a possible downgrade.
Moody’s spokesman David Jacobson said in response to a request for comment that “Moody’s has a process for handling requests from issuers to withdraw their ratings and follows that process when such requests are made” and it does not comment on potential future rating actions.
City finance spokeswoman Molly Poppe said Moody’s declined to withdraw the ratings.
The timing of the letter last month was aimed at staving off potential negative commentary or action ahead of the city’s $1.16 billion GO sale next week, even though Moody’s was not asked to rate the bonds.
“The point here is that the mayor is taking steps to protect taxpayers. As you know, investors do their own analysis on whether they are going to buy the city’s bonds, but they rely on rating agencies to extract yield,” Poppe said.
Moody’s in recent reports has made clear that Chicago’s path to investment grade requires improved pension funding status. “The city’s unfunded pension liability would need to begin to stabilize and decline. The actions the city has taken to date have only enabled their pension problem to get worse at a slower pace,” Moody’s has said.
The city has put tax-supported funding streams in place to raise contributions to its four pension plans that carry $33.8 billion of net pension liabilities, but payments based on actuarial requirements don’t kick in until 2021 and improved funded status in a long way off.
In a November report, Moody’s listed factors that could lead to an upgrade including: rapid economic and revenue growth; further budgetary adjustments that accommodate pension contributions sufficient to stop growth in unfunded pension liabilities; and operational stability and improved liquidity at Chicago Public Schools. None has occurred.
When it downgraded Chicago to junk, Moody’s described as factors that could lead to an upgrade or stable outlook city or state actions that halt the growth of the city’s unfunded pension liabilities and revenue growth and/or reductions in other operating expenditures that enable the city to accommodate increased pension costs into annual operating budgets. The city would argue that it has met the second criteria.
Jacobson countered the city’s assessment that the rating agency had wavered.
“We do not advise any issuer on how to improve their credit rating. In our November 7 report affirming Chicago’s Ba1 rating and negative outlook, we did note the 2016 pension reforms will help increase pension contributions and the city’s economy and liquidity remained strong. However, we also noted the unfunded pension liabilities will continue to increase for several more years, and the deteriorating credit of the Chicago Public Schools (B3/negative) now poses new risks to the city that did not exist earlier.”
Moody’s dropped the city’s rating to junk after the Illinois Supreme Court struck down state pension reforms. The opinion made clear the difficult path ahead for the city to solve its pension crisis. It marked a hard and steady fall from the Aa3 rating Emanuel inherited in 2011 after Moody’s began giving greater weight to pension status.
The city faced further ratings fallout from other rating agencies because the drop to speculative grade triggered defaults and termination events on bank products. Still, the city held on to its other investment-grade ratings.
The ratings discrepancies sparked a spirited market debate over the role of rating agencies and how closely they represent investor sentiment.
“No local government’s split credit ratings have—in recent memory—spurred as passionate of a debate as Chicago’s,” Municipal Market Analytics partner Matt Fabian wrote in mid-2015. “It strikes us that underlying this debate may be a discrepancy between what ratings are and what the industry ideally wants them to be.”
After the downgrade, Emanuel delivered a stinging rebuke, highlighting the disparity in ratings, calling Moody’s out of step and accusing it of trying to force the city’s hand on increasing property tax rates.
Market chatter over the downgrade was underscored by Moody’s release six days later of a special report to address “questions we are receiving concerning last week’s downgrade.” Moody’s senior analyst Rachel Cortez then took center stage at a long-scheduled discussion of city finances hosted by the City Club of Chicago.
“To us it was pretty clear that benefit reductions under any circumstances are impermissible and in violation of the Illinois constitution,” Cortez said. The rating agency turned out to be right as pending city pension reforms were also later shot down.
Some believed Moody’s acted too swiftly while others said the market already perceived the credit as junk. The junk-level downgrade also shone a light on default risks. Moody’s sought to tamp down concerns, highlighting its analysis that Ba-level credits show just a 5% likelihood of default in the coming years.
The Bond Buyer
By Yvette Shields
January 11, 2017
S&P Global Ratings’ 2017 outlook for business conditions and credit quality across the transportation sector is stable-to-positive depending on the subsector. Specifically, we have a stable outlook across most subsectors with a positive outlook on the toll road and bridge sector as we anticipate traffic levels to grow faster than baseline GDP and the expansion of tolling technology and toll rate increases potentially allow for improved revenue growth. Exposure to disruptive trade or tariff policies, expanded capital programs, or spending by issuers without a commensurate increase in revenue sources, potential for inflation in construction labor costs, as well as industry dynamics in the maritime sector, we view as overall risks to our outlook. We also anticipate movement by policymakers toward a federal infrastructure investment program with varying impacts, though the funding sources and form of any stimulus under the Trump Administration and the new Congress remains unknown.
Key drivers for the transportation sectors continue to be economic and demographic trends that influence movement of people and goods, fuel prices that serve as a cost input for transportation companies and influence individual travel behavior, competitive factors that affect the business profiles of infrastructure providers, and federal transportation policies that facilitate investment by state, regional, and local governments. A fundamental credit feature in support of S&P Global Ratings’ rated universe is the ability of public transportation infrastructure providers to set fees and collect their own revenues derived largely from users of their enterprises.
11-Jan-2017
A roundup of money (and other) news governments can use.
GOVERNING.COM
BY LIZ FARMER | JANUARY 13, 2017
Last month, in a strong display of bipartisanship in an otherwise tense post-election political climate, Congress passed the Water Infrastructure Improvements for the Nation Act (“WIIN” or the “Act”).1 President Obama signed the bill into law on December 16, 2016.2
The success of WIIN was fueled by bipartisan consensus for the improvement of the nation’s water infrastructure and the need to provide federal support to Flint, Michigan and similar communities that have recently been affected by water contamination crises.
This client alert is an update to our two-part article published last October outlining the financing options for US water infrastructure improvements, Funding and P3s for Water Infrastructure Projects3, which described the bills passed by the Senate and the House of Representatives that formed the basis for WIIN. WIIN was the result of the conference committee between the two houses that followed the presidential election.
Below we provide a brief summary of certain provisions of the Act that may be of particular interest to private sector entities pursuing investments in the water sector, including investments through public-private partnerships (or P3s).
WIFIA
As discussed in our October article, the Water Infrastructure Finance and Innovation Act (“WIFIA”) was passed in 2014 and authorized as a five-year pilot program. However, no appropriations were provided for WIFIA other than amounts to fund start-up costs at the US Environmental Protection Agency (“EPA”), which will administer the program.
The new law changes that – WIIN includes $20 million in budget authority to WIFIA, with a corresponding appropriation being made in a subsequent continuing resolution passed by Congress in December.4 No more than $3 million of such amount may be used for administrative purposes. While this amount is less than the $70 million amount originally proposed by the Senate in its bill (which itself reflected only part of the $80 million authorized for the program over its first three years under the 2014 legislation), it is nonetheless significant because funds are now available to be loaned out by EPA for eligible projects. EPA estimates that its $17 million in budget authority could support more than $1 billion in credit assistance and more than $2 billion in water infrastructure investment.5
The new law makes other changes and clarifications to the WIFIA program that could be useful to eligible borrowers, which include governmental entities such as municipal water authorities as well as private sector entities. WIIN expands WIFIA eligibility to projects that prevent, reduce, or mitigate the effect of drought. The Act further specifies that financing fees can be covered under loan amounts and clarifies that project costs incurred before a WIFIA loan is received can be credited towards the 51 percent of project costs that must be provided by sources other than WIFIA loans.
The Act also clarifies that Congress intends for WIFIA appropriations to be in addition to, and not instead of, those made to the Clean Water State Revolving Fund (the “CWSRF”) and the Drinking Water State Revolving Fund (the “DWSRF” and, together with the CWSRF, the “SRFs”). This statement, along with the additional appropriations to the SRFs described below, should help assuage the fear of stakeholders who have expressed the concern that WIFIA funding would result in the downsizing of the revolving loan funds. Finally, consistent with the Act’s focus on Flint aid (described further below), it states explicitly that WIFIA eligible projects may include those to address lead and other contaminants in drinking water systems.
Flint Aid
A critical motivating factor for WIIN’s passage was the desire among lawmakers on both sides of the political aisle to support Flint and other communities affected by contaminated drinking water problems. These problems, which the Flint crisis made more visible in 2016, have focused attention on the poor condition of the nation’s water infrastructure. In response, the Act authorizes $100 million in capitalization grants to the DWSRFs to fund improvements for public water systems with lead exposure and other drinking water emergencies. An additional $50 million is authorized for various lead-related health programs. These amounts were appropriated in the December continuing resolution.
In order to mitigate future drinking water contamination issues, WIIN authorizes $150 million annually over the next five years for various grant programs to help local public water systems and communities with lead reduction projects and related assistance.
“Buy America”
WIIN maintains a one-year “Buy America” provision for iron and steel on public water system projects funded by the SRFs, consistent with existing law. In the run-up to passage, several prominent Democrats fought unsuccessfully to make such provisions permanent.[6] The Democratic position may nevertheless have support from the incoming Trump administration, which has espoused a “Buy American and hire American” policy since the November election.
Army Corps of Engineers Projects
Since passage of the last water legislation in 2014, the Army Corps of Engineers (“ACE”) has made recommendations to Congress for water infrastructure investment projects across the country. Consistent with the proposals of both the Senate and the House of Representatives, WIIN authorizes ACE to carry out certain of these recommendations, which total 30 new projects, as well as eight modifications to existing projects. These projects, which are subject to future appropriation, range across ACE’s major mission areas, including navigation, flood risk management, hurricane and storm damage risk reduction, and ecosystem restoration. Seeking to address the backlog in ACE projects, the Act also deauthorizes inactive projects that have not received funding and deauthorizes portions of other active projects that are no longer needed. WIIN also authorizes ACE to conduct feasibility studies for 30 proposed new water projects.
California Drought Aid
In addition to degraded systems, communities across the country—both coastal and inland—have significant water scarcity issues, spurred by both human and natural conditions such as overuse or drought. California, for instance, is in its sixth straight year of drought7 and, by at least one account, has its worst drought conditions in 1,200 years.8
WIIN directs the Departments of Commerce and the Interior to help increase the water supply by expediting review of proposed projects and drought reduction measures, while regulating the amount of water that can be diverted to farms and homes so as not to damage salmon stocks and other wildlife. The Act also authorizes the use of funds from the prepayment of federal water contracts for the expansion of water storage facilities and authorizes other amounts to be applied to water desalination projects and a recycling grant program.
Conclusion
WIIN is a significant development for water industry stakeholders. The bipartisan support for the passage of the Act, and President-elect Trump’s prioritization of national infrastructure improvements, suggest that WIIN will not be threatened by the upcoming change in administration.
The Act’s political legacy will likely be shaped by the impact of Flint aid and the related lead reduction programs. From an investor’s perspective, the appropriation of funds to WIFIA is an important step forward, as it unlocks a program which essentially has been stillborn since its establishment two-and-one-half years ago. Similar to TIFIA in the transportation sector, WIFIA’s low-cost, long term financing is likely to attract interest from local water authorities, and private entities contracting with them, seeking to finance greenfield or brownfield water infrastructure projects. To the extent WIFIA funding remains available over the longer term, it could also foster the development of new projects. In this regard, it will be important for the program to demonstrate some early successes in 2017 in order to lay the groundwork for further appropriations.
Special thanks to Shearman & Sterling associate David Ullman for his contributions to this client publication.
Footnotes
1 Water Infrastructure Improvements for the Nation Act, Pub. L. No. 114-322 (2016). The Senate vote, on December 10, 2016, was 78-21 and the House vote two days earlier was 360-61.
2 Statement by the President on the Water Infrastructure Improvements for the Nation (WIIN) Act (Dec. 16, 2016), https://www.whitehouse.gov/the-press-office/2016/12/16/statement-president-water-infrastructure-improvements-nation-wiin-act.
3 Paul J. Epstein, Funding and P3s for Water Infrastructure Projects, Law360 (Oct. 17-18, 2016), http://www.shearman.com/en/newsinsights/publications/2016/10/epstein-authors-article-funding-partnerships-water.
4 Further Continuing and Security Assistance Appropriations Act, 2017, Pub. L. No. 114-254 (2016).
5 US Environmental Protection Agency, Learn About the WIFIA Program, https://www.epa.gov/wifia/learn-about-wifia-program (last visited Jan. 2, 2016).
6 Brody Mullins & Kristina Peterson, Bill’s ‘Buy America’ Provision Sets Up Potential Clash for GOP, Donald Trump, Wall St. J. (Dec. 2, 2016), http://www.wsj.com/articles/water-bills-buy-american-provision-sparks-some-gop-concerns-1480709387.
7 Paul Rogers, 2016 in Review: California drought eased, but it’s not over, Mercury News (Dec. 26, 2016), http://www.mercurynews.com/2016/12/26/fire-and-rain-california-drought-eased-but-not-over/.
8 Angela Fritz, Study: California drought is the most severe in at least 1,200 years, Washington Post (Dec. 4, 2014), https://www.washingtonpost.com/news/capital-weather-gang/wp/2014/12/04/study-california-drought-is-the-most-severe-in-at-least-1200-years/.
Article by Paul J. Epstein
Last Updated: January 9 2017
Shearman & Sterling LLP
The content of this article is intended to provide a general guide to the subject matter. Specialist advice should be sought about your specific circumstances.
Bank of America Merrill Lynch and Public Financial Management Inc. widened their leads in municipal market rankings in a record-setting year for issuance.
BAML closed 2016 with a par amount of $65.92 billion in 518 issues, or 15.6% market share, compared to $49.27 billion in 470 issues or 13.1% market share in 2015, to top the underwriter rankings, according to data from Thomson Reuters. PFM finished 2016 credited with $73.30 billion in deals, or 20.8% market share, up from the $62.42 billion and 20% market share for 2015.
For the year, BAML was the lead manager on four deals that were greater than $1 billion and 16 deals that were between $500 million and $1 billion. Among the largest transactions that BAML ran the book on were: the New York State Urban Development Corp.’s $1.65 billion sale in March; The state of Illinois’ $1.30 billion in October; The commonwealth of Massachusetts’s $1.11 billion in March; and the City of Chicago’s $1.01 billion in November.
Overall, the top firms combined for a total par amount of $423.88 billion in 12,271 transactions in 2016, compared with $377.64 billion in 12,076 transactions during the same period last year. For the fourth quarter alone, BAML accounted for $16.55 billion in 107 deals.
Citi finished 2016 in second place with $48.89 billion in 529 deals, good for 11.5% market share and an improvement from the $43.50 billion in 486 deals the firm handled in 2015. Citi was also in second place for the fourth quarter, with $10.97 billion in 95 deals.
For the year, Citi was the lead manager on two deals greater than $2 billion and two deals bigger than $1 billion.
Although the largest deal the bank worked on was $2.70 billion from the state of California, the most talked about deal of the year was $2.41 billion from the New York Transportation Development Corp. of special facilities bonds, Series 2016A and B, LaGuardia Airport Terminal B Redevelopment Project, subject to alternative minimum tax.
“We expect to see more discussions around public-private partnership and how they can play a role in infrastructure,” said David Brownstein, Head of Public Finance at Citi. “It’s important to figure out how to maintain important projects while also coming up with creative ways to get other needed projects done.”
JPMorgan finished in third for the year with $41.51 billion in 402 transactions, which compares to the $41.68 billion in 392 transactions the firm completed in 2015. For the fourth quarter alone, JPM finished in fourth place with $8.84 billion span across 80 deals.
“Market volatility post-election made for a challenging environment and we are very appreciative of the many issuers that put their trust in J.P. Morgan to lead them through that tumultuous period,” said Jamison Feheley, JPM’s head of public finance banking. “We are also very proud of the many value-added solutions we were able to deliver for clients this quarter and throughout the year that aren’t reflected in the traditional league table.”
Feheley said JPM expects a more challenging year ahead, with new issue volume expected to drop following a record year as uncertainties come into play with a new administration in Washington.
Morgan Stanley concluded the year in fourth place with $33.89 billion in 388 deals, up from $31.68 billion in 431 deals in 20155. Morgan Stanley finished the fourth quarter in third place with $10.63 billion in 93 transactions.
Wells didn’t lose any ground in terms of rankings, even after a fake account scandal that prompted issuers including the state of California, the commonwealth of Massachusetts, the state of Ohio and the city of Chicago to curtail business with the firm. Wells Fargo rounds out the top five for the second year in a row, finishing the year with $26.09 billion, up from $24.83 billion a year earlier. Wells had a par amount underwritten of $5.03 billion for the fourth quarter alone.
RBC Capital Markets came in sixth place with a total of $23.61 billion for the year, followed by Stifel with $17.82 billion, Raymond James with $17.77 billion, Barclays with $17.06 billion, Piper Jaffray with $16.42 and Goldman Sachs with $15.80 billion.
Financial Advisors
Public Financial Management increased its par amount and market share from the previous year. For the fourth quarter alone PFM finished with $14.95 billion.
“PFM continues to focus on helping our clients achieve a level of strong financial stability that enables them to enter the market with a strong credit posture both to borrow for vital infrastructure projects and to refinance debt for savings,” said John Bonow, managing director and chief executive officer of PFM. “While the market in 2016 was conducive to economic refundings through much of the year, the recent uncertainty about federal economic policies may persist well into 2017.”
Bonow said expectations are growing that increased federal assistance to spur infrastructure investments may materialize soon and that the market seems to have found some footing in terms of interest rate stability. Volume may be strong again this year, he said, although it’s unlikely to rise to another record.
“We continue to focus on being a strong, independent voice for our clients, providing them with the information and analysis needed to make the major financial decisions. We are deeply appreciative of the trust so many clients have put in us, which has enabled our mutual success,” he said.
Hilltop Securities came in second with $34.96 billion after finishing in second in 2015 with $32.74 billion. Public Resources Advisory Group was right behind, finishing in third with $33.49 billion.
After the top three, the gap widens. Acacia Financial Group wound up in fourth place for the year with $13.78 billion, moving up one spot after finishing in fourth in 2015 with 9.11 billion.
Kaufman Hall & Associates Inc. jumped up into fifth place, after finishing ninth last year. In 2016, the firm had a par amount of $8.55 billion, up from $5.16 billion.
Top Issuers
The state of California was the top municipal bond issuer by par amount in 2016, well ahead of the next biggest issuer. The Golden State issued $8.92 billion in 2016, moving up from second place in 2015 when the state issued $6.38 billion.
“The office has greater responsibilities than just the state’s general obligation bonds. In total we were responsible for selling roughly $21 billion this past year for all state agencies,” said Tim Schaefer, California’s deputy treasurer for public finance. “We are pleased that we had a year of very favorable rates, eventually those refundings will save tax payers $1.8 billion in direct savings and $500 million in public benefits.”
Schaefer said the highlight of the year came in October when the state completed what is believed to be one of the largest competitive sales in more than 25 years. Although it came in three separate sales, they were all under a common plan of finance, which was various purpose.
“In total the combined sale just under $1.7 billion and that is an important size milestone for the state and for the market,” said Schaefer.
The Dormitory Authority of the State of New York finished in second place with $5.92 billion, slipping a bit one year after it finished in first place with $9.02 billion.
Another New York issuer, the Metropolitan Transportation Authority finished in third place with $5.19 billion, up from $3.11 billion in 2015, which was good for eighth place.
Massachusetts came in fourth with $4.83 billion, improving from $2.55 billion, while the New York City Transitional Finance Authority rounded out the top five with $4.75 billion.
The Bond Buyer
By Aaron Weitzman
January 9, 2017
Taylor Riggs, a contributor to Bloomberg Briefs, talks with Joe Mysak about this week’s municipal market news.
Bloomberg
January 12, 2017
The ride-hailing company Uber and local governments often do not play well together. Uber pays little heed to regulation while city officials scramble to keep up with the company’s rapid deployment and surging popularity.
But now, with a new data-focused product, Uber is offering a tiny olive branch to its municipal critics.
The company on Sunday unveiled Movement, a stand-alone website it hopes will persuade city planners to consider Uber as part of urban development and transit systems in the future.
The site, which Uber will invite planning agencies and researchers to visit in the coming weeks, will allow outsiders to study traffic patterns and speeds across cities using data collected by tens of thousands of Uber vehicles. Users can use Movement to compare average trip times across certain points in cities and see what effect something like a baseball game might have on traffic patterns. Eventually, the company plans to make Movement available to the general public.
If urban planners embrace the data, that could work toward a future Uber has long dreamed of, one in which the company’s transportation options are woven into municipal planning.
“Our relationships with cities have typically been uneven, but there are a lot of places around the world where Uber and the cities we operate in have the same goals,” Andrew Salzberg, head of transportation policy at Uber, said in an interview. “We operate better in a world that has policy grounded on data.”
The collected trip data is made anonymous and aggregated, Uber said, which it hopes will assuage user privacy concerns.
That data, Uber said, will most likely be much more reliable than what is typically used by urban planners, many of whom hire third-party agencies to study traffic patterns over time. Often, that data is expensive, and it can be out of date by the time it is analyzed. Uber argues that its data is more reliable because all of its drivers use smartphones equipped with accelerometers and global positioning technology.
One challenge for Uber: improving upon the rocky partnerships it forged in the early, one-off data sharing deals it struck two years ago.
In a widely publicized move in January 2015, Uber announced a deal with the city of Boston in which the company planned to share some anonymous data, with many of the same urban planning aspirations it has today.
But that deal quickly soured. Boston officials said the agreement was not practical for city planning and development because it restricted what agencies the city could share the data with and because the data came only in quarterly batches. Boston city employees also grew frustrated with the lack of useful data being shared and Uber’s seeming lack of understanding of how to deal with city governments.
“The totality of Uber and Lyft drivers in Boston represent what is effectively the addition of another transit line,” Jascha Franklin-Hodge, chief information officer at Boston’s Department of Innovation & Technology, said in an interview. “The fact that we’re dealing with a whole new line that we don’t have data on and can’t integrate it into our planning is sort of ridiculous.”
Uber seemed to take the criticism to heart. After the Boston partnership, the company created a Seattle-based team to develop an approach to sharing data with city planners across the world. Led by Jordan Gilbertson, a product manager at Uber, that project eventually became the new website, Movement.
City officials said that they appreciated user data privacy concerns but that they also hoped to see more useful information from Uber. Mr. Franklin-Hodge shared a list of detailed requests that could aid future urban development, like demand patterns around car-free tenant housing, locations with likely potholes and the most common pickup and drop-off locations.
Uber maintains that it plans to release more data to cities over time as it rolls out the Movement tool to a wider audience of researchers and to the public. But the company said it would balance that demand for information with concerns about user privacy and the need to protect competitive data that could prove valuable to rivals like Lyft, Hailo and Grab, which are vying for riders across many of the same markets.
“Ideally, we’ll someday find what that middle ground looks like,” Mr. Franklin-Hodge said.
THE NEW YORK TIMES
By MIKE ISAAC
JAN. 8, 2017
A brief historical stat sheet to the municipal ARS, FRN, and VRDO market ending December 2016. In excel (XLSX) format only.
January 3, 2017
Taylor Riggs, a contributor to Bloomberg Briefs, talks with Joe Mysak about this week’s municipal market news.
January 5, 2017
Bank of America Corp. is extending its lead in the municipal-bond business.
The Charlotte, North Carolina-based bank held its spot as the top underwriter of U.S. state and local debt for a fifth straight year by overseeing $67.8 billion of sales in 2016, boosting its share of new issues by 2 percentage points to 15 percent, a bigger gain that any other bank, according to data compiled by Bloomberg. Citigroup Inc. also captured a larger piece of the business, overtaking JPMorgan Chase & Co. to become the second-largest underwriter.
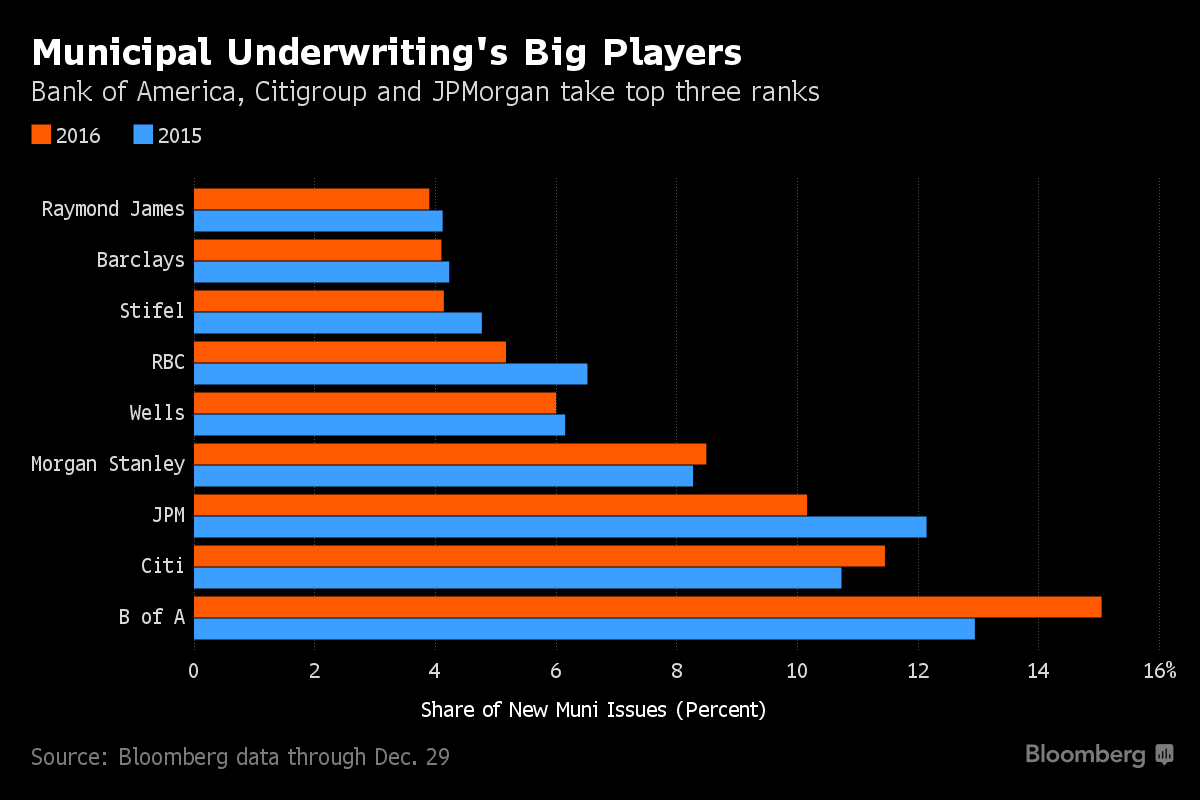
The banks benefited from a record pace of municipal-securities sales after yields tumbled to the lowest on record in July, spurring governments to refinance or borrow for public works before the Federal Reserve resumed raising interest rates, as it did last month.
Bank of America was the lead manager for the second-biggest issue of the year, a $2.74 billion sale by New Jersey’s Transportation Trust Fund Authority to finance roadwork. Citigroup and Goldman Sachs Group Inc. served as joint senior managers on the biggest deal of the year, a $2.95 billion general-obligation issue by the state of California, according to data compiled by Bloomberg. JPMorgan’s biggest deal was another $2.65 billion California sale, on which it served as a co-lead along with Bank of America.
Selena Morris, a Bank of America spokeswoman, declined to comment, as did Citigroup spokesman Scott Helfman. JPMorgan spokeswoman Jessica Francisco also declined to comment.
The pace of municipal-bond offerings are largely projected to decline this year, with refinancing expected to slow because of higher interest rates. Even so, first time borrowing may increase “slightly” as governments whose finances have benefited from the more than seven-year economic expansion pour more money into infrastructure, according to a forecast from Barclays Plc. U.S. state and local governments won approval to sell at least $55 billion of bonds in November ballot measures, debt that governments may start issuing in 2017.
The prices Wall Street banks charged U.S. cities and states to sell bonds in 2016 were little changed. Fees averaged $5.21 per $1,000 of long-term bonds compared with $5.08 in 2015. Among the 20 biggest underwriters of such debt, the weighted average disclosed fees ranged from $3.82 for Loop Capital Markets LLC to as much as $10.61 for Robert W. Baird & Co.
About three-quarters of the long-term debt issued in 2016 was arranged through so-called negotiated offerings, in which banks are picked ahead of time instead of competing against each other in an auction.
One of the firms that boosted its ranking the most was New York City-based Samuel A. Ramirez & Co. The dealer, which has about 80 people in its municipal securities division and was promoted to the ranks of New York City’s senior underwriters, rose 12 places to 14th by managing $6.9 billion of bonds in just 30 deals.
In 2016, Ramirez hired Paula Dagen, Morgan Stanley’s former lead banker for New York City and plans to expand “selectively and opportunistically,” said Ted Sobel, head of municipal finance. New York, one of the largest issuers of municipal bonds, plans to sell about $29 billion of debt through June 2020, according to the city’s financial plan.
“Our game plan has been very focused on providing great banking work — ideas, solutions, service, to major clients in core regions and in core competencies,” said Sobel, who joined Ramirez in 2009 after 13 years at UBS Group AG. “We’ve found that’s been a pretty good path to success.”
Bloomberg
by Martin Z Braun
January 3, 2017, 8:46 AM PST
A roundup of money (and other) news governments can use.
GOVERNING.COM
BY LIZ FARMER | JANUARY 6, 2017
Credit pressure across the U.S. state sector is likely to remain elevated throughout 2017 as slow tax revenue growth compounded by growing pension contribution requirements and Medicaid expenditures is contributing to fiscal strain for many states. A more pronounced slowdown in state tax revenue growth that began in mid-2015 persisted through 2016 and, following bouts of stock market volatility, is seen in the performance of many states’ fiscal 2017 revenues. In the coming year, revenue growth is likely to remain slow and below the rates at which key expenditures are growing. Some of these pressures, years in the making, are already evident in state financial and credit profiles.
In S&P Global Ratings’ view, the low-grade fiscal stress that has come to plague the state sector as a manifestation of evolving demographic and structural economic forces is unlikely to abate within our forecast horizon. In addition, the presidential election results raised the prospect that longstanding areas of federal-state fiscal integration will undergo a fundamental reconsideration. And, if enacted policy changes make good on the rhetoric heard in the campaign, federal funding flows are poised to become less responsive to economic cycles. In that case, we would expect state credit ratings to exhibit greater sensitivity to cyclical economic conditions. A shift toward block granting federal Medicaid funds, for instance, could diminish the program’s role in functioning as a countercyclical automatic stabilizer. On the other hand, financial markets have–initially at least—been bullish following the presidential election. Equity market appreciation and reflationary signals from the bond markets have favorable implications for states, though it’s unclear when—or to what extent—any related capital gains will translate to tax revenue. Nevertheless, the possibility of faster economic growth throughout the next one to two years represents the main source of opportunity for states to strengthen their financial and liability profiles before the next recession.
05-Jan-2017
As Colorado’s housing costs skyrocket, a growing number of school districts, local leaders, and lawmakers are taking steps to make housing more affordable for teachers and staff.
For years, resort communities like Aspen, Colorado, and a rural district in the state’s Eastern Plains have leased housing to employees at below-market rates. More recently, subsidized housing for educators has cropped up in pricey urban areas such as San Francisco, Boston, and Baltimore.
But lately, Colorado districts big and small are looking at building their own housing or collaborating with external partners to do so. Such projects are underway now in three rural districts, and Denver Public Schools, the state’s largest district, is exploring the idea.
Driving these plans are fears that recruiting and retaining good teachers will shift from hard to impossible as housing costs rise. Compounding the problem is Colorado’s perennial school-funding squeeze and the lagging teacher salaries that go with it.
“This year when it comes to hiring season, I will probably struggle to replace four to six teachers because of housing,” said David Blackburn, the superintendent of the Salida school district in central Colorado. “It’s in the middle of every conversation about quality staff.”
In Denver, where an influx of new residents and a wave of gentrification have pushed up housing prices across the metro area, district officials say they’re in the earliest stages of figuring out how the district could help employees with housing.
Currently, the Denver-based Donnell-Kay Foundation is compiling information for the district about models of subsidized teacher housing used across the country. Some have been spearheaded by school districts and others by real-estate developers with little involvement from districts. (Chalkbeat, which originally wrote this story, is a grantee of the Donnell-Kay Foundation.)
Allen Balczarek, who works on special projects for Denver Public Schools, said specific recommendations could go before the school board or district leadership team in 2017. He said the lack of affordable housing for teachers isn’t yet a crisis in Denver, but called it a very serious issue.
City officials say growing concerns about affordability spurred a new ordinance to raise $150 million over 10 years to create and preserve affordable housing for a wide range of Denver residents, from homeless individuals to families earning $64,000 to $96,000 a year.
Federal tax credits have already helped create affordable housing around the city, though many teachers make too much to qualify.
“There’s some we can help, but there’s probably many we can’t because of their income,” said Brent Snyder, the manager of the company that developed and owns the new WeltonPark apartment complex in Denver’s Five Points neighborhood.
Most of the 223 units, which start around $840 a month, are restricted to tenants earning up to 60 percent of the area’s median income—around $34,000 a year if they’re single. There’s a huge need for housing for middle-income Denver residents—those making more than 60 percent of the area median income, Snyder said.
Jim Wilson, a Republican state representative from Salida, said he plans to introduce a bill during the 2017 session that would give tax credits to employers that offer employee housing. While that wouldn’t directly help school districts or other public entities that don’t pay taxes, he said he’d like to find a way to do that.
Affordable housing is a statewide issue, he said. “It’s going to be a big topic of conversation at the statehouse this year.”
While there’s limited data showing that housing costs directly impact teacher recruitment and retention, there’s plenty of anecdotal evidence that it’s a factor.
The first-year Jefferson County teacher Krista Degerness, 34, said she had no problem finding a job after earning her master’s degree in special education last spring. But paying the bills has been trickier. She moved in with her sister to cut costs, paying $700 of the $1,700 rent for their Centennial, Colorado, townhouse. She earns $42,000 a year.
Degerness loves her job, but says, “The money is very hard.”
Alex Saldivar faced similar challenges when he moved from Indianapolis to Denver for a teaching job with Denver Public Schools in 2015. He and his girlfriend paid $1,250 a month for their one-bedroom apartment, leaving when the rent increased to $1,450 the following year.
“That frankly is untenable,” he said. “They essentially pushed us out.”
Saldivar left his teaching job after a year and now works for a nonprofit organization in Denver.
Some superintendents say they start teacher-candidate interviews with heart-to-hearts about the reality of housing costs in their communities. They don’t want candidates, especially those from out-of-state, jumping in with visions of majestic mountain peaks and not the dollar signs that go with them.
Custer County Superintendent Mark Payler said when he surveyed the southern Colorado district’s newer teachers recently, most indicated they planned to stay for only two to three years. One factor, he said, is the difficulty of securing decent housing on a starting salary of $29,500.
In Denver, a recent exit survey taken by teachers sheds some light on the subject. Of 219 teachers who left the district after the 2015-16 school year, 23 said Denver’s high cost of living was a big factor in their decision. Nearly 50 cited moving as a key reason for leaving, though there is likely overlap because respondents could cite multiple reasons.
Additional evidence comes from a September report from the National Housing Conference and the Center for Housing Policy that examined housing affordability for school employees in the nation’s biggest cities. Denver was among 24 cities where buying a house was unaffordable for teachers as well as lower-paid workers.
The “Paycheck to Paycheck” report also found that renting an apartment in Denver requires an annual salary of at least $49,000. While the district’s average teacher salary is around $54,000 with an average of $5,800 in additional stipends and incentives, the base salary for a beginning Denver teacher with a bachelor’s degree is about $40,000.
The concept of providing subsidized teacher housing has a long history in some Colorado districts.
Take tiny Woodlin on the Eastern Plains. The district owns 14 housing units, including trailers, houses, and apartments—most built around 1960 right on the school campus. Most employees pay rent of $70-$105 per month and the district covers water and propane.
Other rural districts, such as Karval and Deer Trail, offer employees similar deals. Then there’s Aspen, which has 43 units of subsidized housing going for $850-$1,500 a month. Market rate rents easily surpass $2,000 a month there, said the superintendent, John Maloy.
In the last 18 months, three other Colorado districts have launched projects to build employee housing—often with significant support from local civic leaders, banks, and the business community.
One area is converting a vacant district-owned building—formerly a preschool—to four apartments with the help of community volunteers and high-school students in the district’s building-trades class. The one-bedroom units will be ready next July, with rent at $550 a month.
Another district embarked on a similar project this fall, breaking ground for 10 new housing units in a nearby town. They’ll eventually be sold to district employees at below-market rates.
And in western Colorado, the Roaring Fork district has the largest project underway, with plans to build a total of 60 new subsidized apartments in three locations using $15 million from the district’s 2015 bond issue. Those units will become available in 2018.
Superintendent Rob Stein said district officials initially shied away from including money for staff housing in the bond issue. They didn’t think the public would support it. But when two local educators, a beloved principal and his wife, a teacher, departed because they couldn’t afford a house in the area, things changed. “That single story may very well have allowed us to move forward with going to voters for a bond,” Stein said. In turn, such projects may soon spread closer to Denver, and, perhaps, elsewhere.
“I think the mountain towns … are the harbingers of what’s to come,” said Tony Lewis, the executive director of the Donnell-Kay Foundation.
Leaders in districts that already offer subsidized housing say it makes a big difference—serving as extra enticement to prospective teachers and making it easier for veteran teachers to stay.
“I’ve suddenly got a new tool I can go to market with when I’m looking for new teachers,” said Payler, the superintendent of Custer County Schools.
But it also brings up lots of questions: Which employees get first dibs on the housing? Can some units be set aside for hard-to-fill positions? Will employees be allowed to stay in the units indefinitely? What happens if too few district staff need the housing?
For districts that have wrestled with these questions, the answers have evolved. For example, in 2015, the Aspen district established a five-year time limit for employees renting its subsidized units, in the hopes of making it a stepping stone as opposed to a permanent solution.
Beyond eligibility criteria, there’s also the fact that school districts with subsidized housing double as landlords, either hiring property-management companies to handle leasing and maintenance or doing it themselves. Rose Cronk, the superintendent in the Woodlin district for more than a decade, said of the district-owned housing, “Sometimes I’m the one over there cleaning rainwater out of the bottom of the basement.”
In some districts now considering subsidized housing, administrators worry such projects could distract from their educational goals. Balczarek said one of the key questions for Denver is, “How do we get into this without drifting too far from our mission?” One possibility, he said, is to work with an external partner—maybe the city’s housing authority or a nonprofit group—to develop and manage housing on district property.
Even with the many complications involved in financing and managing subsidized housing, some district leaders note that, unlike the state’s intractable school-funding system, it’s a problem that can be addressed locally. “It’s another creative solution to the fiscal crisis schools are facing” Stein said.
THE ATLANTIC
ANN SCHIMKE | JAN 6, 2017
This post appears courtesy of Chalkbeat Colorado.
Public-works projects have historically improved urbanites’ access to opportunity and quality of life. But they’ve also helped the privileged at the expense of the marginalized.
Throughout his campaign, and again in the wake of his victory, President-elect Donald Trump pledged to rebuild America’s infrastructure. “We are going to fix our inner cities and rebuild our highways, bridges, tunnels, airports, schools, hospitals,” he said on election night, promising to put millions of people to work building an infrastructure that would be “second to none.” In the weeks since his election, infrastructure has emerged as a potential bipartisan meeting ground for Trump and national Democrats. Senate Minority Leader Charles Schumer, for one, said recently that Trump’s trillion-dollar plan “sounded good” to him.
But would a federal infrastructure plan be good for America’s cities? Infrastructure has played a crucial—yet at times problematic—role in the making, and remaking, of the modern American city. Public works have expanded access to essential goods and to economic opportunities, and they have contributed to universal improvements in the standard of living. But they have also conferred advantages on privileged parts of American society at the expense of the marginalized—a history the Trump administration would do well to consider as it plans for the future. For cities to continue growing and innovating, they need an infrastructure capable of serving as a platform for sustainable development. And they need an infrastructure that serves everyone.
THE ATLANTIC
MASON B. WILLIAMS | JAN 7, 2017
Airports, high-speed rail, and roads, particularly in dense metropolitan areas, could be particularly appealing targets for infrastructure funding under soon-to-be President Donald Trump.
The President-elect’s words on the campaign trail and tendencies as a public figure over decades informed those conclusions from stakeholders and infrastructure experts trying to gauge how Trump might be most interested in directing the 10-year, $1 trillion infrastructure plan he campaigned on. The campaign’s only formal plan to date is a relatively brief paper proposing $137 billion of tax credits to be authorized by Congress and available only to investors in revenue-producing projects such as toll roads, toll bridges, and airports.
But while Trump’s actual infrastructure plan remains light on specific areas of focus, he has left clues in his words and in his actions as a real-estate developer. Trump made very negative mention of the state of U.S. airports during the campaign, characterizing them during the Sept. 26 debate at Hofstra University in New York as “third world.” Trump specifically mentioned several large airports, including LaGuardia Airport and John F. Kennedy International Airport in New York City, Newark Liberty International Airport in New Jersey, and Los Angeles International Airport as being inferior to facilities in the United Arab Emirates, Qatar, and China.
“We’ve become a third-world country,” Trump said from the debate stage.
Kevin Burke, president and chief executive officer of airport industry group Airports Council International-North America, said his group believes that major U.S. airports need $75 billion of investment just through 2019.
“We have been happy during the campaign hearing the President-elect talk about infrastructure,” said Burke, who believes that Trump recognizes that airports serve not just as transportation hubs but as important economic drivers for the regions where they are located.
“They really are centers of commerce,” Burke said. “This is not only helping to build new airports, but it is helping the local economy.”
Airports are also highly visible types of infrastructure many millions of people see while traveling through the U.S. Burke said that American hub airports handle about 800 million passengers annually, with that number estimated to grow to more than a billion in the next 20 years. A lot of the upcoming infrastructure investment will be aimed at adapting airports to modern needs, such as post 9/11 security, Burke said, as well as at other land-side infrastructure such as parking garages. Airports use tax exempt bonds for many of their infrastructure improvements, and rely on passenger facilities charges capped by federal law to generate much of their revenue. Trump could be influential as president both in maintaining the tax-exempt status of munis through any tax reform proposal and in supporting the uncapping of PFC charges to allow localities to set them at levels they feel appropriate.
Backers of bullet-trains, popular internationally but not so far in the states, also see hope under a Trump administration.
“We actually think high-speed rail is perfect for Trump,” said U.S. High Speed Rail Association president and CEO Andy Kunz. “It’s big, it’s flashy, it’s transformative.”
The U.S. currently has no “true” high-speed rail service comparable to the bullet trains operating in some other countries. Amtrak’s Acela service along the Northeast Corridor between Washington D.C. and Boston can reach speeds of up to 150 miles per hour, but realistically does not maintain those speeds for the majority of the route. The Japanese Shinkansen trains, by contrast, are capable of 200 miles per hour and have reached even greater speeds on occasion. Efforts to build new high-speed lines have met with resistance and financing troubles, as exemplified by an under-development line connecting cities in Northern and Southern California that has come in over the original cost estimates and been fought every inch of the way by some landowners potentially affected by its construction.
Kunz pointed out that Trump’s campaign statements appealed heavily to blue-collar workers concerned about declining manufacturing opportunities that a widespread high-speed rail program could help with. Kunz said that his group sent Trump a letter shortly after his election victory urging him to be a leader on the issue and pointing to a specific project linking Los Angeles and Las Vegas as one that could benefit from Trump’s backing right now. That project, XpressWest, has been in development for over a decade and would use electric trains traveling more than 150 miles per hour to cover the distance between the two cities in about 80 minutes.
Kunz said that Trump, as a longtime multi-billion dollar real estate developer, understands the value of train stations and could see the appeal of a project like the XpressWest that could be finished within Trump’s first term if expedited.
“He could be showing up at a ribbon-cutting,” Kunz said.
Toll roads are also a sector primed for investment under Trump because of the structure of his proposed plan, which emphasizes projects with a revenue stream. But toll roads, especially for heavily trafficked interstates, could face a lot of resistance that could discourage a strong push in that sector.
“Tolling the interstates is a total non-starter,” said Chris Spear, president of American Trucking Associations. “It is toxic and we will fight it, tooth and nail. We need national connectivity and tolling is the worst type of approach.”
“I can assure you he’s going to get a lot of pushback from taxpayers who are tired of these crony-capitalism deals that guarantee huge profits to contractors and investors,” said Terri Hall, founder and director of Texans for Toll-free Highways. “Voters trust Mr. Trump will read the tea leaves and advance a transportation vision and policy that’s pro-freedom, pro-taxpayer, and pro-worker.”
Cato Institute infrastructure expert Randal O’Toole said he didn’t believe Trump’s plan would significantly increase toll road investment, and that Trump’s tax-credit plan doesn’t change the fact that the states and localities still largely control what they want to invest in. Muni groups have urged Trump not to support eliminating or capping the tax exemption on muni bonds, preserving them as a cost-effective means of finance. Trump told the U.S. Conference of Mayors earlier this month that he plans to maintain the tax exemption.
“Trump may have a few ideas for selected projects, most of which I would probably disagree with, but the tax credit plan really leaves all decisions to state and local governments,” O’Toole said. “Right now, those local governments can issue tax-free municipal bonds; the tax-credits idea just provides an alternative method of funding.”
The Bond Buyer
By Kyle Glazier and Jim Watts
December 23, 2016
Thank you to thousands who participated in GFOA’s 21st Annual Governmental GAAP Update. GFOA has released a digital recording of the 2016 GAAP Update presentation.* For those who participated in the original program, the recording is a great way to refresh your memory of the material. If you were unable to participate, the recording is a great way to catch up and is ideal for in-house training. Download your copy today!
Save the date: GFOA’s 22nd Annual Governmental GAAP Update will take place on November 2, 2017, with an encore presentation on December 7, 2017, both at 1:00–5:00 pm Eastern.
*Please note that CPE credits are not awarded for watching the recorded program. The recording is only available electronically. To purchase using the GFOA e-store, log into your e-store account and add the recording to your cart. When you have completed your order, click the “Audio/Video” tab and follow the instructions to access the recording. If you submit your order via mail, fax, or e-mail, you will receive an e-mail with instructions when your recording is available to download.
In what could be a tumultuous year for state and local finances, these five issues are likely to take center stage.
Tax Reform
Many Capitol Hill watchers expect federal tax reform to roll forward in some fashion in 2017 now that a Republican will be in the White House. There are two major proposals on the table that could directly result in higher costs for states.
For starters, many in Congress have been supportive of limiting the tax-exempt status of municipal bonds. Removing this tax perk for bond investors would force governments to offer higher interest rates on the debt, thus increasing their cost of paying off that debt.
It’s hard to overstate the potential impact of such a move. One estimate pegged the current tax perk savings for state and local governments at about $714 billion from 2000 to 2014. For its part, the federal government estimates it loses as much as $30 billion in potential income tax revenue each year as a result of the perk.
President-elect Donald Trump recently told a group of mayors he would protect the tax exemption. The comment was the first time he’d specifically mentioned the issue and it was immediately met with hopeful praise from industry groups like the National Association of State Treasurers and the Council of Development Finance Agencies.
But how far that pledge will go remains to be seen.
Second, the tax reform discussion may also include eliminating the ability for tax filers to deduct their state and local taxes from their taxable income at the federal level.
Naysayers of the deduction argue it subsidizes high-tax states. While eliminating this perk wouldn’t have an immediate impact, said Michael Mazerov, senior fellow at the Center on Budget and Policy Priorities (CBPP), it would have a long-term impact on states’ ability to raise additional revenues through tax hikes. This is particularly true for higher-tax states where citizens would no longer get a substantial tax break at the federal level.
“Certainly,” he said, “the elimination could have one of biggest impacts on state and local finances.”
Budget Shortfalls
Weak revenues are causing the highest number of state budget shortfalls since the Great Recession, and that trend is expected to weigh on lawmakers as they draw up their fiscal 2018 budgets in the coming months.
According to the National Association of State Budget Officers’ annual state spending survey, half of all states saw revenues come in lower than projected for fiscal 2016. And nearly as many states (24) are seeing those weak revenue conditions carry into fiscal 2017. It marks the highest number of states falling short since 36 budgets missed their mark in 2010.
Unless lawmakers make significant corrections, some believe the picture could look bleaker as 2017 wears on.
“I tend to think it’s going to skew toward worse nationally,” said Matt Fabian, a partner at Municipal Market Analytics. “That means more budget gaps and reduced aid to local governments.” Any changes at the federal level, Fabian added, “are probably going to make it worse.”
Medicaid funding could also cut into state finances. Trump and other Republicans have proposed converting the program into a block grant. A Congressional Budget Office (CBO) assessment of earlier Medicaid block grant proposals projected declines of between 4 and 23 percent in federal funding over 10 years. Aid from the feds makes up approximately 15 percent of total state expenditures.
If the CBO’s estimates are accurate, Fitch Ratings said, “reductions of this magnitude would have a significant effect on states’ budgets.”
Tax Break Transparency
A new accounting rule, called GASB 77, will result in more hard data than ever on what was a previously murky part of state and local finances.
The rule requires governments to report the tax breaks they give to businesses as forgone tax revenue on their balance sheets.
While some wish the rule included more specific requirements — such as naming the companies receiving the breaks — most believe the new disclosures will be a watershed moment for transparency. The new data will likely inform policy discussions for years to come.
New York City has already reported its foregone revenue, disclosing that it waived more than $3 billion in potential tax revenue in 2016 alone, mostly in uncollected property taxes.
Noting that many states already produce tax expenditure reports, the CBPP’s Mazerov predicts that the new reporting requirements will be particularly revealing at the city and county level, as “there’s so little information locally about economic development giveaways.”
Increasing Pension Contributions
State and local retirement benefit expenditures have grown roughly twice as fast as revenues and most other spending areas in recent years, according to a new analysis by Fitch Ratings. While much of this growth has been driven by pensions, a rise in health-care and Medicaid costs have also played a part.
Meanwhile, the last two years have seen pension plans significantly miss their target rate of return (7.5 percent), which will trigger higher pension bills in the coming years. Governments with well-funded plans are much better positioned to absorb any increases. But many plans have less than three-quarters of the assets they need to fully meet their liabilities. The lower-funded the plan, the more extreme the impact of low-investment returns will be on a government’s pension bill.
The last 10 years have seen retirement benefit expenditures growth exceed or crowd out growth rates for all other major spending categories.
“With tax rate increases remaining politically challenging and due to the historically slow economic and revenue recovery after the financial crisis, state and local governments have been forced to hold the line on spending for other services,” Fitch said. “This trend is likely to continue over the near term.”
Online Sales Tax Battles
After more than a decade of badgering Congress to solve the issue nationally, states have taken it upon themselves to win the right to tax online purchases made by their residents.
Generally, consumers are only taxed on purchases from retailers with a physical presence in their state. But legal challenges by states are moving forward on several fronts.
First, Colorado recently scored a win when the U.S. Supreme Court effectively upheld a 2010 law by refusing to hear the case and letting the lower court ruling stand. The law makes collecting an online sales tax from Colorado consumers more palatable than going through the reporting requirements for companies that don’t do so.
Other states have already begun to follow suit, and both Louisiana and Vermont have enacted similar laws that take effect in 2017.
“At this point,” said Matt Walsh, Sovos Compliance’s vice president of tax, “we would also expect to see many states move to enact similar legislation early in 2017.”
Meanwhile two other states have cases moving forward that also challenge the status quo.
One company is challenging Alabama’s new sales tax rule that bases the tax on revenue, not location. In South Dakota, several companies are challenging the state’s 2016 law that outright permits it to collect a sales tax on Internet purchases from remote retailers who have a so-called “economic presence” in the state.
Many believe the South Dakota case could be fast-tracked to the Supreme Court as early as 2017.
GOVERNING.COM
BY LIZ FARMER | DECEMBER 29, 2016
CDFA | Dec. 28
LOS ANGELES – Donald Trump could and should include municipal finance experts on an infrastructure task force that sources say the president-elect is interested in putting together, lobbyists and industry sources said.
Trump’s administration appears to be in the early stages of forming a task force to determine how to carry out his promised $1 trillion infrastructure agenda, a force which The Washington Post reported may include son-in-law Jared Kushner, senior counselor Stephen K. Bannon, and others who are close to Trump but do not have experience in planning or financing public assets. According to a lobbyist familiar with transportation finance issues, the muni industry is likely to have an opportunity for input as well.
“It’s not surprising that the transition team would begin thinking now,” said Michael Decker, a managing director and co-head of municipal securities for the Securities Industry and Financial Markets Association. “It’s a topic that can draw on lots of different areas of focus” including the private sector and state and local government representatives.
Decker said infrastructure finance will be a big issue for SIFMA, and that the group has been thinking about and compiling ideas on policies that it believes make sense.
Jessica Giroux, general counsel and managing director for federal regulatory policy at the Bond Dealers of America, said that her group is interested in learning more about the task force and especially in reinforcing the need to protect the municipal bond tax exemption, something Trump has said he supports.
Trump’s published infrastructure plan, which experts generally agree is incomplete if he wants to reach his 10-year $1 trillion investment goal, relies heavily on tax credits to incentivize private sector investment in projects like toll roads and others that produce isolatable revenue streams. And while it is still far from clear who will be on Trump’s task force and how its role would differ from or complement the Department of Transportation and other departments handling infrastructure, it appears those close to Trump are seeking advice from the muni finance community.
“We are aware that some people on the transition team have been asking those in the industry for some thoughts on what can be done in the immediate sense, meaning, what can the administration do to make immediate changes that doesn’t require new legislation or regulations,” said the lobbyist, who spoke on condition of anonymity.
While an infrastructure task force could produce some recommendations for the Trump White House, much of the power will remain in the hands of legislators. The Republicans who now control both houses of Congress, may not support large spending increases or reauthorization of a Build America Bonds-type program, options that experts believe Trump may attempt but which Republicans have declined to embrace during the Obama administration.
Marcia Hale, executive director of Building America’s Future, an infrastructure advocacy group, said she has heard that the Trump administration plans to huddle with the House and Senate and have a unified infrastructure plan. Trump seems likely to want to call the shots, she said.
“I know the president-elect is very serious about more infrastructure funding,” Hale said. “No congressman or senator is going to be able to tell him how to get projects done or buildings built. That’s his comfort zone.”
The Bond Buyer
By Kyle Glazier
December 28, 2016
Jim Watts contributed to this story
With less people and money, small towns are prone to making big and expensive errors. One company wants to change that.
Small towns and districts know all too well about limited resources. Their departments are made up of just a few employees; they have almost no support staff; and they can’t afford fancy software that might help speed things along.
For finance directors, this makes budgeting a difficult and time-consuming task. In most less-populated places, the process is stuck in the 20th century: Budgets are created on Microsoft Excel, and directors are expected to consolidate versions between different departments.
At best, it’s arduous work. At worst, it leaves a lot of opportunities for errors.
“As different people set up different accounts in the ledger, they might get the set up wrong,” said Connie Maxwell, the budget director for Burnet, Texas. “Airplane revenue might show up under ‘interest earned’ because someone selected the wrong code.”
Indeed, the low-tech process has lead to costly oversights.
In 2013, a Massachusetts school district was forced to suddenly lay off nearly a dozen employees after it discovered an error in the previous year’s $34 million budget. The mistake had left the Groton-Dunstable Regional School District with a $400,000 shortfall halfway through the 2013-2014 school year.
In the small Napa Valley city of St. Helena, the discovery of a bookkeeping error last year exacerbated the California city’s budget woes by adding another $500,000 to the existing $1 million deficit. The total shortfall represented 15 percent of the city’s annual spending.
Maxwell said she typically spent nights and weekends finalizing the next year’s budget proposal. But that changed this year when Burnet and a few other governments beta-tested a new tool from OpenGov that does for government budgets what TurboTax does for individual tax filers.
Among other things, OpenGov’s Budget Builder automatically pushes relevant data into a government’s accounting system, eliminating the need for finance directors to do that manually when there are changes. Instead of reconciling multiple spreadsheets to create a master one, the budget is stored as a project on OpenGov’s cloud and users within each department can add budget requests to that one project. Changes are tracked, which helps people catch any errors. Users can also see the critical budget numbers in real-time — such as whether the proposed or current budget is running a deficit — and the system automatically builds charts and graphs to help users visualize their work.
A critical component is the price, which is where small localities often get left behind. According to OpenGov cofounder Nate Levine, the Budget Builder’s cost depends on the size of the government and the annual fee can range from $10,000 to six figures.
“Typically, the solutions out there are sold as add-ons to existing products,” he said. But the best, “government-centric [add-ons] are expensive and only accessible to larger governments.”
For OpenGov, the product is another tool to lure governments to its growing web of resources and services. The end goal for the company is to create the world’s first smart government platform — a cloud-based one-stop shop for budgeting, reporting and open data.
Now that the product has moved out of beta, it’s rapidly catching on. This month, more than 20 other local governments including Harford County, Md.; Long Beach, N.Y.; and Culpeper, Va., announced they’re rolling out Budget Builder.
The promise of less hassle has had tangible results. Those who have used the test version say they finished their budget at least one month earlier than usual.
With the extra time, Judy Smith, finance director of the Jackson County, Ga., Water and Sewerage Authority, said she’s had more time to conduct her year-end financials and get ready for the new year. She’s also been able to do helpful extras, like an inventory analysis.
In Burnet, which gets audited every year but doesn’t produce a comprehensive annual financial report (CAFR), Maxwell said she hopes to publish such a report for the first time.
“After months of doing budgeting, CAFR was a dirty word,” she said. “That potential is much more realistic for us now.”
GOVERNING.COM
BY LIZ FARMER | DECEMBER 27, 2016
Fitch Ratings-New York-27 December 2016: Public power issuers will likely manage the projected long-term decline in residential electricity consumption by using their inherent rate flexibility and lowering capex, according to Fitch Ratings. Despite expectations of higher electric sales during the next four months, average household electric demand is forecast to decline by 11% through 2040, according to the US Energy Information Administration (EIA).
The long-term decline in electricity demand will likely be driven by conservation efforts, more efficient lighting technologies, increasing efficiency standards and growth in distributed generation, particularly rooftop solar. Improvements in battery storage technology, expanded federal investment incentives and favorable net metering arrangements in some states, could push electric sales down even further.
The EIA’s Short-Term Energy Outlook forecasts the average residential customer will consume 4% more electricity from December 2016 through March 2017, than the same period last winter. The projected increase reflects the record warmth of the winter of 2015-2016 and not a reversal in the trend of declining residential consumption.
The EIA has forecast that overall residential electricity will grow by just 9.0%, or roughly 0.3% per annum, from 2015-2040 on growth in the number of households alone. Average household electric demand is forecast to decline by 11%. Residential users represent the largest customer segment for public power and cooperative issuers.
Fitch’s outlook for the public power and electric cooperative sector is stable through 2017, despite expectations of declining consumption. While lower electric sales could pressure public power issuers’ unit costs, and force changes to budgeting and resource planning, factors including the sector’s autonomous rate-setting authority and improved rate design should limit this risk.
We also believe potential long-run consumption declines will be managed through reductions in planned investment, particularly new generating capacity. Many issuers already adopted this strategy. Capital investment, as a percentage of depreciation, steadily declined throughout the public power sector since 2010. Among other factors, consumption trends and ample access to excess energy production led to this decline. We expect capex spending to remain low during the near term as issuers delay plans for new production units and leverage opportunities to exploit market overcapacity.
Together, these strategies should reduce revenue requirements and moderate required rate increases throughout the sector, while supporting the sector’s fundamental mission of providing safe, reliable and low-cost electric service.
Contact:
Dennis Pidherny
Managing Director, U.S. Public Finance
+1 212 908-0738
Fitch Ratings, Inc.
33 Whitehall Street, New York, NY
Rob Rowan
Senior Analyst, Fitch Wire
+1 212 908-9159
27 DEC 2016 10:52 AM EST
In American Towns, Private Profits From Public WorksDesperate towns have turned to private equity firms to manage their waterworks. The deals bring much-needed upgrades, but can carry hefty price tags.
BAYONNE, N.J. — Nicole Adamczyk’s drinking water used to slosh through a snarl of pipes dating from the Coolidge administration — a rusty, rickety symbol of the nation’s failing infrastructure.
So, in 2012, this blue-collar port city cut a deal with a Wall Street investment firm to manage its municipal waterworks.
Four years later, many of those crusty brown pipes have been replaced by shiny cobalt-blue ones, reflecting a broader infrastructure overhaul in Bayonne. But Ms. Adamczyk’s water and sewer bill has jumped so much that she is thinking about moving out of town.
“My reaction was, ‘Oh, so I guess I’m screwed now?’” said Ms. Adamczyk, an accountant and mother of two who received a quarterly bill for almost $500 this year. She’s not alone: Another resident’s bill jumped 5 percent, despite the household’s having used 11 percent less water.
THE NEW YORK TIMES
By DANIELLE IVORY, BEN PROTESS and GRIFF PALMERDEC. 24, 2016
Energy and infrastructure policy was as at the forefront of the presidential election discussion and has continued to be highlighted as a focus for the Trump administration. Here, we take an early look at how a Trump administration could affect the US energy and infrastructure sectors.
Renewables
Oil, Gas and Coal – Outlook
Infrastructure
General
Private Investment and P3s
Sales of Brownfield Infrastructure Assets
Legislation
Footnotes
1 Jack Fitzpatrick, Wind and Solar Energy Subsidies Aren’t Just for Democrats Anymore, Morning Consult (March 7, 2016).
2 Id.
3 US Wind Energy State Facts, American Wind Energy Association, http://www.awea.org/resources/statefactsheets.aspx?itemnumber=890 (last visited Dec. 2, 2016).
4 Fitzpatrick, supra note 1.
5 Id.
6 Id.
7 Joe Ryan & Brian Eckhouse, Trump’s Tax Proposals Would Threaten Wind and Solar Investment, Bloomberg (Nov. 7, 2016).
8 Donald J. Trump, An America First Energy Plan, https://www.donaldjtrump.com/policies/energy (last visited Dec. 2, 2016).
9 Matt Egan, Does Donald Trump’s Plan to Drill More Oil Make Sense?, CNNMoney (May 31, 2016).
10 Clifford Krauss, Oil Prices: What’s Behind the Volatility? Simple Economics, N.Y. Times (Nov. 2, 2016).
11 Sheryl Gay Stolberg, Trump’s Promises Will Be Hard to Keep, but Coal Country Has Faith, N.Y. Times (Nov. 28, 2016).
12 US Energy Information Administration.
13 Wilbur Ross & Peter Navarro, Trump Versus Clinton on Infrastructure, http://peternavarro.com/sitebuildercontent/sitebuilderfiles/infrastructurereport.pdf (last visited Dec. 2, 2016).
Last Updated: December 9 2016
Article by Robert N. Freedman, Paul J. Epstein and Alyssa Cowley
Shearman & Sterling LLP
The content of this article is intended to provide a general guide to the subject matter. Specialist advice should be sought about your specific circumstances.
In late November, the U.S. Department of Treasury’s Community Development Financial Institution (CDFI) fund announced the latest, eagerly awaited round of New Market Tax Credits (NMTC) allocations. The CDFI selected 120 community development entities (known as CDEs) out of a pool of 238 applicants. The current NMTC allocation, totaling an unprecedented $7.0 billion dollars of tax credit availability, represents a combined 2015-2016 round. NMTC’s are targeted to attract private investment capital for qualifying businesses and real estate projects in urban and rural low income communities nationwide.
The highly successful federal NMTC program was created through the Community Renewal Tax Relief Act of 2000 to facilitate economic and community development in low income, distressed communities by providing investors with a 39 percent tax credit for investing in qualifying projects. Since its inception, the NMTC program has sourced significant amounts of low cost capital for projects that were otherwise difficult or impossible to finance through conventional lending. Now in its 13th year of funding, NMTCs have historically been in high demand by developers seeking creative solutions to project financing.
If you are developing a project located in an urban or low income community, we encourage you to contact the attorneys at Fox Rothschild to discuss the potential use of NMTC financing for your project.
Last Updated: December 13 2016
Article by Daniel V. Madrid
Fox Rothschild LLP
The content of this article is intended to provide a general guide to the subject matter. Specialist advice should be sought about your specific circumstances.
SUMMARY:
EPA is proposing to establish fees related to the provision of federal credit assistance under Subtitle C of the Water Resources Reform and Development Act of 2014 (WRRDA), which is referred to as the Water Infrastructure Finance and Innovation Act of 2014 (WIFIA). WIFIA authorizes EPA to provide secured (direct) loans and loan guarantees to eligible water infrastructure projects and to charge fees to recover all or a portion of the Agency’s cost of providing credit assistance and the costs of retaining expert firms, including financial, engineering, and legal advisory services, in the field of municipal and project finance to assist in the underwriting and servicing of Federal credit instruments. The agency seeks comment on all aspects of this proposal.
DATES:
Comments must be received on or before February 17, 2017.
To learn more, and to comment, click here.
SUMMARY:
The Environmental Protection Agency (EPA) is issuing an interim final rule to implement a new program authorized under Subtitle C of the Water Resources Reform and Development Act of 2014 (WRRDA), which is referred to as the Water Infrastructure Finance and Innovation Act of 2014 (WIFIA). WIFIA authorizes EPA to provide secured (direct) loans and loan guarantees to eligible water infrastructure projects. Projects will be evaluated and selected by the Administrator of the EPA based on criteria set out in this rule using weightings established in a separate Notice of Funding Availability (NOFA). Following project selection, individual credit agreements will be developed through negotiations between the project sponsors and EPA. EPA is soliciting comments on an interim final rule that establishes the guidelines for the new credit assistance program for water and infrastructure projects and the process by which EPA will administer such credit assistance. The interim final rule primarily restates and clarifies statutory language while establishing approaches to specific procedural issues left to EPA’s discretion. This interim final rule pertains to a matter involving a federal loan and loan guarantee program and is therefore exempt from the rulemaking requirements of the Administrative Procedure Act. As such, EPA is issuing this rule as interim final.
DATES:
Effective December 19, 2016. Comments must be received on or before February 17, 2017.
To learn more, and to comment, click here.
Fitch Ratings-New York-21 December 2016: State and municipal retirement benefit expenditures grew approximately twice as fast as revenues and most other spending areas in recent years, according to an analysis of newly released US Census data by Fitch Ratings. Similar growth has been seen in government contributions to pension plans, reported separately by the Census Bureau.
Rising pension demands for contributions to trust funds from employers and for benefit payments from trust funds have effectively offset much of the revenue gains realized by state and local governments over the last several years, leaving less for other spending categories. This appears likely to continue as governments are forced to address persistent pension funding gaps.
Between 2004 and 2014, retirement benefit expenditures increased by approximately 89% or $122 billion in nominal terms. That easily outpaced the 47% growth in “own source” revenues, primarily from taxes and fees that governments collected over the same period. Higher retirement benefit expenditures equaled almost 18% of the $692 billion in nominal revenue growth.
Retirement benefit expenditures growth exceeded corresponding growth rates for all other major spending categories during the period, including hospitals, police and K-12 education. Retirement benefit expenditures expanded as a share of overall expenditures nationwide, to 8.0% in fiscal 2014 from 6.1% in fiscal 2004.
Shifting spending priorities across the large number of jurisdictions reporting to the Census Bureau have contributed to the changing expenditure mix. Retirement benefit expenditure pressures have mounted, but a similar acceleration in spending growth has been reported in areas such as health care and Medicaid.
Looking across the major expenditure categories reported in the Census data over an 11-year period, growth rates for transportation and education were among the lowest at 36% and 38%, respectively, falling short of the 47% revenue growth rate and barely exceeding the inflation rate.
At the same time, employer contributions to pension trusts along with asset returns supporting retirement benefit expenditures, have risen due to heightened concerns over pension sustainability. According to the Census Bureau’s separate Public Pension survey data, contributions rose 82% over the 2004-2014 period, or $75 billion. Total contributions have remained at around two-thirds of annual benefit payments over that period. Taken together, these two trends indicate that pensions are “crowding out” other spending needs.
In the coming days, we’ll be issuing the first document for public comment in the project reexamining the financial reporting model. The document is titled Invitation to Comment, Financial Reporting Model Improvements—Governmental Funds. The Board believes this project will have significant impact on the foundation of state and local governments’ accounting and financial reporting.
This phase of the project addresses the following potential improvements to governmental fund reporting:
Input from you and other stakeholders on these specific areas will inform the proposals the Board issues in the future of this project. Your feedback and ideas will be critical factors in both shaping the future of this project and ensuring that the GASB heads down the best path toward making improvements in the model.
The following additional topics will be considered for inclusion in a Preliminary Views in the next phase of the project:
The following additional topics will be considered for inclusion in an Exposure Draft in a future phase of the project:
JPMorgan Chase & Co. offered a crucial lifeline to the ailing Chicago Public Schools by purchasing almost $1 billion of short-term notes from the junk-rated system in the last four months. When the New York-based bank put some of its holdings up for sale, nobody made the trade.
On Nov. 22, JPMorgan offered $50 million to $100 million of the notes maturing Dec. 2017 with potential for more depending on demand, according to people familiar with the matter. The notes had a coupon of 70 percent of the three-month London interbank offered rate plus 400 basis points, which, according to the notes’ official statement, would apply if the rating was between CCC+ and CCC, only a few notches above debt that’s already in default. The school system’s general-obligation bonds are currently rated B3 by Moody’s Investors Service and B by Standard & Poor’s.
It’s unclear whether JPMorgan was trying to sell the securities, or just gauge their value during the market rout that followed Donald Trump’s election. Brian Marchiony, a spokesman for the bank, declined to comment.
“It could have been price discovery to get a sense of how much those notes are worth,” said Matt Fabian, a partner with Municipal Market Analytics Inc. “In the middle of a market-wide selloff, I think they were hard to value.”
The yields quoted by JPMorgan underscore the riskiness of the loans and suggest the district may pay a high price if it follows through with a planned $600 million note sale in January, a month before it must deposit more than $400 million for debt service. If Chicago’s schools can’t issue the debt, it faces some difficult decisions, said Naomi Richman, a managing director at Moody’s.
“They could try to cut expenses, although that’s certainly a very high magnitude of expenses to have to cut,” said Richman. “They could ask the state of Illinois for assistance, which they have been doing, but the state has budget issues of its own.”
Expenses at the third-largest U.S. school system consistently exceed operating revenue and the district is counting on more than $200 million in state aid — and a $250 million credit from the its pension board — to cover a $720 million retirement-fund payment due in June.
JPMorgan has close ties to Chicago, where it’s the third-largest private sector employer, and the bank has been the biggest lender to the school system. Chief Executive Officer Jamie Dimon was head of Bank One Corp. when JPMorgan bought the Chicago-based bank in 2004. William Daley, son and brother of Chicago mayors Richard J. Daley and Richard M. Daley, served as vice chairman at JPMorgan. JPMorgan loaned $500 million to Chicago’s schools in 2015, according to data compiled by Bloomberg.
Chicago’s schools, whose enrollment has declined 5.6 percent over the last five years, began the fiscal year July 1 with a $1.1 billion deficit. The district’s cash position declined to $83 million at the end of fiscal 2016 from about $1.3 billion at the beginning of fiscal 2012, according to a recent bond offering statement, and the district’s reliance on short-term borrowing has grown by $850 million in two years.
Illinois Governor Bruce Rauner has said bankruptcy for the school system might be the best option, though the Democrat-controlled legislature has bucked his suggestion that state law be changed to allow it.
“The big risk here is bankruptcy between now and 2017 when they come due,” said Paul Mansour, head of municipal research at Conning, referring to the district’s notes. “Investors are more nervous about that than anything else.”
Last week, the district had little trouble finding buyers for its more highly rated securities. It sold about $730 million of bonds secured by a dedicated share of the city’s property tax, which won the debt investment grade ranks of A from Fitch Ratings and BBB from Kroll Bond Rating Agency. Debt maturing in 30-years were priced to yield 6.25 percent, almost 2 percentage points more than generic bonds with the same rating, according to data compiled by Bloomberg.
Bloomberg Markets
by Martin Z Braun
December 22, 2016, 2:00 AM PST
The Obama administration says some municipalities can help you build a nest egg.
More than a third of full-time private-sector workers in the U.S. don’t have a way to save for retirement on the job. On Tuesday, the Department of Labor offered a new way to fill that gap: Let cities and counties get involved.
A new rule would clear regulatory barriers that might otherwise stop large municipalities such as New York from setting up plans for all workers—not just those who work for local government. Officials in the Big Apple, as well as in Seattle and Philadelphia, have already expressed interest.
The outgoing Democratic administration of President Barack Obama had wanted to create automatic individual retirement accounts that would follow workers through their careers. That went nowhere in the Republican controlled Congress, but then states started exploring the idea of launching their own, so-called auto-IRA programs.
The Labor Department gave its final blessing to these state plans in August. The U.S. government made clear that state auto-IRAs were legal and wouldn’t be subject to the very complicated federal rules that govern other retirement plans.
Now officials are amending that rule to let local and municipal governments get in on the act.
Not every city or county could set up an auto-IRA, however. Out of almost 90,000 local governments in the U.S., the Labor Department estimates that only about 88 would be eligible. First, jurisdictions would need authority under state law to set up the program. They also couldn’t overlap with an existing statewide retirement plan, so Los Angeles and San Francisco couldn’t set up their own plans.
Finally, they’d need to have a population greater than the least-populous state. (That’s Wyoming, population 586,000.)
With 8.6 million people, New York City is larger than all but 11 states. In October, Comptroller Scott Stringer proposed that the city create a “NYC Roth IRA” to cover the three in five workers who, he estimated, don’t already have a retirement plan.
Philadelphia Controller Alan Butkovitz and a member of Seattle’s City Council have signaled that their cities may move in that direction as well. Seattle, with 684,000 people, and Philadelphia, with a population of 1.6 million, would both be eligible under the new rule.
In Philadelphia, 54 percent of employees, or about 334,000 people, don’t have access to a workplace retirement plan, Butkovitz estimates. “By including local governments, local policymakers will gain a tool that may be able to help them to address the serious issue of retirement security that is facing our communities,” he wrote in a September letter to the Labor Department.
It’s not clear yet how the change of presidential administrations will affect retirement plan rules. The Department of Labor’s final rule on local government auto-IRAs goes into effect in 30 days. That’s Jan. 19, the day before Republican President-elect Donald Trump takes office.
Bloomberg
by Ben Steverman
December 20, 2016, 10:21 AM PST
Amanda Albright, a reporter for Bloomberg Briefs, talks with Joe Mysak about this week’s municipal market news.
Bloomberg
December 22, 2016
Private-equity firm owns 90% stake in water systems in New Jersey and Pennsylvania
KKR & Co. is shopping its stake in ventures that provide water services to two U.S. cities, a test of whether Wall Street has found a way to profitably invest in public works at a time when President-elect Donald Trump has promised to steer private money to aging infrastructure.
KKR and partner Suez SA, the French company formed to build the Egyptian canal of the same name, in recent years struck deals to pay off public debt and assume responsibility for operating and repairing municipal water systems in Bayonne, N.J., and Middletown, Pa. In exchange, they are due decades of payments from billing the systems’ customers.
Now KKR is seeking a buyer for its 90% interest in the water pacts, according to people familiar with the matter. The firm, best known for its takeovers of public companies, invested roughly $175 million in the ventures and has committed more than $200 million for repairs and maintenance over the course of the agreements, 40 years in the case of Bayonne and 50 years in Middletown.
The firm is pitching the water deals to long-term investors seeking steady returns, such as insurance companies and pensions, the people said. Suez plans to keep its minority stake and continue operating both systems, they said.
A profitable sale would help validate the structure that KKR and its partners crafted to invest in municipal utilities at a time when Wall Street has raised more cash than ever to invest in public works.
Investors committed a record of $57.5 billion to private infrastructure funds this year, according to data provider Preqin, pushing to more than $140 billion the amount of ready-to-invest cash in such funds.
Water and sewage systems have been singled out by politicians, civil engineers and government agencies as particularly in need of investment. The Environmental Protection Agency has said that more than $655 billion is needed to repair and expand U.S. water and sewage systems over the next two decades.
Mr. Trump has proposed $1 trillion of new infrastructure spending that relies on private investment, proposing tax breaks to draw investors to spend on roads, pipelines and ports.
But deals of this kind come with a special set of challenges for Wall Street. Relationships with the counterparties and customers are often tenuous and can quickly turn contentious, especially because such deals usually outlast the political administrations that make them.
Carlyle Group LP earlier this year sold a package of three western water systems to Canada’s Algonquin Power & Utilities Corp. for $250 million, more than twice what the Washington, D.C., firm paid for them. Yet that profit came at the expense of bruising public relations and court battles.
Three years after Carlyle purchased the water systems, Missoula, Mont., successfully sued under eminent domain laws to take back the system operating there, claiming Carlyle skimped on upkeep and repairs while enriching itself.
Missoula is now waiting for a judge to tell it how to take over the system and how much it would have to pay Algonquin for the system. A court determined last year that Missoula should pay $88.6 million, though that could rise if legal fees and other expenses are added.
Apple Valley, Calif., has filed its own eminent domain suit to wrest control of another of the three water systems Algonquin bought from Carlyle. Officials from the city east of Los Angeles say rates have risen too much under private ownership. “Our only recourse is to condemn the water company,” said Apple Valley Mayor Scott Nassif.
Algonquin and Carlyle have defended their management of the systems.
It took KKR two years to negotiate terms and win approval from state regulators to lease the system from Bayonne, which sits across the Hudson River from New York City. The deal involved an upfront payment of $150 million, used mostly to pay down debt, and a commitment to spend $157 million maintaining the system over the next four decades.
Tim Boyle, who heads the city’s utilities department, said the city’s current leadership, which took office two years into the deal, was initially skeptical. But they warmed to the pact once they considered improvements that were being made, such as the repair of a leaky water main that runs beneath the Passaic River and installation of equipment that enables workers to clear storm-water outflows without climbing into the sewers.
A contractual cap on KKR’s profits helped, too. “They are not free to gouge away at the ratepayers,” Mr. Boyle said.
The investors are guaranteed minimum revenue for the life of the deal. This year’s revenue is about $27 million before operating and capital expenses and is set to rise about 4% annually. If the utility doesn’t produce enough revenue, rates could be increased above the roughly 3.5% outlined in the deal. That happened last year when projections that proved too optimistic and unexpected repairs necessitated a 13.25% increase, or about $12 for the average monthly bill.
If revenue rises above projections, the extra cash is to be banked away to limit future rate increases.
KKR can’t hold its water deals for their duration. The ventures were funded with its 2011 infrastructure fund, which only has a lock on investors’ cash for 10 years.
THE WALL STREET JOURNAL
By RYAN DEZEMBER and HEATHER GILLERS
Dec. 22, 2016 9:24 a.m. ET
Write to Ryan Dezember at ryan.dezember@wsj.com and Heather Gillers at heather.gillers@wsj.com
WASHINGTON — It’s not at all clear that President-elect Donald Trump’s plans to spend massively on infrastructure are going to unfold as he promised.
Trump made rebuilding the nation’s aging roads, bridges and airports very much part of his job-creation strategy in the presidential race. But lately lobbyists have begun to fear that there won’t be an infrastructure proposal at all, or at least not the grand plan they’d been led to expect.
From the day he entered the presidential race to the moment he declared victory, Trump pledged an infrastructure renewal. He cited decaying bridges, potholed roads and airports like New York’s LaGuardia that he said reminded him of the “third world.”
Trump or his campaign also mentioned schools, hospitals, pipelines, water treatment plants and the electrical grid as part of a job-creation strategy that would make the U.S. “second to none.” It was a rare area in which House Minority Leader Nancy Pelosi and other Democrats hoped for common ground with the president-elect. The possibility of a major infrastructure spending plan is one of several factors that have fueled the recent run-up in stock prices.
Senate Majority Leader Mitch McConnell tried to tamp down expectations last week, telling reporters he wants to avoid “a $1 trillion stimulus.” And Reince Priebus, who will be Trump’s chief of staff, said in a radio interview that the new administration will focus in its first nine months with other issues like health care and rewriting tax laws. He sidestepped questions about the infrastructure plan.
In a post-election interview with The New York Times, Trump himself seemed to back away, saying infrastructure won’t be a “core” part of the first few years of his administration. But he said there will still be “a very large-scale infrastructure bill.”
He acknowledged that he didn’t realize during the campaign that New Deal-style proposals to put people to work building infrastructure might conflict with his party’s small-government philosophy.
“That’s not a very Republican thing — I didn’t even know that, frankly,” he said.
Since the election, Trump has backed away — or at least suggested flexibility — on a range of issues that energized his supporters during the campaign, including his promises to prosecute Hillary Clinton, pull out of the Paris climate change accord and reinstitute waterboarding for detainees.
Trump transition officials didn’t immediately respond to a request for comment.
The mixed signals on infrastructure have lobbyists and lawmakers puzzled.
“We’re worried,” said Brian Turmail, a spokesman for the Associated General Contractors of America, which represents more than 26,000 construction companies and 10,500 service providers and suppliers.
“Are we hearing signs that people just don’t know what the plan is?” he asked. “Or signs that people don’t want any kind of plan? We don’t know the answer.”
Lobbyists have responded by flooding the Trump transition team with briefing memos, lining up meetings and privately pitching their proposals to what they hope will be a more receptive Congress.
Trade associations are urging their local members to seek out their senators and House members while they’re home for the holidays. The contractors’ association held a news conference in front of a bridge construction project in Little Rock, Arkansas. The American Road and Transportation Builders Association has given members form letters to send their lawmakers, while quietly floating a plan for new transportation fees to provide reliable sources of additional income for the federal Highway Trust Fund.
Leaders of the U.S. Conference of Mayors emphasized their support for an infrastructure program in a recent meeting with Trump and urged him to protect the municipal bond tax exemption, one of the primary ways localities raise money for projects.
The Airports Council International-North America is lobbying to raise the limit on fees airports charge airline passengers. The money goes to renovate or expand terminals and increase the number of gates.
Trump’s campaign pitch for infrastructure improvements included few details. A paper circulated after the election recommends using $137 billion in federal tax credits to generate $1 trillion in private-sector infrastructure investment over a decade. To offset the cost of the credits, U.S. corporations would be encouraged to bring home profits that they have parked overseas to avoid taxes, in exchange for a lower tax rate. But private investors are typically interested only in projects that create revenue, such as tolls, so that they can recoup their investments.
What states and communities need most is more direct spending, rather than tax credits, to help pay for upkeep and replacement of existing roads, bridges and transit systems, said Bud Wright, executive director of the American Association of State Highway and Transportation Officials. “Those aren’t necessarily projects that lend themselves to generating revenue,” he said.
It’s also possible tax credits would provide a windfall to investors in existing projects while failing to generate new ones.
Some lawmakers from both parties are urging the creation of a federal “infrastructure bank” to make low-cost loans to projects.
“Everybody is putting together their Christmas lists for what they want to see in an infrastructure bill,” said Kevin Gluba, executive director of the Alliance for Innovation and Infrastructure. “The biggest question: Who is going to pay for it? Many of the ideas floating around are far too pricey to make into law.”
By THE ASSOCIATED PRESS
DEC. 20, 2016, 4:01 A.M. E.S.T.
___
AP White House Correspondent Julie Pace contributed to this report.
The president-elect wants to draw in private money—but do investors swoon to fix leaky school roofs?
Divining what Trumponomics will look like is guesswork at this stage, but there is one prominent exception. Late in the campaign, two of Donald Trump’s top economic advisers—Peter Navarro and Wilbur Ross, who is now the nominee for commerce secretary—offered a detailed infrastructure plan. Unsurprisingly, the program seems more about rewarding private-equity investors than about rebuilding America’s crumbling infrastructure.
Infrastructure plans come in three phases: selecting projects, lining up financing, and executing construction. The third step is normally left to private contractors, because state and local governments don’t employ stables of construction workers. As such, government’s role is concentrated in the first two steps.
Traditionally, a higher level of government sends money to a lower level (from federal to state, or from state to local). The Trump plan would rely more on private investors motivated by huge tax breaks.
Follow the money. Messrs. Navarro and Ross propose an 82% tax credit to attract private-equity investors into the infrastructure business. Yes, 82%! A $3 billion public-private “partnership,” according to their plan, could be financed like this: $2.5 billion in municipal bonds, $410 million in tax credits from the federal government, and $90 million in private equity. This means $90 million in private money winds up controlling a $3 billion asset. Mr. Trump likes leverage, but isn’t 33-to-1 a little ridiculous?
What return on capital would private investors demand on such investments? Messrs. Navarro and Ross say between 9% and 10%. Add in the general partner’s carried interest, and that is about 12%. It could be higher, however. History suggests that building roads and bridges is not a low-risk investment. According to a 2015 Congressional Budget Office report, 14 privately financed road projects have been completed in the U.S. since 1995. Of these, three went bankrupt and one required a public buyout—29% failure rate.
By contrast, the New Jersey Turnpike authority can still borrow for 30 years at 3.4% despite the best efforts of Gov. Chris Christie to destroy his government’s credit rating. States with higher ratings pay less.
So much for financing. What about selecting projects?
To attract private money, projects must offer investors cash returns—derived, for example, from tolls on highways. In some cases, this is possible, even desirable. But for many important projects, charging fees can be impractical. Think of building schools in poor neighborhoods or repairing crumbling bridges that have no tolls.
In truth, much of America’s most critical infrastructure needs are for repair and maintenance work—whether it is pothole-laden roads or schools with leaky roofs. Economists find that such unglamorous repair work often offers the highest returns for society.
Infrastructure projects selected in the traditional way, by governments, are chosen based on public benefits, the community’s ability to pay—and sometimes crass political favoritism. It would be nice to get rid of the latter, which is the main argument for a public infrastructure bank.
Under the Trump plan, project selection would be left to profit-seeking investors, using the same criteria they use to decide which hotels to build, for example. Ironically, Messrs. Navarro and Ross criticize President Obama’s modest 2015 infrastructure proposals because, “These will not fix the 237,600 water mains that break each year. Nor will they stop the 46 billion gallons of water lost each day from pipe leaks.” Does the Trump team really think private-equity investors will swoon over repairing plumbing?
There are many better alternatives. One example is Build American Bonds (BABs), a special breed of municipal bonds whereby municipalities issue taxable debt but receive a subsidy from the federal government—35% under the 2009 Recovery Act. In the two years the program lasted, more than $180 billion of bonds were issued, financing thousands of projects from community college construction to road maintenance.
BABs leave project selection to municipalities, which can use them for routine maintenance and other projects that lack a revenue stream. Unlike Mr. Trump’s plan and conventional tax-exempt bonds, BABs are attractive to investors who do not pay U.S. taxes, such as pension funds, endowments and sovereign-wealth funds. That increases demand and lowers borrowing costs.
There may be some projects for which private-equity investments, encouraged by tax incentives, make sense. But for the great bulk of infrastructure needs, BABs would be a far superior solution. If the Trump administration is serious about making our public infrastructure great again, it should worry less about finding ways to make the rich richer.
THE WALL STREET JOURNAL
By ALAN S. BLINDER and ALAN B. KRUEGER
Dec. 18, 2016 5:13 p.m. ET
Messrs. Blinder and Krueger are professors of economics at Princeton University.
Debt sales in the U.S. municipal market will cool off next week as issuers bring fewer offers in advance of the Christmas and New Year’s holidays, with new issuance totaling about $500 million next week.
The biggest competitive offer will come from Massachusetts, which is offering two general obligation refunding deals totaling $188 million.
Market participants overall remain neutral on whether the lack of supply and participation will keep municipal trading subdued and in a tight range, according to a survey by MMD, a Thomson Reuters company.
Loop Capital Markets on Tuesday said municipal debt volume will come in at $395 billion next year, down an estimated 13 percent from forecasts for 2016 as the incoming Trump administration’s impact on economic growth will fall short of expectations.
The Federal Reserve’s announcement on Wednesday that it would raise interest rates a quarter percentage point with three additional increases next year made yields jump on Thursday.
But bulls in the muni market believe the meager supply next week combined with more appealing rates and Jan. 1 reinvestment money will push yields lower into the new year, according to the MMD survey.
Muni yields have risen dramatically since the Nov. 8 presidential election. In the first month after the election, muni yields rose more than 80 basis points, John Mousseau, executive vice president at Cumberland Advisors, said in a note on Friday.
“The move up in taxable as well as tax-free yields has been swift and sharp,” Mousseau said. “Essentially, what could be characterized as a year’s worth of movement in bond yields was compressed into a month.”
As of market close on Friday, the yield on top-rated 10-year paper was 77 basis points higher than it was the day of the election. The 30-year yield has also risen 67 basis points since then, MMD data showed.
Fear of a Trump administration led the market to immediately discount a higher growth rate, increased government borrowing, and expanded infrastructure spending, as well as accompanying wage growth and higher inflation, Mousseau said.
An expected cut in the marginal tax rate and a potential increase in the supply of municipal bonds as a result of increased infrastructure spending also worked against munis, he said.
REUTERS
By Rory Carroll | SAN FRANCISCO
Fri Dec 16, 2016 | 5:18pm EST
(Reporting by Rory Carroll; Editing by James Dalgleish)
This is the fourth installment of Mall Madness, a five-part series on the American Dream retail and entertainment complex under construction in the Meadowlands. The series was produced through a reporting collaboration between WNYC, NJ Spotlight, and Bloomberg Businessweek. The first story, second story, and third story are also available online. The mall is schedule to open in the fall of 2018
Tim Lizura, president and chief operating officer of the New Jersey Economic Development Authority, has more than 20 years with the agency over two different tenures. He also worked on World Trade Center redevelopment for the Port Authority.
Yet he didn’t hesitate to answer, “Yes,” when asked if Triple Five’s American Dream was the most complex state project he’s worked on.
“What makes it complex is the financing that sits behind the analysis,” Lizura said.
Creative financing 101
That complex financing includes a state sales-tax incentive that could be worth up to $390 million, approved by Lizura’s agency last year. Then there’s a local-redevelopment tax incentive that could be worth up to $800 million. And rather than waiting to redeem those incentives over several decades, Triple Five intends to use them to back more than $1 billion in tax-free municipal bonds that could be sold as early as next month through a public-finance agency in Wisconsin, all to cover construction costs.
The developer is also planning to raise another $1.5 billion for construction through a private loan, which would run the total price tag of the project up to $5 billion, counting the $2 billion value of a vacant building inherited from prior developers. And a $185 million government-funded rail line that opened in 2009 will carry customers to and from the planned mall, which is located on state-owned property in the Meadowlands.
Investors not taxpayers assume risks (theoretically)
Triple Five’s attorneys, government-agency lawyers, and other officials say it’s the very complexity of the finance plan — the way the bond sale has been structured and the tax-incentive programs designed — that ensures taxpayers are 100 percent protected if Triple Five to falls flat — as did two of the project’s prior developers. Others take issue with government being involved at all, arguing that Triple Five, which is owned by a family worth an estimated $2.5 billion according to Bloomberg’s Billionaires Index, shouldn’t need tax incentives in a state where property taxes are at an all-time high and priorities like education and public-employees pensions routinely go underfunded.
Bonds needed for the mall to open
The reason Triple Five wants to raise $2.65 billion in new financing is to resume construction on a 90-acre site near the New Jersey Turnpike in East Rutherford, which was left abandoned by two developers when the project was called Xanadu. Triple Five, which owns the Mall of America in Minnesota, renamed its project “American Dream,” and wants to turn it into a three-million-square-foot shopping/entertainment complex, one that will feature a waterpark, amusement park, full-size ice rink, and observation wheel.
But to do so, the developer needs the bond sale to go through. And to get this far that has meant getting approvals from three different agencies in recent months due to the involvement of the state and local-redevelopment incentive programs. The bond issue also survived a legal challenge this summer.
One component of the bond sale involves the financing of payments-in-lieu-of-taxes (PILOTs) that Triple Five has agreed to make to the borough of East Rutherford instead of paying conventional property taxes. Since New Jersey law allows such payments to be used to finance upfront construction costs for priority redevelopment projects, Triple Five plans to back as much as $800 million in bonds using the pledged payments, with a maturity date of 2049, according to a summary submitted to the state Local Finance Board in August.
Another $350 million in bonds will be backed by the up-to $390 million sales-tax break that was approved in 2015 by the Economic Development Authority. To qualify for that tax incentive, the developer had to demonstrate its project would create a net benefit for the state, and that the company couldn’t generate enough financing to finish construction without the state’s involvement. In this case, the incentive is 75 percent of the project’s future sales-tax revenue over two decades.
What Wisconsin has to do with this
The combined $1.15 billion in unrated revenue bonds will be sold through a two-step process involving the New Jersey Sports & Exposition Authority and the Wisconsin Public Finance Authority. The Wisconsin agency — located nearly 1,000 miles from the Meadowlands — is legally authorized to issue tax-exempt bonds for projects that aren’t required to be within its borders. According to Bloomberg, the agency has become a popular partner for projects across the country that provide some kind of social or economic benefits and are willing to pay fees for the issuance of tax-exempt bonds.
Assessing the risks of the bonds
Yet the bond sale has already been delayed several times this year, and there are several issues that could give investors pause. The American Dream site stands on slightly higher ground in the Meadowlands than other parts of a region commonly referred to as a swamp, but a climate-change report released just last week by the Regional Plan Association warns that critical infrastructure running through the Meadowlands could be threatened by three feet of sea-level rise — a scenario that scientists believe could happen as soon as the 2080s. A map released by the RPA also suggests American Dream could eventually become an island surrounded by a large saltwater bay.
Another possible concern for investors is an issue raised by the Federal Reserve Bank of New York in research published online in 2012 about municipal bonds, which are generally considered to be safe if unspectacular investments. The research noted defaults for municipal bonds are higher than is often reported by rating agencies because unrated bonds are usually not factored into their assessments. The report also labeled revenue bonds such as those being sold by Triple Five as being particularly risky compared with government general-obligation bonds, which are typically backed directly by tax revenues.
What is Triple Five risking?
Christopher Leinberger, an experienced developer who chairs George Washington University’s Center for Real Estate and Urban Analysis, also raised questions about how much of its own cash equity Triple Five is putting on the table. According to documents submitted to the Economic Development Authority, that amount appears to be $200 million, but Tony Armlin, Triple Five’s vice president, said it’s actually north of $350 million.
Still, even the higher amount remains just a small fraction of the overall $2.65 billion that Triple Five is trying to raise from investors to complete the development project.
“I’ll make the prediction that there will be a recession, and when it comes — I just can’t tell you when — when it comes, this project is going to have some very lean years as far as the revenues that it generates,” Leinberger said. “To carry it through those lean years you need more than 10 percent equity in the deal. That’s why banks are demanding 20 percent to 40 percent equity.”
But Armlin has stressed at government meetings in recent months that there is absolutely no risk being placed on the state or the taxpayers by Triple Five’s bond issue. Instead, he said the risk is entirely on the investors because the bonds are being sold as a “non-recourse,” issue. That means the lenders will have no grounds to go after taxpayers if the project doesn’t take off, but it also means they will expect a higher yield.
“Triple Five’s project has been completely transparent and fully satisfied every local, state, and federal approval required,” Armlin said during a New Jersey Sports & Exposition Authority meeting in September.
Tax incentives similar to Revel deal
Lizura, the EDA executive, said there are also protections built into the state tax incentives themselves. He said the tax breaks approved by his agency will never make it to Triple Five unless the project opens and is profitable. As an example of how they work, he pointed to a $261 million tax-incentive package approved for the failed Revel casino in Atlantic City in 2011. Because the casino went belly up, it never redeemed its tax breaks.
“I think we would have been better off if it operated, for sure, because the state would have gotten a bunch more money and we would’ve given some of that back, but there’s really no public money at risk in the way the program is run,” Lizura said.
Triple Five representatives have also pushed back strongly against claims that the developer is getting a sweetheart property tax break through its deal with East Rutherford. The borough will still be receiving an upfront payment of $21.5 million, and then $2.7 million per year through the agreement even as the investors are also paid off, Triple Five’s representatives said. They also note that it was a previous developer that struck the deal to move the mall from a privately owned tract to the state-owned sports complex.
“No real estate taxes are being diverted from the State of New Jersey or the Borough of East Rutherford,” Triple Five’s statement said.
East Rutherford Mayor James Cassella also offered assurances that borough taxpayers are completely protected, even against a lawsuit if the developer ends up going under. And he said the borough won’t have to provide the complex with police or other emergency services in return for the PILOTs. The state police are in charge of patrolling the sports complex, and the Sports Authority has a Meadowlands Fire Department.
“There isn’t much you could sue us on because we didn’t conceive this, give any money to it, or whatever,” Cassella said. “We’re just saying if you open up, you’re going to pay us,” he said.
But Jeff Tittel, director of New Jersey’s Sierra Club and a longtime critic of American Dream’s tax incentives, said the bigger issue is what else could be done with the tax revenue that has been pledged to Triple Five to help fund its construction costs. “All of this money could clearly be better spent on building new schools, taking lead out of our drinking water, and cleaning up our toxic sites,” Tittel said. “This is clearly one of the biggest sellouts and largest subsidies in state history.”
BY JOHN REITMEYER, ILYA MARRITZ, AND SUSAN BERFIELD
DECEMBER 15, 2016 NJ SPOTLIGHT SERIES: PART 4 OF 5
John Reitmeyer is the budget and public finance writer for NJ Spotlight. Ilya Marritz is a reporter/producer for WNYC. Susan Berfield is a reporter for Bloomberg Businessweek.
NJ Spotlight, an independent online news service on issues critical to New Jersey, makes its in-depth reporting available to NewsWorks.
The Mall Madness series continues tomorrow with a closer look at politics and the American Dream project, including campaign contributions from lawyers, government officials and others involved in the project. The series was produced through a reporting collaboration between WNYC, NJ Spotlight, and Bloomberg Businessweek.
They’re bringing in new investors, big and small, to disperse the power and lower interest rates. It’s already paying off for some governments.
For all the post-recession financial market reforms, few ultimately made their way to the municipal bond market. For the most part, the muni market remains a low-tech place by Wall Street standards, and one that’s still largely controlled by the same group of big investors.
“The muni market has a lot to do with relationships, power and influence,” said Rob Novembre, a former trader who has spearheaded a new alternative bond trading system. “The bigger you are as an account, the more attention you get from sellers. If you buy bigger blocks [of bonds], that gets you more power.”
Thanks to Novembre’s new startup and another in San Francisco, though, that’s starting to change. The two companies are not only set to give the market a tech update but also to bring it more buyers. The idea is that more buyers will increase demand for municipal bonds and, in turn, will net governments lower interest rates on their debt.
The startup in San Francisco, Neighborly, goes about finding new buyers by marketing muni bonds to investors with a personal or social interest in the project those bonds are funding. A key component of Neighborly’s tactic is that it uses technology to cut down on the costs associated with brokering bonds. This allows it to sell the bonds directly to individuals and in smaller denominations — such as $1,000 blocks — than is typical.
“Like any financial product, it’s supply and demand,” said head of public finance, James McIntyre. “What we’re trying to do is increase the demand side … by helping individuals and institutions find the bonds that meet their investment criteria.”
Neighborly recently announced six projects it plans to help take to market next year, ranging from parks improvements in Burlington, Vt., to a new fire truck for Lawrence, Kan.
The other startup, ClarityBidRate, brings in new buyers by focusing on variable rate debt, which went out of fashion after the 2008 market collapse but is making a comeback in the current low interest rate environment. Unlike a 30-year bond that pays out the same “fixed” interest rate for the life of the bond, variable rate debt’s interest rates reset weekly. It’s a way of paying short-term rates, which are lower, for debt that is long term.
Traditionally, marketing agents for an issuer reset the interest rate themselves. The rate is determined by what the buyers who work with that agent’s trading desk will accept. But Novembre’s Clarity sidesteps the middleman and essentially works like an electronic stock exchange solely for variable rate debt. So instead of an agent resetting the price, buyers bid on the bonds every week. The buyers aren’t just big institutions but anyone who has signed up to trade on the platform. The interest rate is set by the lowest price for which the bonds will sell each week.
Clarity has already drawn the attention of Ohio, which recently put $32.3 million of its variable rate debt on the platform. Up until now, rate-setting by marketing agents has been done “in a black box,” said Seth Metcalf, the state’s deputy treasurer. Metcalf says he’s never sure if he’s getting the best possible interest rate every week on his debt.
“I want to trust these people but … I’m concerned there’s disproportionate influence within the buyers’ market,” he said.
The experiment is paying off. On the fifth interest rate reset, Ohio’s variable rate debt fetched a better interest rate on Clarity than the industry average for issuers like Ohio. The rate even beat three of the four marketing agents that Ohio has working on a separate package of variable rate debt it issued through traditional channels.
Clarity also gives sellers the benefit of seeing real-time information about who’s buying his debt, and he’s been pleased to find that it is indeed attracting buyers large and small.
“It democratizes power,” he said. “It doesn’t matter if you’re a little broker dealer in small town Ohio or the largest fund in the world. I’m going to pay the best interest rate that somebody’s willing to take.”
GOVERNING.COM
BY LIZ FARMER | DECEMBER 15, 2016
A roundup of money (and other) news governments can use.
GOVERNING.COM
BY LIZ FARMER | DECEMBER 16, 2016
Stimulus talk is driving a sell-off but there is a positive side
The US president-elect poses a triple threat to the country’s municipal bond market. This has been the conclusion of investors in the wake of Donald Trump’s election — and why the $3.8tn market for state and local government debt has suffered some of the sharpest selling seen in fixed income markets. A recovery over the past few days was then cut short by a warning from Janet Yellen, the Federal Reserve chair, that monetary tightening may be more aggressive than expected next year.
Here is the trio of concerns.
First (and not unique to municipal bonds), a Trumpian stimulus from tax cuts and infrastructure spending would raise interest rates and hit the bond market generally.
FINANCIAL TIMES
DECEMBER 15, 2016 by: Stephen Foley
Municipal debt volume will come in at $395 billion next year, down an estimated 13 percent from 2016 levels as the incoming Trump administration’s impact on economic growth will fall short of expectations, an investment bank said on Tuesday.
“Our volume forecast assumes the President-elect will have less success in stimulating the economy, and therefore, interest rates will not rise to the same degree as the market generally expects,” Loop Capital Markets said in a forecast note.
Sales of municipal bonds and notes in 2016 are likely to set a new record, with a volume of $445 billion, outpacing the previous high-water mark set in 2010 of $433.3 billion, Chicago-based Loop Capital said.
New money volume into the market should represent the largest year-over-year increase during the period of new money austerity, which started in 2011 and has continued in the years since, Loop Capital said.
Supply in the $3.7 trillion U.S. municipal market surged during the second half of the year as states, city and other public agencies clamored to sell bonds and notes at low interest rates.
The Federal Reserve is expected to announce a quarter-point increase in interest rates on Wednesday, and experts anticipate additional increases in 2017.
Reuters
By Rory Carroll
Tue Dec 13, 2016 | 4:34pm EST
(Reporting by Rory Carroll; Editing by Jonathan Oatis)
Municipal bond markets are healthy, especially relative to overleverage in the US Treasury and US corporate bond markets, according to Peter Coffin, president of Breckinridge Capital Advisors.
A 30-year veteran municipal bond analyst and portfolio manager, Coffin gave his thoughts on major trends in the US municipal bond markets, including possible scenarios in the post-election world, at the CFA Institute Conference: Fixed-Income Management 2016.
Favorable supply and demand dynamics, combined with greater transparency and disclosure by municipalities, have recently made these markets more attractive to investors. However, Coffin issued a caution on the “chronically distressed” state and local governments that continue to “kick the debt can down the road” until the inevitable day of reckoning.
Evolution of the Municipal Market Since the Financial Crisis
The US municipal bond markets have been “changing for the good” in terms of disclosure and reporting since the financial crisis, Coffin observed.
Prior to 2008, it was sometimes difficult to for active municipal bond managers to demonstrate their value-add to performance. Because of widespread municipal bond insurance, Coffin said, moral hazard and complacency on the part of issuers and investors had crept into the municipal bond markets.
Everything changed during the financial crisis with the near demise of municipal bond insurers. Investors had to adapt to a new framework. “Today investors are much better equipped,” Coffin noted. There are more repositories of financial information — from specialty research and data providers to ratings agencies. “In 2011, only 60,000 municipalities filed financial statements,” he said. “This year, it’s over 100,000 and growing.”
Municipal bonds were the one part of the bond world that didn’t over-lever in the period leading up to the financial crisis, and more recently, during the zero interest-rate policy (ZIRP) period. One of the primary reasons for this: State and local municipalities have constitutional or statutory restrictions on the amount of debt they can issue. “In the 1840s, when half the states defaulted to Europe, many state and local constitutions were rewritten so it would never happen again,” said Coffin. These laws have endured, so voter referendums are required to issue debt — a definite disincentive for local officials.
Supply and Demand Factors: Different from Other Bond Markets
Annual municipal bond issuance is still relatively moderate compared with corporate bonds and Treasuries, with the overall size of the market at $3.7 trillion. “We’re only replacing what’s being retired,” Coffin said.
With over 40,000 issuers, municipal bond markets are unique. After six months, individual issues trade infrequently or not at all. Retail investors buy the bonds for tax-free income and are often reluctant to sell and convert their investments to a taxable capital gain. This long-term perspective adds to the stability and resilience of these markets. “To me, it’s like standing on the bank of a river,” Coffin said. “There’s a constant flow of new issues. We’re looking upstream to see what’s coming. Then it trades and goes away.”
On the demand side, strong cash continues to flow into the sector, bolstered by demographic trends. Baby boomers with their eye on their retirement years are looking for investments with “a little more income and a little less risk,” Coffin said. Over the long term, this bodes well for the bond market.
Of course, tax free does not mean risk free. In our low interest rate environment, Coffin worries that retail investors are stretching for yield without understanding the duration risk, as mutual fund data suggests many have moved out of money market funds into higher yielding bond funds. “I don’t know how well equipped they are to cope with the risks,” he said.
Volatility, Regulation, and Liquidity
Volatility in the municipal bond market comes from several factors. “It’s a challenge for dealers to hedge municipal bond risks because there’s no investable index,” Coffin said. “Trading in these markets is a little sloppy and they’re more prone than other bonds to be oversold or overbought.” As with the corporate bond sector, the Dodd-Frank Wall Street Reform and Consumer Protection Act and other banking regulations have caused dealers to reduce their municipal bond inventories. Coffin is concerned about Wall Street’s capacity to help in a liquidity crisis.
Short-term municipal bonds have experienced a decrease in value due to the SEC’s Money Market Fund Reform Rules that were supposed to help the stability of shorter-term securities. Investors have pulled $64 billion out of municipal money market mutual funds, preferring to invest instead in government-only money market funds not subject to the reform rules requiring floating net asset values, liquidity fees, and gates in certain conditions. “Municipal bonds experienced an unusual 45 bps increase in the one-year spot rate this year,” Coffin observed.
Regulators have also been pushing hard on local government officials. One example occurred when the SEC brought fraud charges against the mayor of Harrisburg, Pennsylvania, after he gave a speech that painted “too rosy” an economic forecast.
Opportunities in Taxable Municipals
Larger muni-bond issues, such as bonds issued by the Greater Orlando Aviation Authority in October 2016, usually come to market with a tax-exempt portion, an alternative minimum tax portion, and a taxable portion. Because of their relative attractiveness and higher yield, taxable municipal bonds are more interesting to institutional investors, particularly foreign investors that can list them as US government bonds on their balance sheets. Coffin observed, “If we have sweeping tax reform (a high priority of the Trump administration), you may see more taxable municipals coming.”
Coffin also noted that in the taxable municipal bond market, investors can expect liquidity on par with the tax-free munis issued by the same entity. He added that during the financial crisis, taxable municipal bond values actually held up better than corporate bonds and had less correlation with equities. The significantly lower historic default risk of taxable munis versus corporates accounts for their relatively solid performance.
General Obligation (GO) vs. Revenue Bonds
Recent significant haircuts to creditors in the distressed general obligation (GO) bond market had investors turning their focus to revenue bonds. “In bankruptcy situations, outcomes are much less certain today for GOs,” Coffin said. The Detroit bankruptcy was a case in point. There, a federal judge affirmed that bankruptcy law superseded state laws protecting pensions and contracts. But Coffin noted that after the GO bonds and other Detroit debt were restructured, bondholders recovered just a little over 70 cents on the dollar. “I tell people, I have a front-row seat to the epic struggle between labor and capital,” he said, “and round one has gone to labor.”
Coffin advises investors to be very selective and opportunistic in the “chronically distressed” issues. BCA Research deemed the combined obligations of certain states — New Jersey, Hawaii, Connecticut, Illinois, Kentucky, Alaska, and Massachusetts — the “elephant in the room.” Coffin noted that “these states are woefully underfunded,” taking into account the high debt, underfunded pension obligations, and other post-employment benefits (OPEB) such as health care.
Not only does New Jersey have high combined obligations, but the state was also hit with a subpar economic recovery that led to a political impasse. The state negotiated with the state employees’ unions to extend retirement ages and reduce benefits and cost of living allowances in exchange for the state’s promise to make scheduled contributions to the pension funds. The New Jersey government failed to make the promised pension contributions and said it was not under a contractual obligation to do so. The unions sued and the state supreme court upheld the state’s right not to fund. “These problems will ultimately get resolved, but right now they’re getting worse and worse,” Coffin said.
Resolution needs to begin soon. As Coffin stated, the “hope is once we get through the US presidential election, there is meaningful restructuring.”
Despite the chronically distressed issuers, Coffin applauded the recent resiliency of the municipal bond markets. “Municipal bond investors were able to look through situations like San Bernadino, California; Jefferson County, Alabama; Stockton, California; and Puerto Rico,” he said. He doesn’t believe this will be the norm going forward, however. “Bankruptcy is a very unlikely scenario for the vast majority of bonds,” Coffin observed. “Politicians can’t just repudiate their debt.” In most cases, the law will focus on the municipality’s “full faith and credit” obligation and say that taxes should be raised.
Municipal Bonds as the Most Sustainable Investment
Coffin never takes the tax-exempt status of municipal bonds for granted, but with favorable supply and demand dynamics and a modestly improving US economy, the sector continues to look attractive. Property taxes are improving as a result of increased real estate values at the local level. Sales and excise taxes, particularly in the oil and gas states, are cyclical, which has been reflected in widening spreads. Coffin is more cautious and selective in health care, a sector that has been performing well.
He encourages investment managers to talk more about municipal bonds as sustainable investments. “What could be better than investing in local infrastructure, health care, and education?” he asked. “We need to talk more about the positive impact municipal bond financing has on a local community. It allows small communities access to capital, and that’s a good thing for our country.”
Enterprising Investor
14 December 2016
By Julie Hammond, CFA
NEW YORK — The past year has meant a wild ride for investors in municipal bond funds.
Between September 2015 and this past October, municipal bond funds had 54 straight weeks of inflows, with investors pouring some $68 billion into them. Muni fund owners were rewarded handsomely: In the first six months of 2016, the BlackRock Strategic Municipal Opportunities fund returned 4.7 percent, for example. The 10-year yield on the AP Municipal Bond index, which moves inversely to bond prices, hit a low of 1.69 percent in July.
Then the bear came out roaring.
In early October, the flow of dollars into muni funds stalled as bets increased that the Federal Reserve would raise interest rates late this year. Selling accelerated after Donald Trump’s surprise victory on expectations that his plans to boost economic growth would hurt the price of bonds. In November alone, investors yanked over $10 billion from muni funds, according to the Investment Company Institute. BlackRock’s Strategic Municipal Opportunities fund fell 4.4 percent.
Peter Hayes, co-manager of the $4.7 billion BlackRock Strategic Municipal Opportunities fund, recently talked about the about-face for munis, and how investors can best navigate the current uncertainties. Answers have been edited for length and clarity.
Q: Muni bonds have just undergone an intense sell-off. Do you think it has gone too far?
A: Well, every big sell-off winds up being a good long-term buying opportunity, at some point. It’s a question of finding the right entry point.
This sell-off has been so dramatic that it created value in a short amount of time. Municipal bonds are yielding more than Treasurys right now, and last week we began to see some stabilization of the market.
But given the headwinds, I’m not sure we are completely out of the woods yet.
Q: Which headwinds worry you the most?
A: Interest rates continue to be a concern. If rates go higher, that will scare investors from long-term assets.
Q: What about tax rates? Some believe that the Trump administration will slash tax rates for higher earners, which would diminish the value of muni bonds’ tax-free income.
A: That’s a potential headwind as well, but it’s much longer term. I think we need to get past the inauguration and see what the new administration is really most concerned with.
Q: With all the talk of tax reform, some have wondered if the municipal tax exception could be at risk.
A: We emphatically don’t believe that we will lose the muni tax exemption. Taxes are a bit of an overhang to the market, but a lot of that’s already been factored into the price of the bonds today.
Q: Sounds like taxes are a wildcard. But it does seem likely that President-elect Trump will try to boost infrastructure spending. How do you think that will impact the muni market?
A: The initial reaction to the infrastructure proposals was that it would be negative, because it would mean more issuance in the muni market. That is usually a headwind for performance, given that we don’t know what the demand is going to be.
But if you really look at the Republican proposals, they’re talking about an infrastructure bank and private tax credits. That doesn’t translate into increased muni issuances.
It’s also important to keep in mind that this year, about 60 percent of new issuance was related to issuers that were refinancing their debt.
If rates move higher, refunding will be less attractive. So I don’t see the current proposal as we know it today translating into higher issuance in the muni market in 2017, especially if the first half of the year is driven by all this insecurity around tax policy. Altogether, I don’t see infrastructure as a big headwind.
Q: So what’s the best strategy for investors right now?
If you already own munis, don’t sell. The market has already sold off significantly.
If you need a bit of income and want to take a position, shorter-term bonds look cheap. For the most part, stay in the three- to five-year range, where you will be less exposed to a change in tax policy and a potential rise in longer-term interest rates. Because the correction has been so large, those looking for more income might want to put a portion of their money in the 10- to 15-year part of the curve.
Otherwise, I suggest waiting on the sidelines. The severity and size of the move is likely to have scared investors. The next several weeks are very important. If the fund flows continue to be very negative, we have to be cautious. If they stabilize, then I think we can be more confident that the worst is over.
The Associated Press
by Cybele Weisser
1 p.m. EST December 13, 2016
GASB Chairman David A. Vaudt recently appointed a task force to assist with the Board’s objective of developing a comprehensive application model for the recognition of revenues and expenses that arise from nonexchange, exchange, and exchange-like transactions.
On Tuesday, December 13, leading groups met in Washington, D.C., to discuss the key issues facing U.S. infrastructure. SIFMA’s Michael Decker discussed muni bonds, stating, “Muni bonds finance 75% of US infrastructure. It’s important to preserve their tax-exempt status.”
Powered by P3 INGENIUM: the most comprehensive source for P3 project updates in North America.
NCPPP
StonebridgeCarras, LLC, is a real estate development and investment firm whose portfolio includes several of the Washington, D.C., region’s most successful mixed-use projects, which are built near public transit and feature a combination of office, retail, residential and hotel space. One example is the transformation of two county-owned parking lots in suburban Bethesda, Md., into The Darcy and The Flats. This project, which opened in June 2015, has increased Montgomery County’s residential and commercial tax base, added affordable housing, and enhanced a portion of a public trail while improving the quality and availability of public parking in a very busy dining and shopping destination. We asked Jane Galbraith Mahaffie, a principal at StonebridgeCarras, to talk about the project and provide an overview of other P3 projects in the StonebridgeCarras portfolio.
NCPPP: Describe your role at StonebridgeCarras, both generally and in terms of your participation in development of The Darcy and The Flats.
JM: At StonebridgeCarras (SC) I am one of two principals who oversee the entitlement and development of all SC projects. In this role I direct the multi-faceted mixed-use developments and public-private initiatives with a combined value of more than $1 billion. The Darcy/Flats are a great example of the public–private projects that SC is involved in. At over $200 million it included both private and public partners and required extensive entitlement processes and community outreach. My role at SC is quite directed to leading the firm’s efforts on the public/private partnership projects in the Washington metropolitan area.
NCPPP: What organizations did StonebridgeCarras partner with to build The Darcy and The Flats and what were their roles?
JM: Montgomery County Department of Transportation (MCDOT) was the public entity responsible for The Darcy/Flats development. The team of StonebridgeCarras and PN Hoffman joined forces and responded to the request for proposals that MCDOT issued in 2004. That team, Lot 31 Associates, remained partners throughout the project. Northwestern Mutual Life Insurance and Buvermo Investments joined the team as additional debt/equity investors in the project.
MCDOT was a very active partner throughout the development, and at the conclusion of the development, they own the 900-space public parking garage in the project. PN Hoffman and SC became a completely integrated team in project management, construction oversight, leasing and condominium sales of the project. It was a bit unusual, but the teams really worked well together.
NCPPP: What types of challenges did you encounter in conducting this project and how did you overcome them?
JM: The project was 3.3 acres in the heart of Bethesda. Given the size of the garage the schedule was an additional one year of construction, predominantly all below-grade work. We shut down a road for the construction and were adjacent to both residential mid-rise and high-rise and single-family homes. The garage was designed in a way that included a large transfer beam at the ground level that had post tension beams taller than me. Then above grade were two residential buildings with 40,000 square feet of retail, reconstruction of a road (now effectively a bridge above the garage) and significant public outdoor space.
The greatest challenge was the schedule, the understanding that we were really constructing three projects, and the public expectations. When you have significant below-grade work, the schedule runs through many seasons. In Washington, D.C., where you have four true seasons, site and foundation–to-grade work is very susceptible to weather. As it happened, the two winter seasons during below-grade work/foundation-to-grade were horrific in D.C. Success came with adjusting schedules and working with the county and adjoining neighbors. Additionally, when you have three projects in one, you have efficiencies but not in every category. Manpower adjustments had to be made by us, the design team and the contractor to successfully navigate some significant issues because we were working with three distinct projects.
P3 projects naturally have expectations by the public. In The Darcy/Flats we had road closures and a significant area under construction in a major downtown area of Bethesda. Our team very quickly established a bimonthly newsletter that was widely distributed among neighbors, our county partners, county regulators and elected officials. We also established working teams among agencies to react quickly as needed. These were just some aspects of additional communication that is clearly required in P3 projects.
NCPPP: What lessons did the firm learn in pursuing this project?
JM: Every project presents its own opportunities and challenges. The Darcy/Flats was a very exposed project (locational). Communication and flexibility surrounding schedules was a key element learned on this project.
NCPPP: How was this project similar to projects your firm usually leads? What were some of the significant differences?
JM: SC develops very complex multi-faceted mixed use projects. The degree of difficulty was similar to many that we have developed and are in our pipeline. As a P3 project, it was similar in understanding that P3 projects bring many constituents and varied expectations. As noted above, the most significant difference was the size below grade and the multiple implications that 500,000 feet below grade presented in schedule and technical challenges.
NCPP: Can you describe other P3 projects StonebridgeCarras is conducting or plans to pursue?
JM: SC and our joint venture partner, Bozzuto, were awarded a P3 project with Montgomery County to develop a new headquarters for Maryland-National Capital Park and Planning Commission (M-NCPPC) that includes leased space for significant Montgomery County agencies. This 300,000- -square-foot building will begin construction in 2017. It also includes a public parking garage and significant town square in downtown Wheaton. At the conclusion of its construction, SC/Bozzuto will retain the land currently housing M-NCPPC for private development.
In the District of Columbia, SC and our joint development partners, ProFish and The Jarvis Companies, will be developing a residential, retail, and industrial mixed-use project including renovating the historic Crummell School for the community in the Ivy City neighborhood. This project is exciting as it retains a neighborhood industrial company with the development of additional retail and residential, including affordable housing. In addition, the development team will be working with the community as we together prescribe the uses to be housed in the renovated school.
NCPPP: How is the landscape for real estate P3 projects changing? What interesting trends have you observed since the start of the recession?
JM: I think that P3 projects continue to be a great vehicle for both the public entities and the private developers. Public agencies provide a site previously unavailable to the private market, which benefits both groups. Public agencies can also benefit from the opportunity of more private financing of projects that benefit communities. I am not sure if directly observed as result of the recession, but I think that as the P3 model has matured, the projects tend to be more complex in both opportunity and expectations. P3 projects are not for the faint at heart. Firms responding have to understand the complexity of the deals and time required for a successful development.
NCPPP
December 19, 2016
Fitch Ratings-New York-13 December 2016: Although the upcoming change in federal administration introduces significant uncertainty for U.S. states, the U.S. State outlook for 2017 remains stable on credit stability and the states’ strong powers, according to a Fitch Ratings report. Both the rating and sector outlooks are stable for 2017.
“At this early stage it is not possible to predict what policy choices will be made by the Trump administration, or what they will mean for states,” said Laura Porter, Managing Director.
“The transition of federal administrations creates many uncertainties for U.S. states, which are exposed to policies affecting the U.S. and global economies, as well as decisions related to jointly funded programs.”
Federal changes with a significant impact on states are generally implemented in a way that allows states to adjust, taking advantage of their strong powers to manage budgets and download fiscal challenges.
President-elect Trump’s proposal to convert Medicaid to a block grant program, if enacted, would likely lead to materially lower federal funding to states. Reduced Medicaid aid could cause states to tighten overall spending and reduce transfers to local governments.
“The biggest concern would be decisions that shift costs from the federal government to states while continuing service level mandates,” said Porter.
The Trump administration’s trade policy proposals could be significant for both state economies and revenues, particularly for state economies with pronounced links outside the U.S. Immigration policy changes could also have specific sector or regional implications.
The likelihood of federal tax cuts in 2017 could lead to volatility in personal and corporate income tax revenues for the current fiscal year as taxpayers consider shifting income to 2017 to take advantage of lower rates. The effects could reverberate for several years, similarly to the 2013 federal tax law changes.
If the federal government enacts fiscal stimulus simultaneously with tax cuts, it may mean higher federal debt, higher inflation and higher rates. This could put wage pressure on states and locals, raise borrowing costs, create headwinds for export-oriented sectors, and, positively, potentially help pension returns, though for the latter this could be offset by higher cost of living adjustments.
Fitch will hold a teleconference on Jan. 12th at 2:00 pm eastern to discuss its 2017 U.S. state and local government outlooks. To register for the call, please visit http://dpregister.com/10097550.
For more information, a special report titled “2017 Outlook: US States” is available at www.fitchratings.com.
Contact:
Laura Porter
Managing Director
+1-212-908-0575
Fitch Ratings, Inc.
33 Whitehall Street
New York, NY 10004
Marcy Block
Senior Director
+1-212-908-0239
Eric Kim
Director
+1-212-908-0241
Karen Krop
Senior Director
+1-212-908-0661
Douglas Offerman
Senior Director
+1-212-908-0889.
Media Relations: Elizabeth Fogerty, New York, Tel: +1 (212) 908 0526, Email: elizabeth.fogerty@fitchratings.com.
Many critics of President-elect Donald Trump’s infrastructure plans are missing the point. He doesn’t want to pour hundreds of billions of dollars into upgrading roads, bridges and airports to give the economy a Keynesian jolt. Creating jobs isn’t even his primary goal. He wants visible symbols of competence and pride. “We’re becoming a third world country, because of our infrastructure, our airports, our roads,” Trump said when he announced his candidacy. He repeated the theme throughout the campaign.
Trump sometimes sounds like a jet-setting Davos Man, as he bellyaches about airports in New York and Los Angeles compared with those in Doha and Shanghai: our old metropolitan airports versus their sparkling new international hubs. (Has he never been through Denver or Minneapolis?) He is, however, voicing a frustration that unites Americans across the economic and political spectrums. You know there’s a highway problem when a popular rock song includes the lyrics, “I’m driving here I sit/Cursing my government/For not using my taxes to fill holes with more cement.” (The hit duo Twenty One Pilots is even from the political battleground of central Ohio.) Rundown airports and pitted roadways are everyday reminders that the government isn’t doing its job.
Because Democrats also like the idea of infrastructure spending (although many prefer metro rail systems over roads), a bipartisan deal seems possible early in the Trump administration. The question, then, is how can Trump live up to his promises and not simply waste a lot of money? What’s the best way to pick projects? What are the barriers to the quality infrastructure and speedy construction that his supporters expect? And how do we pay for all this?
What to build: The worst possible thing Trump could do is take the advice to “build something inspiring,” as James B. Stewart put it in the New York Times. Lavishing money on a few showcase projects won’t do anything for Trump’s trucking-company friend who complains that he has to buy “the cheapest trucks and the strongest tires” because the highways are so bad. It wouldn’t improve most Americans’ everyday experiences. Repairing roads may not be as inspiring as an optimistically priced $100 billion maglev train from Washington to Boston, but it’s likely to create much more value for the money.
“You’re building projects that have to be maintained and run for decades, and if costs are higher than benefits or the revenues, that means that they will be a drag on the economy,” observes Bent Flyvbjerg, a professor at Oxford University’s Said Business School who studies major infrastructure projects. To identify and support high-value projects, he recommends giving states and municipalities block grants and the freedom to decide how to spend the money. As long as there’s accountability to avoid corruption, decentralized decision-makers are more likely to respond to local needs — especially when they don’t have to sell federal officials on the sexiness of a given project. It’s an approach Scandinavian countries have used successfully. “If Trump’s infrastructure plans would involve actually fixing local problems, maintaining the existing infrastructure to a high level of quality, that would be a great thing,” Flyvbjerg says.
What to reform: Like many infrastructure enthusiasts, including Trump adviser Steve Bannon, Stewart is nostalgic for Depression-era projects. In his Times piece, he writes that President Franklin Roosevelt’s
Public Works Administration and Works Progress Administration, using combinations of public and private money, solicited proposals from states and cities, hired millions of workers and eventually built 78,000 bridges, 650,000 miles of roads, 700 miles of airport runways, 13,000 playgrounds and 125,000 military and civilian buildings, including more than 40,000 schools — in most cases to high standards of quality and design.
Note, first of all, that it was the many relatively small projects, not the few showcases, that transformed America. They’re why people remember those New Deal programs as public benefactors.
Then consider how long it takes to get anything built today. The bottleneck isn’t the actual construction. It’s the ever-more-detailed analyses, reviews and redesigns required — and often litigated — beforehand. For a megaproject, actual construction takes three or four years, estimates Robert D. Thornton, a Los Angeles lawyer who advises state and regional infrastructure authorities on environmental issues. Before that three or four years starts, however, “the planning and design process will be 10 to 15 years,” he says. Thornton recalls a conference of road builders where company after company boasted of getting projects done in 20 years. “I got up and said, ‘In any other business you’d be out of business, because you couldn’t take 20 years to deliver a product,’” he says. “But in transportation, we just accept it.”
To cut delays, Thornton recommends some simple procedural changes. Rather than reinventing and relitigating an air-quality model for each new project, local governments should be able to use the Federal Highway Administration’s model as a safe harbor. “Then the only issue is, Did they follow the model?” Similarly, to get federal transportation funding in the first place, a local government has to have an approved metropolitan transportation plan that meets Clean Air Act standards. Any new project that fits into the already-approved plan, Thornton argues, shouldn’t have to prove once again that it meets federal requirements. Like fixing potholes, these incremental reforms may not be glamorous, but they could significantly reduce the time and money it takes to deliver infrastructure improvements.
How to pay for it: Even if a new infrastructure bill decentralizes project selection and reforms the review process, the biggest challenge remains finding the money. Per-gallon gas tax revenue, the major source of transportation funds, is declining. Inflation has slowly eroded governments’ buying power, while better gas mileage has reduced the amount collected. But hybrid drivers still use the roads. The logical alternative is a tax per mile driven, with different weight classes to reflect degrees of wear and tear. It could be collected with an odometer reading before annual car registration. A mileage tax might also make all drivers, not just the ones with gas guzzlers, think twice about incremental trips, reducing traffic congestion. (Such mileage-based use taxes also shouldn’t go to fund other kinds of transit.)
The second major challenge is that the Interstate Highway System is a half century old. The highways weren’t designed to last much longer. That’s why Trump’s trucking pal complains that the highways have never been so bad. “You need to reconstruct and modernize — basically replace — the Interstate Highway System as it is right now,” says Robert Poole, director of transportation policy for the Reason Foundation. “There’s not a ghost of a chance of enough tax money being available in our lifetime to do that set of megaprojects.” (Disclosure: Poole was my boss in the 1990s, when I was editor of Reason magazine and he was president of the Reason Foundation.)
The good news is that international companies are eager to invest in U.S. infrastructure through public-private partnerships financed in the capital markets. Although rare in the U.S., such arrangements are common in Australia, Europe and Latin America. Once a project has made it through the planning and permitting process, investors bear most of the risk. (“They’ll take the construction risk and the completion risk, but they won’t take the environmental risk,” Thornton says.) Tolls, user fees or dedicated taxes provide a stream of revenue. The $1 trillion infrastructure plan prepared by Trump advisers Wilbur Ross and Peter Navarro envisions extensive use of such partnerships “to a magnitude that would be up to the task of the interstate system,” Poole says.
One such arrangement is already tackling Trump’s pet peeve: the sad state of LaGuardia Airport. The Port Authority of New York and New Jersey has set up a public-private partnership to replace the central terminal. Commercial partners will make money from fees charged to airlines and passengers — and from maximizing revenue from shops and restaurants. “This is the model,” Poole says. “When Margaret Thatcher privatized the British Airports Authority, BAA reinvented airport retail. They came up with the idea of competing, name-brand shops and restaurants, not the old generic food and beverage contractors and that was it.” The attractive, stimulating airports that travelers enjoy were invented not as public works but as a way to make money. If Trump thinks about infrastructure more like a businessman and less like a showman, we might just get everyday improvements we can also be proud of.
Bloomberg View
By Virginia Postrel
DEC 16, 2016 9:00 AM EST
This column does not necessarily reflect the opinion of the editorial board or Bloomberg LP and its owners.
Virginia Postrel is a Bloomberg View columnist. She was the editor of Reason magazine and a columnist for the Wall Street Journal, the Atlantic, the New York Times and Forbes. Her books include “The Power of Glamour” and “The Future and Its Enemies.”
To contact the author of this story:
Virginia Postrel at vpostrel@bloomberg.net
To contact the editor responsible for this story:
Stacey Shick at sshick@bloomberg.net
Taylor Riggs, a contributor to Bloomberg Briefs, talks with Joe Mysak about this week’s municipal market news.
Bloomberg
December 15, 2016
NEW YORK, NY (December 8, 2016) – Kroll Bond Rating Agency (KBRA) has assigned a BBB long-term rating and Negative outlook to the Board of Education of the City of Chicago (the “Board”) Dedicated Capital Improvement Tax Bonds, Series 2016. KBRA also affirms the BBB rating and Negative outlook on the Board’s Unlimited Tax General Obligation Bonds (Dedicated Revenues), Series 2016A and Series 2016B and affirms the BBB- rating and Negative outlook on the Board’s Unlimited Tax General Obligation Bonds (Dedicated Alternate Revenues).
The rating is based on two KBRA methodologies, primarily the General Property Tax/Assessment Revenue Methodology and secondarily the U.S. Local Government General Obligation Rating Methodology.
To view the report, please click here.
Dec. 9, 2016
A new type of debt for the Chicago Public Schools (CPS) earned an investment-grade rating of A from Fitch Ratings on Thursday, based on the bonds’ ability to withstand a potential bankruptcy filing by the financially struggling district.
The A rating on $500 million of capital improvement tax bonds is eight steps above the junk rating of B-plus with a negative outlook Fitch has assigned the school system’s $6.8 billion of outstanding general obligation bonds.
Fitch attributed the difference to its assessment “that the pledged revenues meet the definition of ‘special revenues’ under the U.S. Bankruptcy Code and therefore, bondholders are legally insulated from any operating risk of the board.”
The United States’ third-largest public school system is struggling with pension payments that will jump to about $720 million this fiscal year from $676 million in fiscal 2016, as well as drained reserves and debt dependency. The fiscal woes have pushed its GO credit ratings deep into the junk category and led investors to demand fat yields for its debt.
The $500 million of bonds will be secured solely by a capital improvement property tax approved by the Chicago City Council last year and not by the district’s GO pledge. The property tax revenue, initially totaling $45 million, can only be used to fund capital projects and not operations, and is subject to an intercept mechanism that will send the funds directly to the bond trustee.
CPS cannot currently file for municipal bankruptcy in Illinois, although there have been proposals to change state law to allow such a move.
Fitch said legal opinions for the new bonds “provide a reasonable basis for concluding that the tax revenues levied to repay the bonds would be considered ‘pledged special revenues.'” The opinions on a “hypothetical bankruptcy” by CPS concluded that payments on the new bonds would not be automatically stopped by a federal bankruptcy court and that bondholders would retain a lien on the tax revenue.
Reuters
Thu Dec 8, 2016 | 12:44pm EST
(Reporting By Karen Pierog; Editing by Jonathan Oatis)
The recent advisory discusses a recent Third Circuit Court of Appeals ruling that held a “make-whole” optional redemption premium to be due upon a refinancing of corporate debt following its automatic acceleration upon bankruptcy. As noted in the linked advisory, the Second Circuit Court of Appeals also is considering this issue; whether it will come to the same conclusion remains to be seen. One way or another, these decisions will have spillover effect on judicial interpretation of optional redemption provisions in municipal bond transactions, and shine a spotlight upon the discrepancies between optional redemption provisions and other early payment provisions in most municipal bond indentures.
The Third Circuit case involved a debtor, Energy Future Holdings, that filed for bankruptcy for the explicit purpose of refinancing the debt at favorable interest rates while avoiding the hefty make-whole premiums payable upon an optional redemption of the refinanced notes. The bankruptcy court and the federal district court found nothing in the applicable corporate indenture requiring payment of a make-whole following an acceleration. The Third Circuit reversed, interpreting the applicable corporate indenture’s “optional redemption” provisions to be applicable to the bankruptcy-triggered acceleration followed by repayment of the accelerated debt via a refinancing.
The Third Circuit’s ruling that the repayment following acceleration was an “optional redemption” may have been driven by the factual context of what could be characterized as an “optional bankruptcy” filed solely or primarily to jettison the make-whole payments and lock in lower rate replacement financing. The indenture’s acceleration provision was, as is usual, a remedial provision entirely separate from the indenture’s optional redemption provisions, and, as is typical but not universal, did not specify a premium to be due upon payment of the accelerated debt. Although once the accelerated payment was due there was nothing “optional” about paying it, the appellate panel opined that the payment on the applicable date was “optional” because the issuer chose to file for bankruptcy and chose not to deaccelerate the debt after the bankruptcy triggered the automatic acceleration. The fact that the bondholders objected to repayment without a make-whole premium also seems to have factored into the court’s determination that the payment by the issuer was “optional.”
The federal appellate court also concluded that under New York law a “redemption” may occur at or before maturity of bonds, and that therefore a “redemption” is not synonymous with a prepayment. (Indeed, the court suggested that if the make-whole premium had been labeled a “prepayment” premium rather than an “optional redemption” premium, it may have held the make-whole inapplicable, a curious distinction that leads back to the question of under what circumstances payment of an amount that has become due can be deemed optional.) The court disregarded indenture provisions that were technically inconsistent with its determination that the payment was an “optional redemption”, such as the optional redemption requirement of prior notice from the issuer to the bondholders. According to the court: “[The issuer] offers no reason why it could not have complied with [the redemption] notice procedures. In any event, it cannot use its own failure to notify to absolve its duty to pay the make-whole.”
By interpreting the indenture’s optional redemption provisions as applicable to the payment of the accelerated debt, the Third Circuit panel mooted and declined to address the noteholders’ alternate argument that the bankruptcy court should have granted relief from the bankruptcy stay to permit the bondholders to deaccelerate the accelerated debt. Whether that would have provided a more straightforward means of getting to the same result is debatable, as debt generally is deemed accelerated upon a bankruptcy whether or not it is contractually accelerated by the terms of the indenture.
The optional redemption provisions that are typical in municipal bond indentures refute the equivalence found by the Third Circuit between an optional redemption and a payment after acceleration. In contrast to the permissibility in corporate transactions of optional redemption at any time at a make-whole premium, the norm in municipal bond transactions is a lockout period (often 10 years) during which optional redemption is impermissible, followed by a declining fixed optional redemption premium. The fact that municipal indentures permit acceleration whenever there is an event of default, including upon bankruptcy, while imposing a lockout period for optional redemption, suggests that in the municipal bond context there may be less receptiveness by courts to the notion of deemed equivalence between an optional redemption and a payment following acceleration. Accordingly, a court may be less likely to deem an optional redemption premium applicable to a post-acceleration payment on a municipal bond absent express language requiring a premium in a post-acceleration context.
Whether corporate or municipal bonds are at issue, the best way to ensure the intended result is to draft clearly and specifically. Municipal bond indentures often permit or require bonds to be paid ahead of schedule not only upon acceleration but upon a so-called extraordinary redemption. These provisions, which typically permit payment ahead of schedule at par, are infrequently deployed relative to optional redemption provisions. Use of bankruptcy as a means of avoiding a prepayment premium is less likely in the municipal context, where the prepayment premium is typically 3% or less versus the often substantially larger make-whole premium, but “default refundings” of municipal bonds have been attempted to circumvent the optional redemption lockout period. There is no difference in the economic impact to a bondholder of early payment, no matter the degree of optionality or lack of optionality from the issuer’s perspective, and whether an early payment premium is expressly provided by the indenture in cases other than “optional redemption” is primarily a risk allocation question.
Drafting acceleration provisions and/or extraordinary redemption provisions in a manner that applies an equivalent premium to the optional redemption premium upon their exercise during the post-lockout period, and a make-whole or other premium during the optional redemption lockout period, provides better protection against any perceived risk of abuse of those provisions than reliance on the courts to figure out what the parties intended and/or is equitable in borderline scenarios.
Mintz, Levin, Cohn, Ferris, Glovsky and Popeo, P.C.
Tuesday, December 6, 2016
by Leonard Weiser-Varon
Len is active in both municipal finance and corporate finance, with an emphasis on financings for 501(c)(3) institutions, project finance, secured lending, structured finance transactions, workouts and restructurings, corporate debt, and Section 529 college savings programs.
His practice includes service as bond counsel, issuer’s counsel, underwriters’ counsel, and counsel to institutional purchasers and borrowers in connection with public offerings and private placements of, and defaults and bankruptcies involving, tax-exempt and taxable debt for public, nonprofit, and corporate…
LWeiser-Varon@mintz.com
617-348-1758
www.mintz.com
www.publicfinancematters.com
©1994-2016 Mintz, Levin, Cohn, Ferris, Glovsky and Popeo, P.C. All Rights Reserved.
No government can be fully prepared for every economic twist and turn. Still, some are trying.
The Great Recession was uniquely devastating for states and localities because it hit all three major tax revenue sources: income, sales and property. It was a scenario that few, if any governments, were really prepared to absorb. As a result, governments were forced to make massive budget cuts.
Now, as the recovery trudges on longer than most, a growing number of states are making sure they aren’t blindsided by the next downturn.
Enter stress testing. The idea, which was borrowed from the U.S. Federal Reserve, essentially throws different economic scenarios at a state budget to see how revenues would be impacted.
“We’re in an environment where everyone is starting to think about the next downturn and what that’s going to look like,” said Emily Raimes, a Moody’s Investors Service analyst. “A stress test is a tool for states to think about what types of programs they should commit to and how much to save now.”
Credit rating agencies, in fact, are among the practice’s biggest fans. Earlier this year, Moody’s stress-tested budgets of the 20 most populous states and found that Missouri, Texas and Washington are in the best position to handle a recession because of their strong reserves, spending flexibility and lower revenue volatility. (Low revenue volatility means a state’s income doesn’t change too drastically from one year to the next. In other words, it’s more predictable.)
California and Illinois, however, found themselves at the other end of the spectrum in Moody’s stress test. California is endangered by its high revenue volatility and lower reserves, according to the report. And Illinois is vulnerable because of its extremely low reserves and inflexible governance.
S&P Global Ratings also stress-tests state budgets. In August, the agency performed a stress test on the top 10 borrowing states’ fiscal 2017 budgets. The scenario focused on what would happen if global economies like the United Kingdom or China slowed down more than anticipated.
The results — some of which overlap with Moody’s — show that Connecticut, Illinois, New Jersey and Pennsylvania are most likely to feel significant fiscal stress, while Florida, New York and Washington are best positioned for a downturn.
A few states are forging the way with their own stress-testing systems, while even more are looking into the idea.
Utah has the most robust practice, and it’s something credit rating agencies have held up as an example. Last year, the state tested its budgets against a moderate and severe recession — think 2001 versus 2008. The results told policymakers that Utah has enough in reserves to weather a moderate downturn, but a severe one would likely require cutting nearly $1 billion in spending over two to three years in addition to using most of the state’s reserves.
The process was so informative that Utah Office of Management and Budget Director Kristin Cox and her colleagues are developing additional scenarios to test. For instance, what happens to specific revenue streams if the state’s biomedical industry slows down? Or if oil prices shoot back up? (Utah’s stress testing is one of the reasons Governing recently awarded Cox with a Public Official of the Year award).
Minnesota also uses a form of stress testing to evaluate its revenue volatility and inform its rainy day fund policy. It’s one of just four states that requires periodic evaluations to make sure its savings targets actually reflect the state’s revenue volatility. It’s also the only state to determine its risk tolerance — that is, the tolerance policymakers have for not fully covering a potential shortfall. Its current savings target is the amount deemed necessary to cover 90 percent of all possible downturn scenarios.
California, which saw its revenues drop 20 percent during the Great Recession, recently started using stress tests. The state Legislative Analyst’s Office now includes estimates of what would happen to the state’s budget under an economic growth scenario and a mild recession scenario. The most recent analysis concludes that, in the event of a mild recession in 2018, the state would have enough reserves to cover most of its operating deficits through the 2020–2021 fiscal year.
Of course, no government can be fully prepared for every economic twist and turn.
“We’re trying to create certainty in an environment that is inherently uncertain,” said Cox. “Instead our approach should be, how prepared are we to respond to different scenarios?”
The unusual recession and equally unusual recovery period has sent the message to budget officials that they can’t afford to be caught unprepared. Since presenting Utah’s stress-testing methods at a National Conference of State Legislatures meeting, Legislative Fiscal Analyst Jonathan Ball said he’s gotten calls from Colorado, Nevada and Vermont, among others.
“It’s gotten a lot of traction,” he said. “We didn’t know if it was going to work at first. We’re kind of learning as we go and sharing our experience with other states.”
GOVERNING.COM
BY LIZ FARMER | DECEMBER 12, 2016
New York, December 07, 2016 — The outlook for US local governments will remain stable as the majority of the sector is underpinned by solid property tax revenues and healthy reserves, Moody’s Investors Service says. The outlook indicates fundamental business conditions over the next 12 -18 months.
Property taxes, the bedrock of local governments, remain healthy and will continue growing in 2017 owing to broader local tax base growth returns to pre-recession levels.
“A combination of property value growth and tax rate increases drove revenues 5.1% higher in the first half of 2016. We expect these factors will continue to support revenue growth of 3%-5% in 2017,” according to Moody’s Analyst Sarah Jensen.
Moody’s says reserve levels remain healthy for most local governments and provide budget flexibility. Most local governments will continue to actively raise revenues or cut spending as needed to maintain these reserves through 2017. Reserves provide flexibility for local governments in times of unexpected economic stress and unpredictable expenditures.
While manageable for most, overall fixed costs and growing balance sheet liabilities are a long-term drag on the sector. Fixed costs such as pension liabilities, debt service and other post-employment benefit (OPEBs) contributions could, if unaddressed, begin to crowd out essential services.
Infrastructure needs are becoming more pressing, and rising fixed costs could hamper the ability to issue debt to address this issue.
Despite general stability across the sector, there is a growing portion, roughly 5% -10% of issuers, facing numerous challenges pressuring their credit profiles. These local governments face revenue stagnation combined with growth in fixed costs, leading to a trend of credit deterioration.
Moody’s would change the outlook on the sector to positive if strong property tax revenue growth continues at 4%-5% and is accompanied by a stabilization of fixed costs and maintenance of healthy reserves. The sector outlook could change to negative if property tax revenue growth weakens to 1-2% or growth is outpaced by the increase in long-term liabilities and fixed costs.
“Financial challenges at the state level, particularly in states hit by low energy prices or budget imbalances, could impact some municipalities and school districts as states could either cut aid or shift fiscal responsibilities to local governments,” said Jensen.
“Local Governments — US: 2017 Outlook – Strong Tax Revenues, Healthy Reserves Drive Stability for Most.” Is available to Moody’s subscribers at
https://www.moodys.com/researchdocumentcontentpage.aspx?docid=PBM_1045982.
This report is part of a series of 2017 Credit Outlooks that provide insight into next year’s credit conditions across all sectors. See more at www.moodys.com/2017outlooks
A roundup of money (and other) news governments can use.
GOVERNING.COM
BY LIZ FARMER | DECEMBER 9, 2016
Los Angeles is spending billions to revamp its airport. The move is spurring other cities to make similar investments.
Twenty miles from downtown Los Angeles, squeezed between the Pacific Ocean and one of Southern California’s busiest freeways, sits 3,400 acres of bare pavement and neglected jet-age architecture that make up Los Angeles International Airport. These features are the first glimpse travelers get of a city with lofty aspirations. It’s not a pretty sight.
For decades, LAX has been known for crowded gates, drab terminals, scarce amenities and ungodly traffic. It’s a place that international visitors and lifelong Angelenos alike avoid if at all possible. That’s a troubling prospect for a region that thrives on tourism, international trade with Asia and Latin America, and industries such as defense and aerospace manufacturing that are heavily intertwined with global travel.
“There is no calling card like it to people who will invest, who will travel, who will study in your city than an airport,” says Los Angeles Mayor Eric Garcetti. “It is the first taste, the last taste, the first view, the last view. If you’re greeted with traffic, cigarette smoke, honking cars, people giving tickets and gridlock, you’ll say, ‘Oh, I guess this is what L.A. is like.’” That’s not the impression the mayor wishes to leave. Garcetti wants to refashion the airport around enhanced customer experiences that could put LAX in the top tier of airports globally, right next to Hong Kong, Munich, Seoul, Singapore and Tokyo. It is an incredibly ambitious goal, considering LAX ranks near the bottom of the world’s 100 biggest airports in passenger satisfaction. Nevertheless, Garcetti is undertaking a near-total transformation of the much-maligned but vital facility.
The first step in the process was a complete overhaul of LAX’s Tom Bradley International Terminal, a job which was finished three years ago. The revamped terminal includes 18 gates, half of which can handle the massive double-decker Airbus A380 jets, and a great hall the size of three football fields. The jagged roof, meant to evoke the waves of the Pacific Ocean, reaches heights of up to 110 feet. That allows arriving passengers to look out onto the light-bathed space from glass-enclosed passageways below as they travel to customs. In the great hall, huge LED screens project images of California scenery and digital art, as well as the usual advertisements and flight information. Passengers can while away their time at upscale shops including Armani and Porsche, or eat at one of 20 restaurants that run the gamut from KFC to a steakhouse with $51 ribeyes.
The last time LAX updated its international terminal was when the city hosted the 1984 Summer Olympic Games. By the time the torch is lit for the 2024 Olympics, which L.A. hopes to host, almost every corner of the airport is expected to be upgraded. The ongoing $14 billion plan includes expanding the international terminal, remodeling all the other terminals, potentially adding new domestic concourses, finishing up runway work, introducing more efficient security checkpoints, installing new baggage carousels, consolidating rental car facilities, building new parking structures and finally, after decades of promises, connecting LAX to L.A. Metro’s growing light rail network.
Los Angeles will have plenty of competition as it tries to build the best airport in the United States. After years of coping with cost-conscious airlines and accommodating ever-changing security processes, U.S. airports are turning their focus back to improving their product. Overall spending on airport capital improvements is expected to reach $13 billion a year by 2019, a 30 percent increase compared to the previous five-year period.
From LAX and San Francisco to New York and Atlanta, airport authorities hope better facilities can attract new customers, provide for bigger aircraft and shore up their bottom lines. And, if all goes according to plan, perhaps the remade airports will even boost the fortunes of the regions they serve.
Unlike other major airports, LAX is not dominated by any single airline. Each of the four major U.S. carriers claims at least one terminal there, but none has more than a fifth of the airport’s traffic. Still, LAX is being buffeted by the forces of consolidation that have reshaped the airline industry over the last two decades. Until recently, those forces have pushed terminal modernization and other airport improvements far down on the list of airline priorities.
The carriers shoulder the bulk of the cost of running airports, by renting terminal space and by paying weight-based landing fees for incoming flights. But the carriers also have a lot of say over infrastructure improvements. If they choose to, they can block new construction. Or they can cooperate and, as with many of the LAX improvements, even provide the initial money to pay for big projects (which the airport will pay back over time).
Since the turn of this century, airlines have had to contend with two recessions and sky-high oil prices. Bankruptcies and mergers have left four dominant domestic airlines: American, Delta, United and Southwest. As the airlines have tried to climb back to solvency, they’ve focused on becoming more efficient. One result of that has been further concentration of flights to major hubs such as Atlanta, Chicago, Dallas and Los Angeles.
But it’s not flight destinations that have forced airlines and airports to take a new look at their facilities: It’s the way flights are operated. To save money on their two biggest expenses — labor and fuel — airlines are flying bigger, fuller planes, but fewer of them. So a city that once had three flights a day to its hub airport, served by 50-seat regional jets, might now have only two flights a day on larger aircraft. The arrangement helps the airline save money on jet fuel, pilots and baggage handlers. In many cases, though, the airlines have also trimmed the excess capacity that they once provided in hopes of gaining a competitive advantage. With so much consolidation in the industry, they face less competition from one another. There’s no sense losing money on empty seats, so the airlines are basically scheduling only flights they can fill.
Airlines might have been expected to increase the number of flights with the steep drop in oil prices over the last couple of years, but this has not happened. One reason, says Earl Heffintrayer, lead airport analyst for Moody’s Investors Service, is a worsening pilot shortage caused by increased training requirements for new co-pilots and the mandatory retirement of baby boomer pilots at age 65. “If you have a limited supply of pilots, you want to fly them on larger planes. Smaller planes are the ones that are falling out, because you can make more money on the bigger ones,” Heffintrayer says.
What all this means is that many larger airports, including LAX, are handling more passengers than ever, even though they have fewer flights going in and out than they did before the Great Recession or even before the 2001 terrorist attacks.
As a result, many of their existing gates are now inadequate. If a waiting room that was designed to accommodate 50-seat shuttles now suddenly starts handling 70- or 110-seat jets, there aren’t enough places for people to sit with their carry-on baggage. Boarding lines spill beyond the gate area. Waiting times increase for nearby bathrooms and restaurants. The consequence is that many airports are having to remodel their terminals to handle the more concentrated bunches of passengers.
They are also adding new gates. “The capital improvements we saw over the last four to five years have been fixing existing facilities, making them look more modern and having a better passenger experience,” Heffintrayer says. “The next wave of capital, which is really looking to take off next year, is going to start with gate expansions. We’re seeing a real change in what airports are spending their money on going into the next year.”
Although many of the improvements were in the works for years, the recent financial strength of the airline industry is also fueling the building spree, says Khalid Usman, a vice president with the consulting firm Oliver Wyman who has worked on airport renovations. “In 2015, the U.S. airline industry’s combined profitability was $25 billion. That’s historically the highest number we’ve ever seen in the entire history of U.S. aviation,” says Usman. “That kind of profit is unknown in this type of industry. If you look at the prior 17 years [combined], that was actually negative $32 billion. It’s an industry that is very cyclical.”
With the return of airline profitability, San Francisco International Airport, which has seen more than a 50 percent annual traffic increase over the last nine years, has launched a five-year, $5.7 billion plan for adding and refurbishing gates, consolidating rental car facilities and extending its AirTrain. Atlanta’s Hartsfield-Jackson International, the busiest passenger airport in the world, is planning for more growth with a $6 billion effort that will add 15 gates, renovate parking garages and remodel its concourses to bring more sunlight into the buildings. Charlotte Douglas International Airport in North Carolina, which is also benefiting from surging traffic, is building nine new gates along with an expanded pre-security lobby, a new runway and a new traffic control tower.
For Los Angeles, the catalyst for the recent wave of upgrades was the arrival of the Airbus A380 in 2007. Nearly 100 Southern California suppliers contributed to the construction of the world’s largest jumbo jet, which is as tall as an eight-story building and has wings 260 feet across. Despite an early commitment to LAX, Airbus later said the A380 would make its U.S. debut at John F. Kennedy International Airport in New York City. Los Angeles protested, and Airbus settled on a compromise: Two A380s touched down simultaneously at JFK and at LAX.
But LAX didn’t have any good place to put the A380s once they landed. LAX crews were able to widen taxiways and make other improvements to the airfield to handle the jet’s size, but there was nowhere to park them at the terminals. Because the double-decker planes are so big, they require three jet bridges for passengers to board or disembark. The large wingspans also require a lot of space between gates. So the new jets had to park at remote gates at a far corner of the airfield. “A passenger is getting on an A380 in Dubai or Abu Dhabi in what could be a ‘gold-plated’ boarding bridge,” says Roger Johnson, the LAX official overseeing the physical improvements to the airport. “Then at LAX, they arrive in a concrete bunker, walk onto a concrete ramp and get onto a bus to get to a tunnel. That was one of the driving forces behind the Tom Bradley International Terminal.”
The stakes were high. Los Angeles’ economic development agency concluded in 2007 that the A380 and Boeing’s Dreamliner 787 were “competitive threats” to the entire region. Airlines operating the 550-seat A380s would send the jets to airports that could handle them. Meanwhile, the fuel efficiency of Boeing’s new long-haul jet, which carries half the passengers of the A380, could make it easier for overseas flights to skip over LAX completely. That was especially bad news, because overseas flights are highly lucrative. The economic development agency estimated that scheduling one daily transoceanic flight to LAX in 2006 generated $156 million in wages and added $623 million a year to the region’s economic output. “Southern California,” the agency concluded, “can ill afford to lose the competition for overseas routes.”
Luckily for Los Angeles, the A380 arrived at about the same time the airport settled long-disputed lawsuits over its master plan. Finally, the airport could start building. The first task was replacing most of the international terminal.
Garcetti now uses the new international terminal as a selling point to lure even more international flights to LAX. “We would fall all over ourselves to bring a company that would produce $300 million a year here. It’d be all over the news,” Garcetti says. “But people forget that one flight is worth about $1 billion a year.” Airlines seem to like L.A.’s pitch. LAX now handles more A380 flights (14 a day) than any other airport in this country. It is the only U.S. airport with three daily nonstop flights to and from China. And LAX has surpassed its rival JFK in connections to Asia, with 207 flights a week as of last year, compared to 121 for the New York airport.
Many of the flashy features in the Tom Bradley International Terminal are being included in renovations to the airport’s other terminals. They aren’t just designed to show off. Most of them have practical purposes as well.
As part of United Airlines’ renovation of its terminal at LAX, it is including “smart lanes” at its TSA security checkpoint. United is taking a page out of the playbook of Delta, which first tested the idea in Atlanta. With smart lanes, passengers each get their own counter space, side-by-side with those of other passengers, to load their items into bins. The system allows people to go at their own pace, because they’re not stuck in line behind someone who might be slower. United officials say the smart lanes will reduce security wait times by 25 percent.
LAX is also one of a few dozen airports currently working with U.S. Customs and Border Protection to use technology to speed up the process of clearing customs. The automated passport control system lets arriving passengers use kiosks for their initial screening.
Airport managers hope better use of technology, among many other things, will help boost the customer experience. Last year, LAX trailed only LaGuardia and Newark airports in J.D. Power’s rankings for lowest customer satisfaction among U.S. airports. Mike Taylor, a J.D. Power airport analyst, says technology is one way to make customers happier. “The highest-rated portion of the airport experience is check-in,” he says, “because it’s become more and more automated over the years.”
But terminal improvements can only go so far in making customers happier. Only 30 percent of passengers’ satisfaction is associated with the structure itself. “A new building will not solve all of your problems,” Taylor says. “It won’t solve all your problems because the same traffic pattern is present when you step outside the building, the same congestion.” The frustration with getting in and out of airports is only getting worse as airports become more crowded.
That’s what the next phase of LAX’s improvements is meant to address.
LAX is the third-busiest airport for passengers in the country, but that doesn’t tell the whole story. Atlanta and Chicago’s O’Hare airports handle more people, but many of them simply pass through as they transfer to other flights. LAX, on the other hand, is the top airport in the country for starting and ending trips. In other words, it has to get more passengers in and out than any comparable facility in the country.
The traffic problems at LAX are made worse by the fact that just about the only way to get to the terminals is with a car, bus or van, and all of those vehicles follow the same double-decker road in a U-shape past all nine terminals. Forty percent of the vehicles are commercial shuttles for hotels, rental car agencies or parking lot operators. One trip around the loop can easily take more than half an hour.
The growing popularity of air travel is making the traffic worse. Vehicles made more than 90,000 trips a day through LAX’s main terminal loop this summer, and that number grew to nearly 95,000 on holiday weekends. “It’s reached a state where it’s untenable,” says Deborah Flint, the CEO of Los Angeles World Airports, the agency that runs LAX. “The only real, effective option is to bring the mass transit connections to the airport.”
So Los Angeles is joining a growing list of cities building new rail connections to their airports. Denver; Oakland, Calif.; Phoenix; and Washington, D.C.’s Dulles Airport all either completed rail connections recently or are building them now. Garcetti says one reason he pushed to bring in Flint, who previously led the Oakland Airport, and L.A. Metro CEO Phillip Washington, who headed Denver’s transit system, is that both had experience creating rail connections to their respective airports.
LAX’s rail connection will be especially ambitious, because it depends on both the construction of an automated “people-mover” train at the airport and the completion of a new north-south light rail route by L.A. Metro.
The 2.25-mile people-mover route would run down the center of the U-shaped terminal area, so passengers from both sides would be able to cross over pedestrian bridges to get on at one of three stations. The free trains would arrive every two minutes.
The automated people-mover trains would stop at an intermodal center, which would have parking and shuttle services. It would be convenient to reach by car. But drivers could turn around or park before they get trapped in traffic near the terminals. Once they’re at the facility, passengers would be able to check in, print their boarding passes and get information before they catch the people-mover to the terminals. From the intermodal center, the people-mover would then go to the Metro station, which would also offer several bus connections. Work is already halfway completed on the 8.5-mile rail line, which is part of a much larger Metro expansion effort that began in 2008. The first trains are scheduled to start running along the Crenshaw/LAX line in 2019.
Finally, nine minutes after leaving the first station, the people-mover would stop at a consolidated rental car facility, which would bring some two dozen of LAX’s far-flung rental car lots under one roof. Both the automated people-mover and the rental car facility would be operated as public-private partnerships.
The overarching idea of the $5 billion project is to move as much traffic as possible away from the central terminal area. Just relocating the commercial shuttles to one of the intermodal facilities could have a huge impact, since they make up so much of the traffic that circles the terminals now. Rental car companies alone currently account for 3,200 shuttle trips a day around the loop, which would be eliminated.
Giving passengers transportation options is key to attracting the most desirable customers, especially those coming from overseas. “International passengers — there were over 20 million of them [at LAX] last year — expect an international city gateway that is connected to many different transportation options,” says Flint. “It’s par for the course for a major city like Los Angeles.”
For Garcetti, who has made infrastructure projects big and small a major focus of his administration, there is also an element of pride at stake in connecting LAX to a rail line, something that’s been promised for generations. “When I was campaigning and saying I would, after 50 years of talk, finally bring public transportation to the airport, it was an applause line from the furthest point away from the airport in the city to the next-door neighbors,” he says. “It’s not only an amenity, it’s a symbol of what we couldn’t do and we wondered if we ever would do. Are we capable of big projects? Are we capable of building again? That was a core part of our identity, but it was slipping through our fingers. I think this is a way of solidifying that.”
GOVERNING.COM
BY DANIEL C. VOCK | DECEMBER 2016
Powered by P3 INGENIUM the most comprehensive source for P3 project updates in North America.
NCPPP
December 6, 2016
Advocate Health Care Network v. Stapleton pits financially strained organizations against their own workers, who fear their promised pensions may not be there when they retire.
A new case on the U.S. Supreme Court’s docket could potentially involve millions of American employees and lead to billions of dollars’ worth of litigation. The justices’ decision could affect the viability of religiously affiliated orphanages, hospitals, schools, and nursing homes, and it could also threaten the financial security of a generation of their workers, fast heading toward retirement.
On its face, Advocate Health Care Network v. Stapleton and the two other cases it’s consolidated with may seem boring—after all, they’re about federal regulations on pension plans for church-affiliated hospitals. But these cases are actually the culmination of a new, vicious fight over the rights of employers that are loosely affiliated with religious institutions, and how they should have to pay retirement benefits to their employees in accordance with federal law.
The three consolidated cases in question seem likely to turn on something deceptively simple: the single word “established.” In 1974, Congress passed a law called the Employee Retirement Income Security Act, or ERISA, which, among other things, created guidelines for defined-benefit retirement plans, otherwise known as pensions. The two most relevant requirements in these cases have to do with good planning and risk mitigation: Employers have to put money into their employees’ retirement plans in a responsible way, so that they can afford to pay out big sums of money once those employees get old. But, if a company is in financial trouble when it comes time to pay out the promised benefits, there’s a safety net: ERISA established the Pension Benefit Guaranty Corporation, or PBGC, which is effectively a government insurance agency for underfunded pension plans.
These rules do not apply to houses of worship. Benefit plans “established and maintained” by these groups are exempt. The reasons for this are a bit opaque, said Norman Stein, a professor at Drexel University’s Kline School of Law, but an early draft of the law suggests Congress “didn’t want churches to have to open their books to the government.” Legislators also figured religious groups weren’t the problem: “People felt that it’s the church—it’s not going to let its plan fail and screw its employees,” he said. “Some of the writing about the statute has speculated that this was a reason, too—churches are moral institutions that are going to stand behind their promise [to pay for people’s pensions], because that’s what religions do.”
When ERISA first passed, it wasn’t clear whether this exception would apply long-term to religious organizations that weren’t houses of worship, like Jewish day schools or Catholic hospitals. In 1980, Congress amended the law to clarify that religiously affiliated groups can also maintain what’s called a “church plan,” so long as they satisfy certain requirements. For years, the IRS allowed religiously affiliated groups to offer these “church plans” without much controversy. Since 1982, according the hospitals’ Supreme Court petition, it has sent over 500 letters granting ERISA exemptions to organizations as diverse as the Princeton Theological Seminary and the Little Sisters of the Poor, an order of nuns.
Three years ago, employees across the country began filing lawsuits claiming that these organizations shouldn’t be exempt, after all. Current and former employees of three health-care systems filed suit against their employers: Dignity Health in California and Saint Peter’s Healthcare System in New Jersey, which are both associated with the Roman Catholic Church; and Advocate Health Care Network in Illinois, which is jointly associated with the the Evangelical Lutheran Church in America and the United Church of Christ. This is where everything comes back to “established”: Because these pension plans weren’t “established” by actual churches, the employees argue, they shouldn’t be exempt from ERISA.
The conflict matters for a few reasons. First, both sides arguably stand to lose incredible amounts of money. The Pension Rights Center, which supports the hospital employees, has identified at least three cases of allegedly failed church plans. When the owners of St. Anthony Medical Center in Illinois terminated one of its pension plans in 2012, the president and CEO told employees she was “very sorry for this surprising and disappointing news.” In 2013, the president and CEO of St. Mary’s Hospital in New Jersey wrote a letter to employees stating that “there simply are no funds remaining in the retirement plan’s trust.” And something similar happened last month at the now-closed St. James Hospital in New Jersey—the liability in that case is still murky.
Because these plans were not insured by the PBGC, they have left or may leave huge numbers of workers with less retirement money than they were promised. Hospital employees and their allies argue that church plans are a way for large employers to avoid complying with federal regulations—ones that were explicitly put in place to protect workers. Under church plans, a “[pension] promise is only as good as the word of the hospital,” Stein said. “If the hospital gets into financial trouble and the plan is not well-funded, you’re not going to get paid your benefits.”
But if these hospitals lose, they will also face intense financial consequences—and so will other religiously affiliated organizations across the country. Two appellate courts, the Third and Seventh Circuits, recently ruled against them, and “it is hard to overstate the burden and havoc these two decisions have created,” the hospitals wrote in their petition to the Supreme Court. If the lower-court rulings are affirmed, “this will mean renegotiating contracts with employees whose benefits are covered by collective-bargaining agreements, revamping benefit structures, redesigning pension-funding policies, and overhauling budget plans.”
There will also be future consequences: Under ERISA, employers are required to pay premiums to the PBGC and fund their pension plans at certain levels. When the law was created, “There was … a feeling that these kinds of church groups could not afford the cost of an ERISA plan,” said Howard Shapiro, a lawyer at Proskauer Rose in New Orleans, who has defended a number of hospitals that are being sued over their church plans. If these organizations are retroactively forced to comply with ERISA, they could face significant, and potentially ruinous, financial hardships.
The irony is that both religious groups and their employees could end up suffering if these hospitals lose at the Supreme Court. The church plans at issue “are still the old style of defined-benefit plans which everyone wishes they still had but don’t have anymore,” said Colleen Medill, a law professor at the University of Nebraska and counsel at the Koley Jessen law firm. “If [the hospitals] lose, and they pay whatever they have to pay in damages, they will probably, as a pure financial decision, freeze or terminate these plans and move over to a defined-contribution kind of plan.”
Defined-contribution plans typically include options like 401 (k) features, which have become much more popular in recent years—if you look at graphs of the number of organizations that have switched over to these plans, “they kind of look like the Nike swoosh,” said Medill. The reason behind this rise is straightforward: Defined-contribution plans shift the burden of bad economic times from employers to employees. A 401 (k) plan is great when the stock market is doing well, but “when the market goes down, maybe you don’t love that 401(k) plan so much because you bear the risk of market volatility,” Medill said. “In terms of retirement-income security, is it better to have an account that goes up and down every day with the market? Or is, it better to know that when I retire, I’ll get $3000 a month for life?”
In some ways, it’s surprising that all these issues are coming out now—ERISA has been around for 42 years, and Congress clarified the nature of church plans in 1980. In part, the delay is due the nature of retirement plans: People pay in over a long period of time, and they might not realize the consequences of being part of an uninsured pension plan until they’re about to hit 65 and realizing they don’t have the money they need to live.
But the delay also has to do with the way the IRS has dealt with religiously affiliated groups, Stein argued. “This went on for as long as it did [because] there was no regulation, no formal rule-making,” he said. During the 1990s and into the 2000s, a large number of religiously affiliated organizations won permission from the IRS to convert their pension plans into church plans. There were big incentives to do so: If they won church-plan status, the PBGC would refund a portion of the premiums they had paid in the past, which meant anything from a few thousand dollars to millions. Groups would get a private-letter ruling from the IRS, a form of guidance that does not set precedents for other taxpayers. But until 2011, when the agency began facing media scrutiny for what one amicus brief called “church-plan conversions,” organizations weren’t required to tell employees about the changes to their benefits plans. “By and large, employees didn’t even know it was happening—churches didn’t write a letter saying, ‘By the way, we just decided to screw you,’” said Stein.
Around the time a handful of plans began failing, a wave of lawsuits began—dozens have been filed since 2013, according to court documents. “There’s a whole movement among class-action lawyers where they see the potential to sue a very large plan and collect a lot of money in attorney’s fees and have some benefits for the employees,” said Medill. If the hospital employees win, “these employers are going to have to come up with a lot of money to fund these plans to come into compliance with ERISA.”
Not all churches and religious organizations dislike ERISA—in fact, any house of worship or religiously affiliated group can voluntarily choose to be subject to the law. “There are reasons to do that—namely to take advantage of federal preemption of state laws,” said Medill. ERISA limits the scope of what plaintiffs can win in a lawsuit, for example—if they operate in states that are more permissive, employers might find ERISA’s limited legal liability attractive. But that’s not what’s happening in these cases. “The real issue here is the funding requirement for the pension plans. If the plans were subject to ERISA, the employers would have to pay a lot more to fund these plans,” Medill said.
It’s hard to know how extensive the consequences of this Supreme Court decision could be. But they may not just be financial—Shapiro also sees the potential for religious-freedom conflicts. Under their church plans, religiously affiliated organizations can choose how they invest their money—pacifists can avoid putting money behind ammunitions companies, for example, or pro-life faiths can steer clear of investments related to abortion. Because ERISA imposes specific investment responsibilities on employers, Shapiro said, compliance “[could] actually conflict with some religious principles that are very important to these entities.”
These cases don’t break down along clear lines of good vs. evil. Various sides are trying to protect people who have compelling, conflicting needs, including employees who want to be able to survive retirement and hospitals with missions to follow their teachings and serve the poor. Everyone involved likely has some religious stake—many people who spend their lives working for religious hospitals are probably just as faithful as the organizations that employ them. There’s only one group that will really walk away victorious: As Medill put it, “This will be good for employment for ERISA lawyers.”
THE ATLANTIC
BY EMMA GREEN
The increasing role of the private sector in financing public transportation projects may provide an investment opportunity for municipal bond investors. In fact, President-elect Donald Trump has called for $1 trillion investment in infrastructure, much of which will depend on public-private investment for funding. Below is a review of these types of infrastructure projects, known as private-public partnerships (P3s), which have been a response to chronic funding shortages at the governmental level, and which are increasingly using municipal bonds as a cornerstone of their capital structures. These types of municipal bonds may offer incremental yield and portfolio diversification for municipal bond portfolios.
Wells Fargo Asset Management
By Lyle Fitterer, CFA, CPA
Dec. 4, 2016 3:57 PM ET
Fitch Ratings-New York-08 December 2016: Fitch Ratings has assigned an ‘A’ rating to the following Chicago Board of Education, IL bonds:
–$500 million dedicated capital improvement tax bonds, series 2016.
The bonds are expected to price the week of Dec. 12. Proceeds will finance specific capital projects listed in the authorizing resolution.
The Rating Outlook is Stable.
The Board of Education’s Issuer Default Rating (IDR) is ‘B+’ with a Negative Rating Outlook. The distinction between the ‘A’ rating on the series 2016 bonds and the ‘B+’ IDR reflects Fitch’s assessment that the pledged revenues meet the definition of “special revenues” under the U.S. Bankruptcy Code and therefore, bondholders are legally insulated from any operating risk of the board.
SECURITY
The bonds are secured by a first priority lien on revenues from the capital improvement tax (CIT), a district-wide property tax.
KEY RATING DRIVERS
SPECIAL REVENUE ANALYSIS: The ‘A’ rating on the dedicated CIT bonds is based on a dedicated tax analysis without regard to the board’s financial operations. Fitch has been provided with legal opinions by board counsel that provide a reasonable basis for concluding that the tax revenues levied to repay the bonds would be considered ‘pledged special revenues’ under Section 902(2)(e) of the U.S. Bankruptcy Code in the event of a board bankruptcy.
PREDICTABLE REVENUES: Growth in the levy (currently $47.9 million) is set by state statute at the rate of inflation; however, the levy jumps up in 2033 by $142.5 million, then resumes inflation-based growth. Debt service schedules are sized to the minimum levy, without assuming inflationary increases.
STRONG RESILIENCE OF PLEDGED TAX SECURITY: A multi-year levy with pre-determined minimum amounts combined with limited volatility in historical property tax collection rates support strong financial resilience for debt service coverage throughout economic declines.
RATING SENSITIVITIES
PROPERTY TAX COLLECTION RATES: The rating is sensitive to declines in property tax collection rates of a scale that would materially erode the protection inherent in the expected coverage ratios, given the fixed-dollar levy, 1.1x additional bonds test and moderate historical delinquency experience.
CREDIT PROFILE
The Chicago Board of Education provides preK-12 education to over 390,000 students within the city of Chicago. Its taxing jurisdiction is coterminous with the city of Chicago. The Chicago Public Schools (CPS) manages the school system, which is composed of 673 school facilities.
CIT VIEWED AS SPECIAL REVENUES
The specific features of the bonds meet Fitch’s criteria for rating special revenue obligation debt without consideration of the board’s general credit quality. Fitch believes bondholders are effectively insulated from the operating risk of the board as expressed in its IDR.
Fitch sets a high bar for considering local government tax-supported debt to be secured by special revenues, which provide security that survives the filing of a municipal bankruptcy (in preservation of the lien) and benefit from relief from the automatic stay provision of the bankruptcy code. We give credit to special revenue status only if, in our view, the overall legal framework renders remote a successful challenge to the status of the debt as secured by special revenues under Section 902 (2) (e) of the U.S. Bankruptcy Code.
Fitch has identified a number of elements we consider sufficient to reduce the incentive to challenge the special revenue status given the definitions outlined in the bankruptcy code. These include clear restrictions on the use of pledged revenues for identified projects and clear separation from the entity’s operations. Fitch has undertaken an extensive review of the statutory provisions that govern the use of the CIT. Those provisions, along with the legal documents governing the bond issuance, provide sufficient strength for Fitch to rate the CIT bonds higher than the IDR.
The bonds are secured by a first priority lien on CIT revenues. The board is authorized under the Illinois School Code to levy the CIT on all taxable property within the district, which is coterminous with the city of Chicago. State statute limits the permitted uses of CIT revenues to include construction, acquisition and equipping of school and administrative buildings, and site improvements. The board has identified specific capital projects in the bond resolution that may be funded either by bond proceeds or by residual CIT revenues. Any amendments to the project list must be passed by board resolution. The revenues legally cannot be used for general operations of the board.
STRONG RESILIENCE OF PLEDGED CIT SECURITY
The multi-year levy supporting debt service on the bonds required and received approval by the Chicago city council; however, no further approvals are necessary for the levy to be extended and collected for the life of the bonds. The multi-year levy is set by resolution at the time of bond issuance and no policy action is required to offset potential declines in assessed value. Importantly, the minimum amount of the levy is knowable in advance and the debt service schedule is sized to that, allowing for a minimum of 1.1x coverage. This leaves only the risk of diminishing collection rates, which historically have been well within the norm for U.S. municipalities.
To evaluate the sensitivity of the dedicated revenue stream to cyclical decline, Fitch considers both revenue sensitivity results (using a 1% decline in national GDP scenario) and the largest decline in revenues over the period covered by the revenue sensitivity analysis. Since the CIT revenue history is insufficient to conduct this analysis, Fitch uses a proxy of overall property tax collection rates, which it believes approximates future risk to CIT revenue sufficiency.
Based on historical property tax collection rates, Fitch’s Analytical Sensitivity Tool (FAST) generates a fairly modest 1.7% scenario decline in pledged revenues. The largest cumulative decline was a 2.7% decline during the recession between 2008 and 2009.
Given the 1.1x coverage, pledged revenues could withstand a 9% decline before they were insufficient to fully cover debt service. This is 3.3x the largest actual cumulative decline, or 5.3x the recessionary impact estimated in Fitch’s FAST scenario. Recent tax increases by Chicago-area governments could contribute to delinquencies beyond historical experience in a recession, but even so, Fitch believes collection rates would continue to support financial resilience consistent with an ‘A’ rating.
Chicago acts as the economic engine for the Midwestern region of the United States. The city’s residents are afforded abundant employment opportunities within this deep and diverse regional economy. The city also benefits from an extensive infrastructure network, including a vast rail system, which supports continued growth. The employment base is represented by all major sectors with concentrations in the wholesale trade, professional and business services and financial sectors. The city’s economic indicators are mixed with elevated individual poverty rates and average per capita income levels, but strong educational attainment levels. Recovery from the recession has been slow but steady. The unemployment rate is almost half of its recessionary peak but remains elevated relative to the state and nation. Population losses appear to have reversed.
ADEQUATE STRUCTURAL PROVISIONS
The additional bonds test dictates that projected CIT revenues must provide at least 1.1x coverage of annual debt service in each bond year. Projections may not include assumptions for inflationary increases prospectively. Fitch’s analysis assumes the pledged revenues would be leveraged to the full extent allowable under the additional bonds test.
Under the flow of funds, the CIT revenues are collected by the county collectors of Cook and DuPage Counties. The board has directed the collectors to transmit the CIT revenues directly to an escrow agent. The escrow agent transfers revenues needed for payment of debt service to the bond trustee daily. Revenues in excess of those required to meet annual debt service may be available to reimburse CPS for authorized capital expenditures.
The board covenants not to revoke the direction to the county collectors as long as the bonds are outstanding. Based upon review of bond counsel opinions Fitch believes that any future attempt to revoke the direction to the county collectors would be contrary to state statute.
The debt service reserve requirement of 14% of maximum annual debt service (MADS) will be funded with bond proceeds.
The board’s ‘B+’ IDR with a Negative Outlook reflects CPS’s chronic structural imbalance, slim reserves and weak liquidity position which are exacerbated by rising long-term liability costs, an historically acrimonious labor relationship and the lack of an independent ability to raise revenues. For more information on the board’s IDR, please see ‘Fitch Rates $426MM Chicago Board of Education (IL) ULTGOs ‘B+’; Outlook Negative’ dated Nov. 7, 2016.
Contact:
Primary Analyst
Arlene Bohner
Senior Director
+1-212-908-0554
Fitch Ratings, Inc.
33 Whitehall Street
New York, NY 10004
Secondary Analyst
Amy Laskey
Managing Director
+1-212-908-0568
Committee Chairperson
Laura Porter
Managing Director
+1-212-908-0575
Media Relations: Elizabeth Fogerty, New York, Tel: +1 (212) 908 0526, Email: elizabeth.fogerty@fitchratings.com.
Additional information is available at ‘www.fitchratings.com’.
Beginning in January 2017, the Electronic Municipal Market Access (EMMA®) website will provide free, convenient access to a new issue calendar enabling individual investors, issuers and other market participants to see new bond issues coming to market as well as final pricing scales for bond issues sold through competitive and negotiated sales.
Individual investors can use the calendar to locate upcoming bond offerings of interest. The new issue calendar provides issuers that may be planning on issuing a new security the ability to identify, monitor and compare prices of similar issues that are coming to market or have been recently sold. The Municipal Securities Rulemaking Board (MSRB) is providing the calendar to help all market participants make decisions that are right for them.
Taylor Riggs, a contributor to Bloomberg Briefs, talks with Joe Mysak about this week’s municipal market news.
December 9, 2016
Bloomberg News
CHICAGO — Chicago’s public school (CPS) system plans to sell a new type of bond issue in an attempt to separate the debt from the district’s severe financial woes and protect it in a potential bankruptcy filing, according to a document released by the district on Tuesday.
The preliminary prospectus for the debt indicates the Chicago Board of Education will issue $500 million of bonds secured solely by a capital improvement property tax and not by the district’s general obligation pledge.
That pledge currently covers about $6.8 billion of existing bonds that are rated junk by Moody’s Investors Service, S&P, and Fitch Ratings.
CPS, the nation’s third-largest public school system, is struggling with pension payments that will jump to about $720 million this fiscal year from $676 million in fiscal 2016, as well as drained reserves and debt dependency – factors that have pushed its GO credit ratings deep into the junk category and led investors to demand fat yields for its debt.
Illinois Governor Bruce Rauner last week vetoed a bill to give CPS a one-time $215 million state payment to help cover pension costs.
Ratings for the new bonds, backed by a $45 million a year property tax levy approved by the Chicago City Council in 2015, were not available. Because that tax revenue can only be used to fund capital projects and not operations, CPS is hoping bondholders will consider the debt a safer bet than the district’s GO bonds.
A CPS spokeswoman could not immediately be reached for comment.
CPS cannot currently file for municipal bankruptcy in Illinois, although there have been attempts to change state law to allow such a move. The prospectus includes legal opinions on a “hypothetical bankruptcy” by CPS that conclude payments on the new bonds would not be automatically stopped by a federal bankruptcy court and that bondholders would retain a lien on the tax revenue.
The prospectus was released a day before the schools’ governing board, appointed by Chicago Mayor Rahm Emanuel, votes on an amended fiscal 2017 budget to account for a new contract with teachers. The bond issue is tied to a bigger capital plan CPS announced last week.
The bonds, to be priced through Barclays and J.P. Morgan, carry term maturities in 2036 and 2046.
By REUTERS
DEC. 6, 2016, 6:36 P.M. E.S.T.
(Reporting by Karen Pierog; Editing by Matthew Lewis)
NEW YORK — The past year has meant a wild ride for investors in municipal bond funds.
Between September 2015 and this past October, municipal bond funds had 54 straight weeks of inflows, with investors pouring some $68 billion into them. Muni fund owners were rewarded handsomely: In the first six months of 2016, the BlackRock Strategic Municipal Opportunities fund returned 4.7 percent, for example. The 10-year yield on the AP Municipal Bond index, which moves inversely to bond prices, hit a low of 1.69 percent in July.
Then the bear came out roaring.
In early October, the flow of dollars into muni funds stalled as bets increased that the Federal Reserve would raise interest rates late this year. Selling accelerated after Donald Trump’s surprise victory on expectations that his plans to boost economic growth would hurt the price of bonds. In November alone, investors yanked over $10 billion from muni funds, according to the Investment Company Institute. BlackRock’s Strategic Municipal Opportunities fund fell 4.4 percent.
Peter Hayes, co-manager of the $4.7 billion BlackRock Strategic Municipal Opportunities fund, recently talked about the about-face for munis, and how investors can best navigate the current uncertainties. Answers have been edited for length and clarity.
Q: Muni bonds have just undergone an intense sell-off. Do you think it has gone too far?
A: Well, every big sell-off winds up being a good long-term buying opportunity, at some point. It’s a question of finding the right entry point.
This sell-off has been so dramatic that it created value in a short amount of time. Municipal bonds are yielding more than Treasurys right now, and last week we began to see some stabilization of the market.
But given the headwinds, I’m not sure we are completely out of the woods yet.
Q: Which headwinds worry you the most?
A: Interest rates continue to be a concern. If rates go higher, that will scare investors from long-term assets.
Q: What about tax rates? Some believe that the Trump administration will slash tax rates for higher earners, which would diminish the value of muni bonds’ tax-free income.
A: That’s a potential headwind as well, but it’s much longer term. I think we need to get past the inauguration and see what the new administration is really most concerned with.
Q: With all the talk of tax reform, some have wondered if the municipal tax exception could be at risk.
A: We emphatically don’t believe that we will lose the muni tax exemption. Taxes are a bit of an overhang to the market, but a lot of that’s already been factored into the price of the bonds today.
Q: Sounds like taxes are a wildcard. But it does seem likely that President-elect Trump will try to boost infrastructure spending. How do you think that will impact the muni market?
A: The initial reaction to the infrastructure proposals was that it would be negative, because it would mean more issuance in the muni market. That is usually a headwind for performance, given that we don’t know what the demand is going to be.
But if you really look at the Republican proposals, they’re talking about an infrastructure bank and private tax credits. That doesn’t translate into increased muni issuances.
It’s also important to keep in mind that this year, about 60 percent of new issuance was related to issuers that were refinancing their debt.
If rates move higher, refunding will be less attractive. So I don’t see the current proposal as we know it today translating into higher issuance in the muni market in 2017, especially if the first half of the year is driven by all this insecurity around tax policy. Altogether, I don’t see infrastructure as a big headwind.
Q: So what’s the best strategy for investors right now?
If you already own munis, don’t sell. The market has already sold off significantly.
If you need a bit of income and want to take a position, shorter-term bonds look cheap. For the most part, stay in the three- to five-year range, where you will be less exposed to a change in tax policy and a potential rise in longer-term interest rates. Because the correction has been so large, those looking for more income might want to put a portion of their money in the 10- to 15-year part of the curve.
Otherwise, I suggest waiting on the sidelines. The severity and size of the move is likely to have scared investors. The next several weeks are very important. If the fund flows continue to be very negative, we have to be cautious. If they stabilize, then I think we can be more confident that the worst is over.
By THE ASSOCIATED PRESS
DEC. 8, 2016, 1:22 P.M. E.S.T.
The GFOA Executive Board approved two new best practices in addition to updates to four other existing best practices at the September 2016 meeting. These documents provide recommendations to government finance officers in the areas of treasury and investment management, and retirement administration and benefits administration.
Cash-Flow Analysis. This new best practice recommends six essential elements of a cash flow analysis, an important tool to inform management decision making. GFOA recommends that state and local governments perform ongoing cash-flow analysis to ensure sufficient cash liquidity to meet disbursement requirements while also limiting idle cash.
Investment Policy. This new best practice recommends reviewing and, if necessary, updating the investment policy annually. The document includes statements on eight key points, including the fact that an investment policy enhances the quality of decision making and demonstrates a commitment to the fiduciary care of public funds. As a result, a public fund’s investment policy is the most important element in a public funds investment program. GFOA recommends that all public entities establish a comprehensive written investment policy, adopted by the governing body.
Hybrid Retirement Plan Design. This best practice was revised to reflect the continuing evolution of hybrid plan designs. GFOA recommends design elements for hybrid plans or plans that combine hybrid features with defined benefit or defined contribution plans.
Establishing and Administering an OPEB Trust. This best practice was revised to align with language related to the January 2016 best practice, Sustainable Funding Practices for Defined Benefit Pensions and Other Postemployment Benefits. It includes a new recommendation that governments commit to funding promised benefits based on regular actuarial valuations, with a target funded ratio of 100 percent or more. GFOA also recommends creating a qualified trust fund to prefund OPEB obligations.
OPEB Governance and Administration. This revision aligns the best practice with the Sustainable Funding Practices for Defined Benefit Pensions and Other Postemployment Benefits. That best practice, from January 2016, recommends conducting an audit of actuarial valuations to review the appropriateness of the actuarial methods, assumptions, and their application. The updated language addresses employers that issue periodic studies, experience studies, and periodic actuarial audits. GFOA recommends that sponsoring entities provide a clear, well-documented governance structure to guide governing bodies and plan administrators.
Educating Employees About the Adequacy of Retirement Benefits. As part of GFOA’s effort to consolidate and develop more comprehensive best practices, this updated document addresses elements of a sound educational program as well as guidance for employers and retirement systems that procure external providers of financial education and advice. GFOA recommends that public-sector employers and plan administrators inform and educate employees about future retirement income and the variables that may affect future retirement income, depending on the income source.
Government Finance Officers of America
December 1, 2016
Huge tax breaks for private investors; Neglects vital public road, bridge, school, and water projects
President-elect Trump’s infrastructure plan, which claims that it would deliver up to $1 trillion in new infrastructure investment, almost surely would deliver far less — and it would not deliver many of the most important needed projects for roads and bridges, public transit, schools and public housing, water facilities, and so on, nor deliver them in the struggling communities in which they’re most needed.TRUMP’S PLAN WOULD MAINLY BE A TAX-CUT WINDFALL TO PRIVATE DEVELOPERS TO BANKROLL FOR-PROFIT PROJECTS THEY LIKELY WOULD HAVE UNDERTAKEN ANYWAY. That’s because Trump’s plan would mainly be a tax-cut windfall to private developers to bankroll for-profit projects they likely would have undertaken anyway.
CENTER ON BUDGET AND POLICY PROPOSALS
BY CHYE-CHING HUANG, PAUL N. VAN DE WATER, RICHARD KOGAN, AND DAVID KAMIN
DECEMBER 2, 2016
Fitch Ratings-New York-01 December 2016: Low commodity prices will keep fiscal pressure on energy states in 2017, Fitch Ratings says. We expect severance taxes and related revenue sources to remain low, while personal income and sales tax collections will remain suppressed, prolonging fiscal pressure.
This year, price and production shifts among energy states contributed to some Issuer Default Rating (IDR) downgrades: Alaska to ‘AA+’ from ‘AAA’; Louisiana to ‘AA-‘ from ‘AA’; and West Virginia to ‘AA’ from ‘AA+’. Alaska and West Virginia carry Negative Rating Outlooks, in addition to Oklahoma (IDR of ‘AA+’).
The anticipated loosening of federal environmental oversight to promote increased energy development and the recently positive crude oil price trend will not overcome the global market forces that are restraining crude oil and natural gas prices. The glut of crude oil, an international commitment to reduce coal use to combat climate change and increasing use of renewables for energy needs will keep demand for coal weak.
Contact:
Marcy Block
Senior Director
US Public Finance
+1 212 908-0239
Rob Rowan
Senior Analyst
Fitch Wire
+1 212 908-9159
Media Relations: Elizabeth Fogerty, New York, Tel: +1 (212) 908 0526, Email: elizabeth.fogerty@fitchratings.com.
Additional information is available on www.fitchratings.com.
A roundup of money (and other) news governments can use.
GOVERNING.COM
BY LIZ FARMER | DECEMBER 2, 2016
Sales of municipal bonds and notes slowed to $23.7 billion in November, the slowest month this year and less than half of October’s record high, according to Thomson Reuters data.
The slump in new issuance came during a month peppered by holidays and the U.S. presidential election. In October, $51.6 billion of new sales came to market, the biggest month of issuance since records began in the 1980s.
Bond issuers also canceled some deals in November as market volatility spiked and yields surged after the surprise Nov. 8 election of Donald Trump as president.
“The combination of a selloff in Treasuries affecting fixed income in general and a less active primary market caused much of the activity to go elsewhere,” Janney Fixed Income Strategy reported on Wednesday.
Municipal supply had been surging in recent months as state, city and other public agencies eagerly sold bonds and notes at low interest rates.
Reuters
Wed Nov 30, 2016 | 1:48pm EST
(Reporting by Robin Respaut; Editing by James Dalgleish)
David Kotok, chairman and chief investment officer at Cumberland Advisors, and Bloomberg’s Michael McKee examine higher bond yields and the impact of infrastructure spending on municipal bonds. He speaks on “Bloomberg Daybreak: Americas.”
Bloomberg
December 5, 2016
President-elect Donald Trump and a Republican-controlled Congress may take steps to make municipal bonds less attractive to investors, potentially undermining a popular tool to finance bridges, roads and other public projects.
Trump is calling for $1 trillion worth of infrastructure spending that would be financed in part through tax credits to investors and construction companies, Frank Shafroth, director of George Mason University’s Center for State and Local Government Leadership, told Bloomberg BNA Nov. 29.
“Tax credits to investors insert federal, instead of state/local authority, guidance,” Shafroth said. “It risks undercutting the planning of a state or local government.”
A further concern for states and local governments is that Trump and Congress may move to tax municipal bonds to pay for credits or tax cuts in other areas. If that happens, expect states and cities to jump into the fray.
“Stated simply, state and local governments will want to preserve the existing rule for tax exemption of municipal bond interest because to eliminate it would increase the cost of borrowing,” Charles S. Henck, a Ballard Spahr LLP partner who practices in public finance and tax law, told Bloomberg BNA Nov. 28.
The president-elect’s transition team didn’t respond to repeated requests for comment.
Trump Advisers
Trump economic advisers question whether state and local governments should be able to issue debt on which the interest is exempt from federal taxes.
Those advisers—private-equity investor Wilbur Ross and University of California at Irvine business professor Peter Navarro—argue that municipal bonds aren’t an efficient way to pay for public projects. For one, a percentage of the money goes to the bondholder.
Navarro declined to comment for this story, and Ross, the billionaire who Trump is expected to nominate as commerce secretary, couldn’t be reached.
Navarro and Ross, however, authored a paper during the general election campaign explaining problems with tax-exempt bonds and outlining alternative methods Trump is considering.
Private investment and federal tax credits could serve as a “critical” supplement to existing financial programs, public-private partnerships and Build America Bonds, the paper said.
Shafroth, however, said that a federal plan of private investment and tax credits may fail to take into account that states and local governments—unlike the federal government—have capital-planning processes and capital budgets that could be disrupted.
Cowboys, ‘Big Dig.’
When investors buy municipal bonds, they are lending a local or state government money for a fixed period of time, often to pay for roads, schools and other construction projects.Arlington, Texas, for example, is paying off $300 million in bonds used to finance AT&T Stadium, home of the Dallas Cowboys. In Massachusetts, the governmental entity known as MassPort continues to pay for the “Big Dig,” a $24 billion project that placed Interstate 93 under the city of Boston.
In exchange for an investment, the local or state governments pay the investor interest throughout the term of the bond. Currently, interest isn’t taxable.
The investor is also entitled to the principal of the bond.
Spurred to Act
Generally, states don’t involve themselves in Washington tax debates when Congress moves to repeal tax breaks or lower tax rates, because a broader tax base for the federal government means a broader tax base for states, Joe Henchman, vice president of legal and state projects at the Tax Foundation, told Bloomberg BNA Nov. 22.
But eliminating the bond interest exemption could make bonds—a favorite method of paying for large, expensive projects—less attractive to investors.
If the exemption is “on the table, states may get directly involved in the debate,” Henchman said.
Bloomberg BNA
By Che Odom
November 30, 2016
To contact the reporter on this story: Che Odom at COdom@bna.com
To contact the editor responsible for this story: Ryan C. Tuck at rtuck@bna.com
President-elect Donald Trump’s ambitious plan to raise $1 trillion for infrastructure is a boondoggle that would line the pockets of wealthy investors while not meeting the need for infrastructure repair or improvement in much of the country, according to an analysis released Thursday by a progressive think tank.
Trump’s plan “shovels money at wealthy investors instead of solving real infrastructure challenges,” according to a white paper from the Center for American Progress.
The paper figures to be the first salvo in a lively debate if Trump follows through on his promise to make refurbishing the nation’s roads, bridges and transit systems a centerpiece of his administration, coupling it with his vow to put unemployed middle-class Americans back to work.
“It’s really a huge failure because it just doesn’t deliver on what the actual needs are out there,” said Kevin DeGood, the report’s author. “These really complicated deals for which contracts [with private investors] can be beneficial only apply to one-half of 1 percent of the need that is out there.”
Trump’s transition team did not respond when forwarded a copy of DeGood’s report for comment.
DeGood is director of infrastructure policy at the center, which was founded and led by John Podesta until he resigned to become chairman of Hillary Clinton’s presidential campaign.
The challenge is a simple one: Investors want a return on their money, and very few transportation projects provide one. Tolls can be imposed on selected roads and bridges, but the vast majority of them offer no opportunity to recoup investment.
“That would be a very rude shock to a lot of people who voted for Donald Trump if they suddenly found that the rural roads in Nebraska or Indiana — the interstate highway, which they paid for and they’re still paying gas taxes — now they have to pay a toll on top of that?” said Rep. Peter A. DeFazio (Ore.), the ranking Democrat on the House Transportation Committee. “They probably wouldn’t be happy.”
The Congressional Budget Office said last year that just 26 private-investment projects were completed or underway nationwide.
The Trump plan would give private investors an 82 percent tax credit to put money into projects. Trump said his plan would lead to up to $1 trillion worth of new projects, but simply lowering the cost of money with tax credits to investors is unlikely to unleash a new round of big-ticket projects, because states already have access to the municipal bond market.
According to Trump, his proposal would play a central role in funding $1 trillion in projects without draining taxpayer dollars lost by offering the tax credit incentives. That’s because, he said, the tax revenue would be recouped by taxing the wages of people put to work on the projects and from taxes paid by contractors hired to do the work.
DeGood’s paper says: “The Trump plan calls for spending as much as $137 billion from the federal treasury in the form of tax credits to wealthy Wall Street investors. This massive subsidy would lower the cost of equity capital to a level roughly equivalent to municipal bonds.”
In an interview as his analysis was released, DeGood said the lack of sufficient tax dollars, not a need for financing, was the cause of the failure to address infrastructure needs.
“If just having access to debt at 3 percent were all that project sponsors needed to kick off big projects, then that would have happened already,” he said. “We’re in the lowest cost financing universe that we’ve been in since World War II, and yet we don’t see explosive growth in construction activity because it’s a lack of tax revenue, not a lack of access to debt.”
The second part of the Trump plan involves repatriation, a much-talked about idea to lure home $2.5 trillion in cash held overseas by U.S. corporations. Trump has proposed reducing the rate companies would pay to bring the money home to 10 percent from 35 percent. Those companies then could invest slightly more money in infrastructure projects, gain the 82 percent tax credit and effectively erase that 10 percent tax.
The Washington Post
By Ashley Halsey III
December 1